
Economic and Social Reports
A profile of corporate exits and insolvencies
DOI: https://doi.org/10.25318/36280001202301000005-eng
Abstract
The COVID-19 pandemic had a substantial impact on business dynamics, leading to the temporary or permanent closure of many businesses. By contrast, corporate insolvency proposals and bankruptcies under the Bankruptcy and Insolvency Act declined in 2020. Using a newly developed linked database, this paper presents trends in exits, insolvency proposals and bankruptcies across business and financial characteristics among corporations from 2004 to 2020.
Contrasting differences are found between exits and bankruptcies across firm sizes, industries, and provinces and territories. Small firms are more likely to exit than larger firms, while bankruptcy rates are lower among small firms compared with large firms. There are important differences across industries, with businesses in manufacturing having some of the lowest exit rates but relatively high bankruptcy rates. At the provincial and territorial levels, there is little variation in exit rates, but Quebec stands out for having low exit rates and the highest bankruptcy rates.
In terms of financial characteristics, bankrupt businesses tend to have low levels of labour productivity, profitability and liquidity, and high levels of leverage. The results are similar for businesses that exit but far less pronounced, likely indicative of exits occurring for reasons other than business failure or financial distress. The results also suggest that bankrupt businesses became more vulnerable over time in terms of their financial ratios the year preceding bankruptcy.
Keywords: business dynamics, business failure
Authors
Amélie Lafrance-Cooke is with the Economic Analysis Division at Statistics Canada. Alex McDougall is with the Marketplace Framework Policy Branch at Innovation, Science and Economic Development Canada.
Acknowledgments
The authors would like to thank Danny Leung, Patrice Rivard, Sarah Gaudet, Ivan Burvill and Elizabeth Lang for their helpful comments on the paper.
Introduction
The severe financial pressures on businesses resulting from the COVID-19 pandemic led to early concerns that there could be a large spike in the number of business failures and insolvencies. However, the number of business insolvencies filed under the Bankruptcy and Insolvency Act (BIA) did not increase as expected; instead, it decreased throughout the pandemic. Budget 2021 credits the Government of Canada’s introduction of a set of programs in 2020 to support businesses, including the Canada Emergency Wage Subsidy (CEWS) and the Canada Emergency Business Account (CEBA), as one of the reasons why business failure did not materialize as expected.
Yet formal insolvencies are not the whole story. Formal insolvency is but one path that a business in distress may take. Struggling businesses may close or exit without a formal insolvency. Estimates from the Longitudinal Employment Analysis Program show that, in contrast to the insolvency trends, the pandemic had a significant impact on business exits, with 13.9% of employer businesses in the private sector exiting in 2020 compared with 11.7% in 2019 (Statistics Canada, 2023). This finding represents a larger increase than observed during the 2008/2009 financial crisis, where the exit rate increased by 1 percentage point. Moreover, examining exit rates at the aggregate level may mask what is occurring at the microeconomic level, in particular across industries and businesses of different sizes. For instance, the exit rate of businesses in arts, entertainment and recreation, one of the industries most affected by the pandemic, increased by 3.5 percentage points from 2019 to 2020. By contrast, exit rate increases were much less drastic in certain industries, such as agriculture, forestry, fishing and hunting (exit rate up 0.1 percentage points) and manufacturing (exit rate up 1.1 percentage points). Also, recent evidence of the impacts of the pandemic on businesses showed that small firms were among the hardest hit (Gu, 2020; Johnston et al., 2021). The notable increase in business exits during the pandemic raises the possibility that business failures materialized in other informal exit patterns rather than in formal insolvency pathways.
Using a newly developed linked database, this paper presents a profile of incorporated businesses that exited or commenced insolvency proceedings by firm size, industry and geography, over the 2004-to-2020 period. Looking at both exit and insolvency provides a more complete picture of marketplace trends, business failure trends and the impact of the pandemic on the Canadian economy. This paper also contributes an understanding of marketplace dynamics of firm failure by building a transition matrix to show the relationship between exit and insolvency. Finally, the paper provides new data on the underlying causes of insolvency and exit by examining distributions of various financial ratios across the dynamics categories.
Data sources and definitions
Insolvency
The BIA, an insolvency law in Canada used by individuals and businesses, provides options for insolvent firms to liquidate through a bankruptcy or to work with their creditors to restructure their debt and continue as a going concern (a commercial proposal). In a bankruptcy, a licenced insolvency trustee liquidates the assets of the insolvent business and distributes the proceeds to creditors. In a restructuring, companies negotiate more sustainable debt terms with creditors and take other steps toward financial sustainability while under court supervision, with the goal of preserving the business as a going concern. When an agreement cannot be reached between a corporation and its creditors, a bankruptcy procedure is undertaken.
Insolvency laws like the BIA serve important marketplace functions by providing frameworks and processes to help minimize the impact of business insolvency on stakeholders and ultimately make the best of a bad situation. The bankruptcy liquidation process also seeks to ensure that the assets of failed businesses are returned to the economy for productive purposes contributing to marketplace dynamics. Commercial restructuring processes in insolvency help to preserve value for businesses by keeping a business alive as a going concern, protecting jobs, maintaining relationships between the business and suppliers and contractors, and ultimately preserving the value of the assets for the benefit of creditors. Transparency, predictability and efficiency in the legal framework also help to support lending and investment.
Exits
The term “business exit” refers to the permanent closure of a business and an exit from the marketplace. By contrast to insolvency, which typically occurs because of the financial distress of the business, businesses may close for many different reasons, making “exit” a more heterogenous category. For instance, studies often distinguish voluntary reasons from involuntary reasons for a business’s exit (see Cefis et al. [2022] and Wennberg and DeTienne [2014] for literature reviews). An involuntary exit would include any business that closes permanently because of financial distress; in this way, the exit would overlap to some degree with insolvency. A business bankruptcy liquidation is, in fact, an exit of the business from the marketplace. Other businesses may involuntarily exit because of failure but without a formal bankruptcy process. For example, a single creditor might seize the entity’s encumbered assets without a bankruptcy, or, if the business’s debts are guaranteed by the owner’s assets, the business may exit informally while the individual owner becomes insolvent. Alternatively, a business owner may abandon the business or walk away without a formal process.
A business exit can also happen voluntarily. Individual owners may close their businesses for idiosyncratic reasons (e.g., retirement, preference, opportunity or change in life circumstances). Owners may sell their businesses or self-liquidate profitable businesses to obtain the equity. Mergers and acquisitions may also be a form of business exit. Insolvency, it should be noted, does not necessarily mean an exit, because an insolvent business may survive and continue as a going concern through a restructuring proposal.
Insolvency and exit dynamics
There is little pre-existing literature on the relationship between insolvency and exit in the Canadian marketplace. An understanding of the purposes of the insolvency framework would lead to some expectations about insolvency trends and the types of businesses that are likely to commence an insolvency proceeding. First, because insolvency is about the settlement of debts, it is more likely to be used by indebted and leveraged businesses, as well as those that are illiquid and unable to make payments to creditors as they become due. Second, insolvency seeks to preserve and maximize the value of business assets, but it involves some transaction costs associated with legal fees, trustee expenses and time, among others. As such, businesses that have assets to preserve and realize on, and that can cover the transaction costs, would be expected to use insolvency more than those that do not.
Since exit is a broad category that includes both voluntary and involuntary types, only some overlap with insolvency is expected. For instance, entities that exit voluntarily may not be financially distressed or insolvent. Entities that exit involuntarily because of financial distress may still choose an informal exit option that does not involve a formal insolvency filing. The reasons for such a choice may vary; they could include businesses that have few creditors or insufficient marketable assets to cover the transaction costs of using the insolvency system.
The data
This study uses the 2021 National Accounts Longitudinal Microdata File (NALMF), an administrative dataset that covers all unincorporated and incorporated firms in Canada with employees. It includes detailed information on employment and financial characteristics of businesses. For the purposes of this study, the sample of enterprises is restricted to incorporated businesses with employees and excludes businesses in educational services, health care and social assistance, and public administration. Businesses with unclassified industries are also excluded.
To obtain information on insolvencyNote filings, the NALMF is linked to the corporate insolvency data from the Office of the Superintendent of Bankruptcy (OSB) at the enterprise level.Note For corporations, it is possible to distinguish an ordinary administration (i.e., bankruptcy) from a Division 1 proposal, which is a proposal made to creditors in an attempt to negotiate how to repay the debt. The data capture incorporated businesses that filed under the BIA. Businesses filing under the Companies’ Creditors Arrangement Act (CCAA) and receiverships are excluded from the study.Note The sample of businesses that filed for insolvency in this study includes those that could be linked to the NALMF.Note
By linking the NALMF data with the OSB insolvency data, it is possible to determine which types of businesses become insolvent and to compare trends and dynamics in insolvency and exit over time by sector, business size and other firm-level characteristics. Linking the OSB data to the NALMF data allows this study to go beyond work previously conducted by Statistics Canada on business bankruptcy in Canada, such as studies by Baldwin et al. (1997) and Lecavalier (2006). Baldwin et al. (1997) seek to determine the dynamics and causes of bankruptcy from a survey of trustees and bankrupt firms. Lecavalier (2006), by contrast, presents a longer-term view of insolvency trends at the national and regional levels and advances analysis that seeks to correlate aggregate trends with background macroeconomic conditions. Both studies, while comprehensive, are limited in their ability to make statements about the causes of bankruptcy because of selection bias, as they look only at bankruptcies. The NALMF, by contrast, includes all firms, and it is possible to compare insolvent and non-insolvent firms, including at earlier points in their life cycle. In addition, the previous studies cover the 1980s and 1990s, while this paper provides more recent information and incorporates annual firm-level information, including financial characteristics and employment, which was not available previously.
Employment is based on the average monthly employment from the payroll statement of account for current source deductions (PD7) or the T4 individual labour units if PD7 information is missing. A business is defined as an exit in year t if it has employees in year t-1 but no employees in year t and in year t+1. The data do not provide reasons for business exits, whether voluntary or involuntary. For the purposes of this paper, if a business exits in the same year that it is bankrupt or submits an insolvency proposal, it is deemed to belong to one of the latter groups and not counted as an exit. This is done to distinguish businesses that exit from businesses that file for insolvency and analyze them as separate events. Exit and insolvency rates are calculated by taking the number of exits or insolvencies and dividing it by the number of continuing (incorporated) businesses, defined as businesses that had employees in years t and t-1.
Results
In 2020, the corporate exit rate and the insolvency rate moved in opposite directions
How do trends in exit and insolvency rates compare, how have they changed over time, and how do they change in response to external and macroeconomic conditions? Chart 1 compares exit and insolvencyNote rates over a 16-year period and shows that few incorporated businesses file for insolvency on an annual basis, in particular when compared with the share of businesses that exit. Over the 2004-to-2020 period, on average, 0.22% of businesses were bankruptcies and 0.04% were proposals, compared with 9.0% of businesses that exited annually. This finding is not surprising, since the business exit category is broader and encompasses exits for several reasons beyond financial distress.
It is well documented that business failure follows macroeconomic shocks, such as recessions. That is, the number of exits and insolvencies generally tends to increase during economic downturns (Macdonald, 2014; Fortier-Labonté, 2021). Not surprisingly, the trends in exit rates and insolvency rates since 2004 show that they increased during the 2008/2009 financial crisis. The exit rate reached 9.6% in 2009 but has generally decreased since then. In 2020, the exit rate reached 10.2%, driven by the impacts of the pandemic. By comparison, while insolvency rates have been generally falling since 2009, they decreased further in 2020. Notably, the exit rate in 2020 reached a historical high over the period examined.
Chart 1 also shows a puzzling trend, namely, that during the pandemic insolvencies decreased while exits increased. Indeed, the correlation between the exit rate and the bankruptcy rate was highly positive from 2004 to 2019, equal to 0.72; when 2020 is included, it drops to -0.06. Potential explanations include the disproportionate sectoral impact of the pandemic, whereby businesses likely to exit without formal insolvency were harder hit. A higher business exit rate could have been the result of more voluntary exits from business owners rather than more business failures. Public health restrictions may have dissuaded businesses from accessing formal processes for insolvency or made it more difficult, meaning that some otherwise insolvent entities exited without a formal process.

Data table for Chart 1
| Exit rate | Bankruptcy rate | Insolvency proposal rate | |
|---|---|---|---|
| percent | |||
| 2004 | 9.13 | 0.23 | 0.05 |
| 2005 | 8.81 | 0.24 | 0.04 |
| 2006 | 8.86 | 0.23 | 0.04 |
| 2007 | 9.12 | 0.23 | 0.04 |
| 2008Data table for chart 1 Note 1 | 9.22 | 0.26 | 0.04 |
| 2009Data table for chart 1 Note 1 | 9.62 | 0.28 | 0.05 |
| 2010 | 9.21 | 0.22 | 0.04 |
| 2011 | 8.60 | 0.21 | 0.04 |
| 2012 | 8.66 | 0.19 | 0.04 |
| 2013 | 8.69 | 0.21 | 0.05 |
| 2014 | 8.84 | 0.22 | 0.05 |
| 2015 | 8.80 | 0.22 | 0.04 |
| 2016 | 9.07 | 0.21 | 0.04 |
| 2017 | 9.08 | 0.20 | 0.04 |
| 2018 | 8.72 | 0.19 | 0.03 |
| 2019 | 8.72 | 0.19 | 0.03 |
| 2020Data table for chart 1 Note 1 | 10.19 | 0.15 | 0.03 |
|
|||
Nearly all bankruptcies lead to exits, while half of insolvency proposals remain active businesses
While the previous section presents exits, insolvency proposals and bankruptcies as mutually exclusive events, they can be intertwined. On the one hand, since bankruptcy results in liquidation, it can be considered a form of exit. On the other hand, commercial proposals are designed for viable companies that are financially distressed to avoid exit and bankruptcy and help ensure the continuation of the company.
Table 1 shows the relationship between businesses that were continuers, bankrupt or insolvent in year t, and their status in the next year, year t+1,including exits.
More than 90% of continuers remained active in the following year. The remainder of businesses exited (8.5%) or filed for insolvency (0.03%) or bankruptcy (0.16%). These results mirror those presented in Chart 1.
Insolvency commercial proposals are distinguished from bankruptcies because of their nature and intent, as demonstrated in the Table 1 results. As expected, 97.3% of bankruptcies were exits following the bankruptcy year, meaning that the terms “bankruptcy” and “exit” are nearly synonymous. The few (2.4%) that remained active or continuing may be attributable to late tax filers that were still being captured in the dataset as having employment in the year following bankruptcy.Note By contrast, commercial proposals are intended so that the business can restructure its loans to remain in operation. Indeed, more than half of insolvency proposals remained continuing businesses in the year following the proposal. Less than 10%Note of insolvency proposals became bankruptcies in the year following the proposal. In other words, the majority of proposals do not become bankruptcies. The remainder, or 38.2%, informally exited.Note Among this group of exiters, 15% to 20% are categorized as exiting because of a merger with or acquisition by another business or a restructuring of their corporate identity, which is a common outcome.
| Year t | Year t+1 | |||
|---|---|---|---|---|
| Continuer | Exit | Bankrupt | Insolvency proposal | |
| percent | ||||
| Continuer | 91.32 | 8.48 | 0.16 | 0.03 |
| Bankrupt | 2.42 | 97.33 | Note ...: not applicable | Note ...: not applicable |
| Insolvency proposal | 54.79 | 38.29 | 6.77 | Note ...: not applicable |
|
... not applicable Note: The percentages in the rows do not add up to 100 for bankruptcies and insolvency proposals as some businesses exit in the same year (i.e., year t) because they are bankrupt or insolvent. Sources: Statistics Canada, National Accounts Longitudinal Microdata File; Office of the Superintendent of Bankruptcy; and authors' tabulations. |
||||
In summary, this transition-matrix analysis shows two central findings.
First, most businesses that exit in a given year do so via non-bankruptcy pathways. As expected, there is a nearly perfect correlation between bankruptcy and exit. However, most exits are not bankruptcies, which shows that when it comes to business exit and failure, bankruptcy may only be the tip of the iceberg.
Second, the transition matrix analysis also shows that financially distressed businesses can often avoid exit and bankruptcy with an insolvency proposal, which is designed to help ensure the business’s continuity. Many of the proposals that turn into exits can be explained through a change of corporate identity (e.g., an asset purchase or purchase of going-concern sale), which preserves the business as a going concern but under new ownership.
Since this study is intended to compare the characteristics associated with bankruptcies and exits, the remainder of this paper excludes insolvency proposals.
The increase in the exit rate in 2020 was entirely attributable to small businesses, while most bankruptcies involved larger businesses
The preceding analysis distinguished business exit from bankruptcy pathways. But what factors determine which path a business will choose? The next sections present preliminary evidence on the relationship between firm characteristics, exits and bankruptcies.
Exit rates generally decrease with firm size, while bankruptcy rates tend to increase with firm size. Exit rates are notably higher among the smallest businesses (Table 2). For instance, from 2004 to 2009, 10.7% of corporations with 1 to 9 employees exited compared with 3.6% of businesses with 10 to 49 employees. The largest businesses had the lowest exit rates, averaging 2.5% over the 2004-to-2009 period.
In contrast with high exit rates among small businesses, bankruptcy rates among small businesses are notably low. From 2004 to 2009, businesses with 50 to 99 employees had a bankruptcy rate (0.46%) that was 20 times higher than the rate for the smallest businesses (0.02%).
These trends have been mostly stable over time as both exit rates and bankruptcy rates were lower from 2010 to 2019 compared with the previous decade, and this is widespread across firm size classes. However, there are important differences across size classes in 2020 as the exit rate of the smallest firms increased substantially. This effect is substantial enough to account for nearly all the increased exit rate in 2020, implying that the rise in the aggregate exit rate observed in Chart 1 was solely attributable to businesses with nine or fewer employees. This is not surprising as this size class accounts for the majority of businesses (i.e., slightly over 80% of continuing businesses in 2020). This stands in contrast to bankruptcy rates, which only increased in 2020 for medium-sized and large businesses with 100 or more employees, reaching 0.35%.
| Firm size | Exit rates | Bankruptcy rates | ||||
|---|---|---|---|---|---|---|
| 2004 to 2009 | 2010 to 2019 | 2020 | 2004 to 2009 | 2010 to 2019 | 2020 | |
| percent | ||||||
| 1 to 9 employees | 10.7 | 10.4 | 12.1 | 0.02 | 0.02 | 0.01 |
| 10 to 49 employees | 3.6 | 3.0 | 2.9 | 0.38 | 0.33 | 0.22 |
| 50 to 99 employees | 2.8 | 2.0 | 1.8 | 0.46 | 0.30 | 0.25 |
| 100 or more employees | 2.5 | 1.7 | 1.5 | 0.40 | 0.29 | 0.35 |
| Sources: Statistics Canada, National Accounts Longitudinal Microdata File; Office of the Superintendent of Bankruptcy; and authors' tabulations. | ||||||
The results for exits provide additional evidence that small businesses, in particular the smallest ones, were disproportionately affected by the pandemic relative to those from larger size classes. It is worth noting that these data do not indicate the channels through which more exits took place, but it is plausible that voluntary and involuntary factors contributed to a higher rate over the pandemic. In terms of involuntary causes, financial stresses induced by the pandemic may have led to more business failures. The pandemic also brought about changes in the labour force, early retirement by business owners, changes in preferences of people for work and a tight labour market that could have led to more voluntary exits (Belitski et al., 2022). Notably, businesses with 10 to 99 employees had the highest CEWS take-up rates in 2020 (Liu et al., 2021),Note helping these businesses withstand the impacts of the pandemic and remain in operation.
Despite posting some of the lowest exit rates, manufacturing corporations have high bankruptcy rates
Table 3 shows exit and bankruptcy rates across industries based on the two-digit North American Industry Classification System. In most industries, more than 8% of corporations exited on an annual basis over the 2004-to-2020 period. Manufacturing and agriculture, forestry, fishing and hunting stand out as exceptions, with exit rates below 8% over time, and as low as 6.3% and 5.7% from 2010 to 2019, respectively. By contrast, the highest exit rates over the pre-pandemic period are observed in finance and insurance, and management of companies and enterprises (12.1% in the 2010s), and information and cultural industries (12.1% in the 2000s).
Even though manufacturing records some of the lowest proportions of business exits, it is one of the sectors with the highest proportion of bankruptcies. From 2004 to 2009, on average, 0.64% of corporations in this industry were bankrupt. This is followed by accommodation and food services, which has had a bankruptcy rate over 0.40% since 2004. By contrast, very few businesses in real estate and rental and leasing and in professional, scientific and technical services were bankrupt. Moreover, while businesses in finance and insurance and in management of companies and enterprises had among the highest exit rates, less than 0.10% were bankrupt. This result is consistent with the concept that business characteristics shape whether failing businesses use insolvency or other informal exit paths. For example, bankruptcy may be a more viable option for manufacturing businesses if they possess marketable assets to preserve for creditors and higher debt levels associated with accessing both secured and unsecured financing for capital formation. Businesses with assets to preserve and potentially active creditors are less likely to exit without a formal process to settle debts and liquidate assets.
In most industries, the pandemic brought on higher exit rates than in the previous decades. In 9 of the 16 industries, the exit rate in 2020 represented the highest rate over the 16-year period. The differences are especially large in transportation and warehousing (12.8% in 2020 versus 9.7% in the 2004-to-2009 period), and mining, quarrying, and oil and gas extraction (13.2% versus 10.5%). In some industries, such as agriculture, forestry, fishing and hunting (5.5%) and utilities (7.2%), exit rates reached a 16-year low in 2020.
Except for arts, entertainment and recreation, declines in bankruptcy rates in 2020 from the previous decade were widespread across industries. In fact, in contrast with exit rates, bankruptcy rates reached 16-year lows in 13 out of the 14 industries included. The decline is especially striking in manufacturing, which had a bankruptcy rate of 0.28% in 2020 compared with 0.64% averaged over 2004 to 2009.
| Industry | Exit rates | Bankruptcy rates | ||||
|---|---|---|---|---|---|---|
| 2004 to 2009 | 2010 to 2019 | 2020 | 2004 to 2009 | 2010 to 2019 | 2020 | |
| percent | ||||||
| Agriculture, forestry, fishing and hunting | 7.3 | 5.7 | 5.5 | 0.16 | 0.08 | 0.03 |
| Mining, quarrying, and oil and gas extraction | 10.5 | 12.0 | 13.2 | Note x: suppressed to meet the confidentiality requirements of the Statistics Act | Note x: suppressed to meet the confidentiality requirements of the Statistics Act | Note x: suppressed to meet the confidentiality requirements of the Statistics Act |
| Utilities | 9.2 | 7.9 | 7.2 | Note x: suppressed to meet the confidentiality requirements of the Statistics Act | Note x: suppressed to meet the confidentiality requirements of the Statistics Act | Note x: suppressed to meet the confidentiality requirements of the Statistics Act |
| Construction | 8.0 | 8.7 | 10.2 | 0.20 | 0.23 | 0.13 |
| Manufacturing | 7.1 | 6.3 | 6.6 | 0.64 | 0.45 | 0.28 |
| Wholesale trade | 8.0 | 7.1 | 7.9 | 0.33 | 0.26 | 0.20 |
| Retail trade | 8.6 | 7.8 | 8.9 | 0.31 | 0.27 | 0.21 |
| Transportation and warehousing | 9.7 | 8.6 | 12.8 | 0.29 | 0.15 | 0.09 |
| Information and cultural industries | 12.1 | 11.7 | 12.0 | 0.22 | 0.18 | 0.07 |
| Real estate and rental and leasing | 10.5 | 10.7 | 12.0 | 0.11 | 0.09 | 0.07 |
| Professional, scientific and technical services | 11.0 | 11.0 | 12.3 | 0.11 | 0.09 | 0.07 |
| Administrative and support, waste management and remediation services | 8.8 | 8.5 | 10.2 | 0.20 | 0.20 | 0.18 |
| Finance and insurance, and management of companies and enterprises | 11.4 | 12.1 | 12.0 | 0.08 | 0.08 | 0.08 |
| Arts, entertainment and recreation | 9.0 | 8.3 | 10.6 | 0.21 | 0.20 | 0.25 |
| Accommodation and food services | 10.9 | 9.3 | 10.3 | 0.46 | 0.48 | 0.42 |
| Other services (except public administration) | 7.1 | 6.8 | 8.3 | 0.15 | 0.13 | 0.08 |
|
x suppressed to meet the confidentiality requirements of the Statistics Act Sources: Statistics Canada, National Accounts Longitudinal Microdata File; Office of the Superintendent of Bankruptcy; and authors' tabulations. |
||||||
Quebec has a lower business exit rate and a higher bankruptcy rate than the Canadian average
The variation in exit rates at the regional level is slightly less pronounced than at the industry level (Table 4). Over the pre-pandemic period, exit rates ranged from a low of 7.1% in Manitoba to a high of 10.5% in Alberta. Average exit rates were consistently higher from 2004 to 2009 compared with 2010 to 2019 across all provinces and territories, except for Saskatchewan. The Northwest Territories posted the largest decline in its exit rate from the 2004-to-2009 period to the 2010-to-2019 period, to 7.4%, which is below the provincial average over the 2010-to-2019 period.
From the 2010-to-2019 period to 2020, exit rates increased in all the provinces and territories, except New Brunswick. The largest increases of exit rates occurred in Prince Edward Island (+4.2 percentage points), followed by Alberta (+3.0 percentage points). Similar to the overall exit rate presented in Chart 1, in the majority of provinces and territories, the exit rate in 2020 peaked over the 2004-to-2020 period.
Over the pre-pandemic period, the bankruptcy rates varied from a high of 0.68% in Quebec to a low of 0.05% in British Columbia and Alberta. In 2020, bankruptcy rates declined across all provinces, falling by more than half in New Brunswick to 0.07%, reaching historical lows over the observed period.
Among the provinces and territories, Quebec is an outlier on both bankruptcy and exit measures, with relatively low exit rates and relatively high bankruptcy rates. While more data and information would be required to determine the cause of interprovincial variation, the Quebec example raises questions about the relationship between bankruptcy and exit. For example, are Quebec businesses that fail more likely to do so via bankruptcy than via other informal exit channels? If so, is the preference for bankruptcy over exit attributable to different business characteristics whereby the province is perhaps overrepresented in the types of businesses that use bankruptcy over informal exit? Or is that preference attributable to other factors, such as a preference by regulators or tax authorities to advise failing businesses to use formal bankruptcy processes?
| Province or territory | Exit rates | Bankruptcy rates | ||||
|---|---|---|---|---|---|---|
| 2004 to 2009 | 2010 to 2019 | 2020 | 2004 to 2009 | 2010 to 2019 | 2020 | |
| percent | ||||||
| Newfoundland and Labrador | 8.8 | 8.0 | 8.7 | Note x: suppressed to meet the confidentiality requirements of the Statistics Act | Note x: suppressed to meet the confidentiality requirements of the Statistics Act | Note x: suppressed to meet the confidentiality requirements of the Statistics Act |
| Prince Edward Island | 7.5 | 7.4 | 11.6 | Note x: suppressed to meet the confidentiality requirements of the Statistics Act | Note x: suppressed to meet the confidentiality requirements of the Statistics Act | Note x: suppressed to meet the confidentiality requirements of the Statistics Act |
| Nova Scotia | 7.6 | 7.2 | 7.4 | 0.13 | 0.12 | 0.07 |
| New Brunswick | 8.1 | 7.7 | 7.5 | 0.17 | 0.16 | 0.07 |
| Quebec | 8.2 | 7.7 | 8.1 | 0.65 | 0.68 | 0.50 |
| Ontario | 9.1 | 8.6 | 10.6 | 0.20 | 0.11 | 0.09 |
| Manitoba | 7.2 | 7.1 | 8.1 | Note x: suppressed to meet the confidentiality requirements of the Statistics Act | Note x: suppressed to meet the confidentiality requirements of the Statistics Act | Note x: suppressed to meet the confidentiality requirements of the Statistics Act |
| Saskatchewan | 8.3 | 8.7 | 10.3 | Note x: suppressed to meet the confidentiality requirements of the Statistics Act | Note x: suppressed to meet the confidentiality requirements of the Statistics Act | Note x: suppressed to meet the confidentiality requirements of the Statistics Act |
| Alberta | 10.5 | 10.4 | 13.5 | 0.06 | 0.05 | 0.05 |
| British Columbia | 9.4 | 9.2 | 9.6 | 0.07 | 0.05 | 0.04 |
| Northwest Territories | 9.4 | 7.4 | 7.9 | Note x: suppressed to meet the confidentiality requirements of the Statistics Act | Note x: suppressed to meet the confidentiality requirements of the Statistics Act | Note x: suppressed to meet the confidentiality requirements of the Statistics Act |
| Yukon | 7.8 | 7.5 | 10.0 | Note x: suppressed to meet the confidentiality requirements of the Statistics Act | Note x: suppressed to meet the confidentiality requirements of the Statistics Act | Note x: suppressed to meet the confidentiality requirements of the Statistics Act |
| Nunavut | 8.8 | 8.0 | 10.3 | Note x: suppressed to meet the confidentiality requirements of the Statistics Act | Note x: suppressed to meet the confidentiality requirements of the Statistics Act | Note x: suppressed to meet the confidentiality requirements of the Statistics Act |
|
x suppressed to meet the confidentiality requirements of the Statistics Act Sources: Statistics Canada, National Accounts Longitudinal Microdata File; Office of the Superintendent of Bankruptcy; and authors’ tabulations. |
||||||
There are contrasts between corporate exits and bankruptcies in terms of their distributions of financial ratios over time
How do the financial and economic characteristics of insolvent, exiting and continuing businesses differ? This section presents distributions for four financial ratios: labour productivity, profitability, leverage and liquidity. Labour productivity and profitability were selected because they are well-established indicators of firm performance, and high scores on these ratios are expected to predict continuity, while low scores are expected to predict exit or insolvency. Leverage and liquidity ratios were selected as established predictors of firm insolvency risk. An analysis of how continuing, exiting and insolvent firms differ in terms of their financial characteristics will contribute to further understanding of their dynamics and underlying marketplace trends. For each financial ratio, low, medium and high tertiles are calculated in the year preceding the date on which the sample was taken (e.g., year t-1 across all businesses, and the distributions across the three dynamics groups are taken in year t). Not surprisingly, as continuing businesses make up the majority of businesses, they are quite evenly distributed across tertiles, regardless of the period. They are illustrated to provide a main baseline comparison group.
Labour productivity
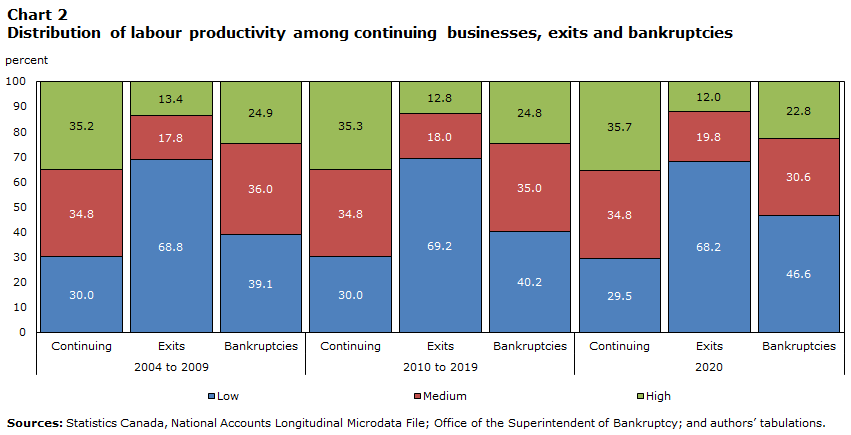
In terms of labour productivity, calculated as value added per employee, there are some important differences in the distribution of business exits and bankruptcies across tertiles. The majority of exits are among low labour productivity businesses (Chart 2). On average from 2004 to 2009, 68.8% of exits were in the low labour productivity category in the year before exiting. This share changed little over time, including in 2020.
Bankruptcies of firms are less likely to be in the low labour productivity category than exits (about 40% compared with about 68% for exits). While this trend was stable from 2004 to 2019, 2020 saw an elevated share of low productivity bankruptcies, with 46.6% of bankruptcies belonging in this category, indicating that bankruptcy fell more among medium and high labour productivity firms.
Profitability
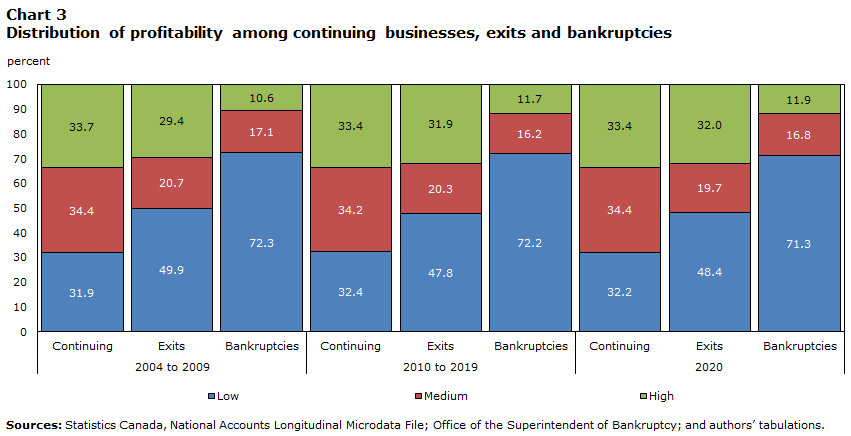
The measure of profitability, or return on assets, is computed by dividing net non-farm income by total assets. A significant proportion of bankruptcies, approximately 72%, occur among companies demonstrating low profitability, a statistic that aligns with general expectations (as shown in Chart 3). Of note, fewer than half of business exits are categorized under low profitability. This discrepancy could be indicative of the distinct circumstances surrounding voluntary and involuntary business exits.
Over the years, the shares of both bankruptcies and exits within the low profitability group have experienced a slight decline. In 2020, low profitability businesses accounted for 48.4% of exits and 71.3% of bankruptcies, marking approximately a 1-percentage-point decrease compared with the average from 2004 to 2009. Of note, a substantial fraction of business exits, close to one-third, originate from the high profitability tertile. A plausible explanation for this phenomenon could be the presence of businesses with a smaller asset base compared with their net income, thereby skewing the profitability ratio upwards.
Data table for Chart 2
| Low | Medium | High | |
|---|---|---|---|
| percent | |||
| 2004 to 2009 | |||
| Continuing | 30.03 | 34.81 | 35.17 |
| Exits | 68.76 | 17.81 | 13.44 |
| Bankruptcies | 39.12 | 36.00 | 24.88 |
| 2010 to 2019 | |||
| Continuing | 29.99 | 34.76 | 35.25 |
| Exits | 69.19 | 17.99 | 12.83 |
| Bankruptcies | 40.19 | 35.02 | 24.79 |
| 2020 | |||
| Continuing | 29.50 | 34.79 | 35.71 |
| Exits | 68.20 | 19.81 | 11.99 |
| Bankruptcies | 46.63 | 30.59 | 22.78 |
| Sources: Statistics Canada, National Accounts Longitudinal Microdata File; Office of the Superintendent of Bankruptcy; and authors’ tabulations. | |||
Data table for Chart 3
| Low | Medium | High | |
|---|---|---|---|
| percent | |||
| 2004 to 2009 | |||
| Continuing | 31.90 | 34.44 | 33.66 |
| Exits | 49.91 | 20.67 | 29.43 |
| Bankruptcies | 72.34 | 17.06 | 10.60 |
| 2010 to 2019 | |||
| Continuing | 32.39 | 34.18 | 33.42 |
| Exits | 47.85 | 20.25 | 31.90 |
| Bankruptcies | 72.18 | 16.15 | 11.67 |
| 2020 | |||
| Continuing | 32.21 | 34.36 | 33.42 |
| Exits | 48.35 | 19.67 | 31.97 |
| Bankruptcies | 71.27 | 16.83 | 11.90 |
| Sources: Statistics Canada, National Accounts Longitudinal Microdata File; Office of the Superintendent of Bankruptcy; and authors’ tabulations. | |||
Leverage
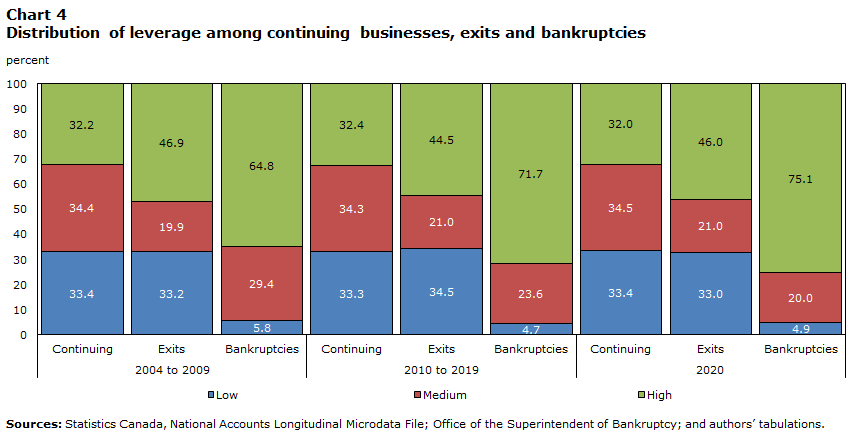
Distributions also differ by leverage (or total debt to total assets) and liquidity (or current assets to current debt) in the year prior to exiting or bankruptcy. Both leverage and liquidity are linked to definitions of insolvency, one of which is having more liabilities than assets and the other being the inability of a business to make payments as they become due. For instance, low leverage may be related to the ability to obtain financing while high leverage may be a sign of the inability to pay back loans or be a product of low assets.
From 2004 to 2009, nearly half of business exits were highly leveraged compared with close to two-thirds of bankruptcies (Chart 4). In 2020, the share of business exits in the highly leveraged group remained the same, while it increased to three-quarters for bankruptcies. One-third of exits are in the low leverage tertile. Differences in leverage rates among exits and bankruptcies are not surprising given that the objective of bankruptcy as a process is to settle creditor claims. This process is suited to businesses that are leveraged. Businesses that are not leveraged may still be solvent or may not have sufficient creditor interest to support an insolvency proceeding.
Liquidity
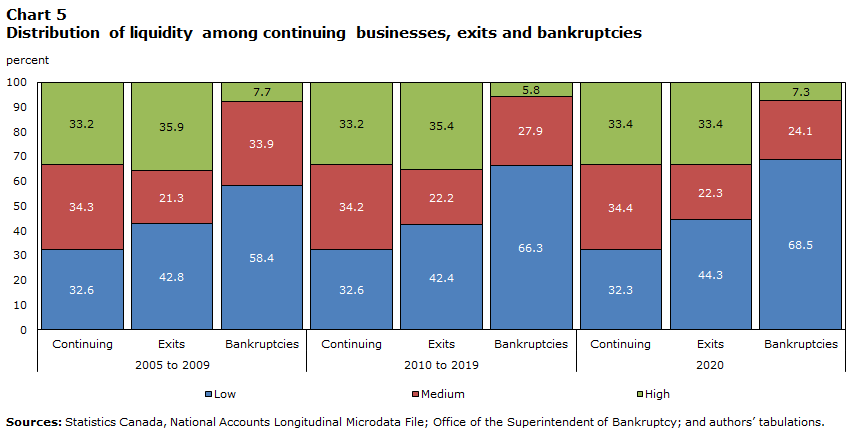
There are similarities between exits and bankruptcies in terms of liquidity, in that the highest shares for both dynamics groups are observed in the low liquidity tertile (Chart 5). However, a larger share is observed for bankruptcies. Liquidity crises are often cited as a precipitating factor in business bankruptcies, insofar as the decision for a bankruptcy may be caused by the business’s inability to make payments and therefore to default on its loan obligations. This is confirmed in the data; from 2004 to 2009, on average, 42.8% of business exits were in the low liquidity tertile compared with 58.4% of bankruptcies. Moreover, while the share of exits in this group increased slightly by 1.5 percentage points in 2020, the share for bankruptcies increased by 10.1 percentage points. Few bankruptcies are in the high liquidity tertile, while about one-third of exits are in this group.
Data table for Chart 4
| Low | Medium | High | |
|---|---|---|---|
| percent | |||
| 2004 to 2009 | |||
| Continuing | 33.39 | 34.38 | 32.23 |
| Exits | 33.18 | 19.94 | 46.88 |
| Bankruptcies | 5.79 | 29.43 | 64.78 |
| 2010 to 2019 | |||
| Continuing | 33.28 | 34.34 | 32.38 |
| Exits | 34.53 | 20.96 | 44.51 |
| Bankruptcies | 4.70 | 23.59 | 71.71 |
| 2020 | |||
| Continuing | 33.43 | 34.53 | 32.04 |
| Exits | 32.97 | 20.99 | 46.04 |
| Bankruptcies | 4.92 | 20.00 | 75.08 |
| Sources: Statistics Canada, National Accounts Longitudinal Microdata File; Office of the Superintendent of Bankruptcy; and authors’ tabulations. | |||
Data table for Chart 5
| Low | Medium | High | |
|---|---|---|---|
| percent | |||
| 2005 to 2009 | |||
| Continuing | 32.56 | 34.26 | 33.18 |
| Exits | 42.83 | 21.28 | 35.89 |
| Bankruptcies | 58.39 | 33.92 | 7.69 |
| 2010 to 2019 | |||
| Continuing | 32.56 | 34.23 | 33.21 |
| Exits | 42.37 | 22.24 | 35.39 |
| Bankruptcies | 66.29 | 27.94 | 5.77 |
| 2020 | |||
| Continuing | 32.26 | 34.37 | 33.38 |
| Exits | 44.32 | 22.26 | 33.42 |
| Bankruptcies | 68.53 | 24.12 | 7.35 |
| Sources: Statistics Canada, National Accounts Longitudinal Microdata File; Office of the Superintendent of Bankruptcy; and authors’ tabulations. | |||
For exits, distributions tended to remain relatively constant over time for all financial ratios, while they often changed for bankruptcies. In 2020, there was generally an increase in the share of bankruptcies belonging to the more vulnerable category (i.e., low labour productivity and high leverage). In other words, the profile of exits did not significantly change over time or as a result of the pandemic, but the same cannot be said for firms that declared bankruptcy.
Conclusion
This paper presents trends in exits, insolvency proposals and bankruptcies across various dimensions over the 2004-to-2020 period. Using a newly linked dataset, it fills an important knowledge gap on this topic by providing a recent picture of corporations exiting or filing for insolvency and the transitions that occur across these dimensions.
A key finding of this study is that the characteristics of businesses that exit differ from those of businesses that become bankrupt in important ways. In particular,
- small firms are more likely to exit than larger firms, while bankruptcy exhibits the opposite tendency, with lower bankruptcy rates observed among small firms and higher rates observed among large firms
- there are contrasting differences across industries, with businesses in manufacturing having some of the lowest exit rates but relatively high bankruptcy rates
- little regional variation is found in exit rates, with the exception of Quebec, which stands out for having low exit rates but the highest bankruptcy rates.
Businesses that exit and businesses that become bankrupt also differ in their financial characteristics. In general,
- bankrupt businesses tend to have low levels of labour productivity, low levels of profitability, high levels of leverage and low levels of liquidity
- trends are similar but far less pronounced for businesses that exit; this is likely indicative of exits occurring for reasons other than business failure or financial distress.
The transition matrix analysis conducted in this paper also finds that insolvency proposals can help firms avoid exit and bankruptcy.
The 2020 results provide preliminary evidence of the impact of the pandemic on business failure. Even though business insolvency levels declined to near-historic lows, exit rates increased substantially, indicating that simply examining insolvency rates among businesses may not tell the whole story. In addition, this spike was mostly a result of small businesses that exited, consistent with other findings that the pandemic had a disproportionate impact on small businesses.
While the paper does not present a model of insolvency prediction, it shows that insolvency rates are correlated with a set of financial ratios, including labour productivity, profitability, leverage and liquidity. Future work will look further into these trends and could consider whether these data could be used for more insolvency forecasting. It will also examine further analysis using 2021 and 2022 data to potentially determine the factors that led to the recent increase in insolvencies.
Finally, this paper’s findings suggest avenues for future research using the linked dataset.
- To the extent that the pandemic resulted in more involuntary business exits, why did the businesses that failed because of financial distress not opt for formal insolvency proceedings?
- What regulatory or macroeconomic factors shape trends in exit, insolvency and continuity?
- Why do some firms with low labour productivity, low profitability and high levels of indebtedness end up continuing?
References
Baldwin, J., T. Gray, J. Johnson, J. Proctor, M. Rafiquzzaman, and D. Sabourin. 1997. Failing Concerns: Business Bankruptcy in Canada. Statistics Canada Catalogue no. 61-525-XIE. Ottawa: Statistics Canada.
Belitski, M., C. Guenther, A.S. Kritikos, and R. Thurik. 2022. “Economic effects of the COVID-19 pandemic on entrepreneurship and small businesses.” Small Business Economics (2022): 1-17.
Cefis, E., C. Bettinelli, A. Coad, and O. Marsili. 2022 . “Understanding firm exit: a systematic literature review.” Small Business Economics 59.2 (2022): 423-446.
Fortier-Labonté, A. 2021. The Impact of the Pandemic on the Solvency of Corporations: Third Quarter 2020. StatCan COVID-19: Data to Insights for a Better Canada. Statistics Canada Catalogue no. 45280001. Ottawa: Statistics Canada.
Gu, W. 2020. Economic Impact of the COVID-19 Pandemic on Canadian Businesses across Firm Size Classes. Economic Insights, no. 119. Statistics Canada Catalogue no. 11-626-X.
Johnston, C., S. Sood, and S. Tam. 2021. Impact of COVID-19 on small businesses in Canada, third quarter of 2021. The Daily, March 5, 2021. Statistics Canada Catalogue no. 45-28-0001.
Lecavalier, C. 2006. National and regional trends in business bankruptcies, 1980-2005. Canadian Economic Observer. Statistics Canada Catalogue no. 11-010-XIB. Ottawa: Statistics Canada.
Liu, H., Y. Lu, and M. Willox. 2021. Use of the Canada Emergency Wage Subsidy program by employer businesses in 2020. Economic and Social Reports, vol. 1, no. 6. Statistics Canada Catalogue no. 36-28-0001.
Macdonald, R. 2014. Business Entry and Exit Rates in Canada: A 30-year Perspective. Economic Insights, no. 038. Statistics Canada Catalogue no. 11-626-X.
Statistics Canada. 2023. Table 33-10-0164-01 Business Dynamics Measures, by Industry.
Wennberg, K., and D. R. DeTienne. “What do we really mean when we talk about ‘exit’? A critical review of research on entrepreneurial exit.” International Small Business Journal 32.1 (2014): 4-16.
- Date modified: