
Economic and Social Reports
Use of government business liquidity support by child care businesses in Canada during the COVID-19 pandemic
DOI: https://doi.org/10.25318/36280001202301000002-eng
Abstract
Because of the nature of child care services, the COVID-19 pandemic, as a specific health and economic shock, has affected the child care industry differently than others. To alleviate the impacts of the pandemic on businesses, the government of Canada launched various liquidity support programs. These programs were designed to help affected businesses by partially covering their main expenses, such as wages, rents and property expenses. The paper examines the use of four emergency government support programs—the Canada Emergency Wage Subsidy (CEWS), the Canada Emergency Commercial Rent Assistance (CECRA), the Canada Emergency Rent Subsidy (CERS) and the Canada Emergency Business Account (CEBA)—by the child care businesses that qualified for them. The study first estimates the businesses’ likelihood of receiving COVID-19 support. It then examines the total dollar value of the support they received. After controlling for business characteristics and the bias introduced by sample selection and selection into the support programs, the study finds that for-profit child care businesses were more likely to receive the CEBA, the CECRA or the CERS, and the CEWS than those that are non-profit. However, non-profit businesses received higher dollar values of support than those that are for-profit. Moreover, the results show that regardless of the program, child care businesses in Ontario and Alberta were most likely to be program recipients and received the highest dollar support values compared with child care businesses in other provinces and territories. In comparison with the rest of the economy, the study finds that child care businesses were more likely to be CEBA and CECRA or CERS recipients and less likely to be CEWS recipients. Finally, the study finds that on average child care businesses received higher dollar values of support, about 10% more, than the rest of the economy. Note that the analyses in this study rely only on a sample of child care businesses with active Business Numbers that were eligible for the support programs. Those businesses accounted for 16% of all child care businesses in 2019 but generated more than 72% of the total revenue in the industry. Hence, the inferences and conclusion may not necessarily be generalizable to the entire child care industry.
Keywords: Child care, for-profit, non-profit, emergency government support programs, COVID-19
Authors
Hassan Faryaar and Huju Liu are with the Economic Analysis Division, Analytical Studies and Modelling Branch, Statistics Canada.
Acknowledgement
The authors would like to thank Leanne Findlay, Danny Leung, Ryan Macdonald and Jenny Watt from Statistics Canada and Jamil Sayeed and other reviewers from Employment and Social Development Canada (ESDC) for their helpful and constructive comments. The authors would also like to acknowledge funding and support from the Federal Secretariat on Early Learning and Child Care at ESDC.
Introduction
Although the child care industry represents a small portion of total gross domestic product (GDP), it has an essential role in the economy. In addition to its various positive spillovers, the industry tends to provide more opportunities for women to participate in the labour force, as mothers bear a greater portion of child care at home (Moyser & Burlock, 2018; Archer, Duhamel, Macdonald, Watt, & Yam, 2021; Zamarro & Pardos, 2021). The COVID-19 pandemic and its consequences have brought more attention to the child care industry. With the new working environment during the pandemic, the definitions of home and work have changed. On the one hand, working parents face the challenges of balancing home and work responsibilities during the pandemic (Findlay & Arim, 2020). On the other hand, as some economists highlight, a stable child care industry is necessary for post-pandemic recovery and life (Bezanson, Bezanson, & Lysack, 2020; Standford, 2020).
The COVID-19 pandemic, as a health and economic shock, has affected some businesses, such as child care, more than others. The nature of child care services is different from other businesses, even from typical educational and training institutions. For example, unlike other institutions that can switch to online services, such as schools and universities, child care businesses require in-person services because of the need for direct supervision. Therefore, the pandemic likely affected the demand and supply of the child care industry. On the one hand, the demand for child care services may have declined because of families’ health concerns. According to findings from the 2020 Survey on Early Learning and Child Care Arrangements (SELCCA), 28% of families who were not using child care thought that using it was unsafe during the pandemic (Statistics Canada, 2021). On the other hand, the supply of child care services likely decreased because the cost of operation may have increased as a result of additional health and safety practices or a reduction in capacity. For instance, according to a national survey conducted by the Canadian Child Care Federation, 93% of child care centres mentioned COVID-19 health and safety costs as one of their main concerns for reopening (Friendly, Forer, Vickerson, & Mohamed, 2020).
Child care businesses likely perform differently across provinces and territories partly because the child care industry is regulated and administered at the provincial and territorial level. Moreover, the participation rate of children in child care is also different across provinces and territories. For example, SELCCA findings show that in 2020, about 75% of children younger than 6 years living in Quebec were in child care, similar to the 78% observed in 2019. By comparison, children living in Alberta were much less likely to be in child care in late 2020 (41%) than in 2019 (54%). For Ontario, the rates of children in child care were 44% in 2020 and 54% in 2019 (Statistics Canada, 2021). Child care businesses were also affected differently by the pandemic across provinces and territories. For instance, during the first stage of the pandemic, on average, 38% of child care centres reported that their financial situation was “much worse” than it was in the pre-pandemic period, with the highest rate among provinces and territories for centres in Alberta (63%) and the lowest rate for centres in Prince Edward Island (8%). Moreover, while, on average, 71% of child care centres had laid off at least one staff member, the rate was highest in Alberta (95%) and lowest in Nova Scotia (9%) (Friendly, Forer, Vickerson, & Mohamed, 2020).
The literature also highlighted that the pandemic hit for-profit child care businesses harder than non-profit ones. For instance, Macdonald and Friendly (2021) find that, during the pandemic, for-profit child care businesses faced a greater decline in enrolment because of higher child care fees and the higher unemployment rate of parents, particularly mothers. The authors also demonstrate that the fee gap between for-profit and non-profit child care businesses varies across provinces and territories. For example, the authors find that Calgary, Edmonton and Lethbridge (all in Alberta) were among the top five cities with the highest for-profit fees relative to their non-profit fees.
To support the affected businesses during the pandemic, the government of Canada launched various liquidity support programs. These programs were designed to help affected businesses by partially covering their main expenses, such as wages, rents and property expenses. This study examines the use of four COVID-19 support programs among child care businesses: the Canada Emergency Wage Subsidy (CEWS), the Canada Emergency Commercial Rent Assistance (CECRA), the Canada Emergency Rent Subsidy (CERS) and the Canada Emergency Business Account (CEBA). Specifically, the paper studies the relationship between the likelihood of a child care business receiving support and its characteristics, such as organization type (for-profit versus non-profit), province or territory, size, financial situation, and type of ownership. Moreover, it also investigates whether these characteristics impact the value of the support a child care business received. Finally, the study compares the results for child care businesses with those for the rest of the economy.
For the analysis, the study uses data on child care service providers, business microdata based on tax data from the Canada Revenue Agency (CRA), and microdata on the COVID-19 support programs. Businesses active in 2019 and 2020 are selected for the analysis so the relationship between their pre-pandemic characteristics and the use of the liquidity support programs can be studied. In the analysis, there are two possible selection biases. The first is introduced by the selection of only active businesses; the second is by the selection of support recipients when the total amount of the support is estimated. That is, the total amount of support is estimated only for those businesses that received the liquidity support. Both selection biases are addressed using a Heckman correction model.
After controlling for selection biases and business characteristics, the study finds that for-profit child care businesses were more likely to receive CEBA, CECRA or CERS, and CEWS liquidity support than those that are non-profit. However, the latter received higher dollar values of support than for-profit businesses. This can be because non-profit child care businesses are larger than for-profit ones, on average. Moreover, the results show that regardless of the support program, child care businesses in Ontario and Alberta were most likely to be program recipients and received the highest dollar values of support, compared with child care businesses in the other provinces and territories. In comparison with the rest of the economy, the study finds that child care businesses were more likely to receive the CEBA and the CECRA or the CERS and less likely to receive the CEWS. Finally, the study finds that child care businesses received, on average, more dollar values of support, about 10% more, than recipients in the rest of the economy.
One limitation of this study is that only child care businesses with a valid Business Number (BN), which accounted for 16% of all child care businesses in the Business Register (BR) but more than 72% of the total revenue in the child care industry in 2019, are used in the analysis. Businesses without a BN were ineligible for COVID-19 support programs. Note that a significant number of child care service providers are self-employed individuals who provide home child care and may not have a BN. If affected by the pandemic, the owners of these businesses could have applied for support through individual programs such as the Canada Emergency Response Benefit (CERB). Therefore, this study may underestimate the total amount of federal government support received by the entire child care industry.
The rest of this paper is organized as follows. Section 2 provides an overview of the government support programs. Section 3 describes the data and sample used in the analysis and presents some summary statistics related to the use of the support programs by child care businesses. Section 4 describes the econometric methodology used to control for potential sample selection issues and estimate the relationship between the use of support programs by child care businesses and their characteristics. Section 5 discusses the estimation results, and finally, Section 6 concludes the paper.
An overview of the government liquidity support programs
To alleviate the impacts of the COVID-19 pandemic on businesses, the Government of Canada launched various liquidity support programs. The CEWS program started on March 15, 2020, and continued until October 23, 2021. This subsidy program covered 21 four-week periods and was mainly designed to support employers by enabling them to rehire workers, prevent further job losses and facilitate their business operations during the pandemic. Any employer in Canada who experienced a decrease in revenue during the pandemic was eligible for this subsidy to cover part of their wage expenses. Depending on the size of a business’s revenue loss, the subsidy amount could be up to 75% of employee wages, to a maximum of $847 per week per employee during the first four periods.Note
In parallel with the CEWS, the Government of Canada also initiated the CECRA, which mainly targeted small businesses. This program, which started in March 2020 and continued until September 2020, provided forgivable loans to qualifying commercial property owners to cover 50% of rent payments if they reduced the rent by 75%. In other words, under this program, if property owners agreed, tenants paid only 25% of the rent while the government provided the property owners with a forgivable loan equal to 50% of the rent. The CECRA targeted small businesses paying less than $50,000 per month in gross rent that either had their revenues reduced by at least 70% or had been forced to close because of the pandemic.
The CERS program replaced the CECRA on September 27, 2020, and continued until October 23, 2021. Like the CECRA, the CERS provided rent and other relief to businesses, non-profits and charities that experienced revenue loss during the COVID-19 pandemic. However, in contrast to the CECRA, the CERS provided support directly to qualifying tenants and property owners. More importantly, businesses were eligible for the CERS if they experienced any revenue loss. The condition of having at least a 70% loss in revenue, which was applied for the CECRA, was removed for the CERS. Expenses eligible under the CERS included commercial rent, property taxes (including school and municipal taxes), property insurance and interest on commercial mortgages. However, the value of the CERS was calculated as a percentage of revenue loss. Eligible expenses for any given location were up to $75,000 per period, with maximum eligible expenses of $300,000 for all affiliated entities per period. In other words, the maximum amount for any given corporation was $300,000.Note
The CEBA program offered a one-time interest-free loan of up to $60,000 to small businesses and non-profits. Repaying the balance of the loan on or before December 31, 2023, will result in loan forgiveness up to 33% (up to $20,000).
The CEBA application process followed one of two streams:
- the payroll stream (for applicants with employment income between $20,000 and $1,500,000 paid in the 2019 calendar year)
- the non-deferrable expense stream (for applicants with $20,000 or less in total employment income with eligible non-deferrable expenses, such as rent, property taxes, utilities and insurance, between $40,000 and $1,500,000).Note
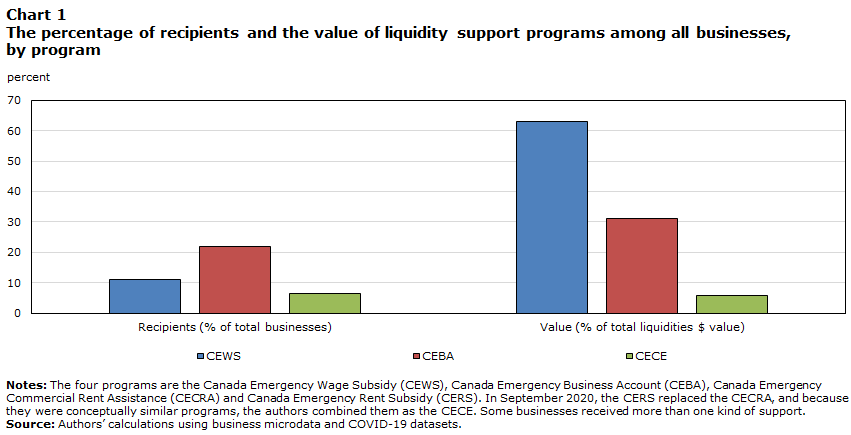
For simplicity, this study combines the CECRA and the CERS (hereafter the CECE) because they are conceptually similar. Chart 1Note illustrates the distribution of liquidity support programs across all businesses and shows the total value of liquidity support distributed by the CEBA (31%), the CECE (6%) and the CEWS (63%). However, of the number of businesses with active BNs in 2019 (i.e., around 3,950,000), 22% received the CEBA, 7% received the CECE and 11% received the CEWS.
Data table for Chart 1
| Recipients (% of total businesses) | Value (% of total liquidities $ value) | |
|---|---|---|
| percent | ||
| CEWS | 11.2 | 62.9 |
| CEBA | 21.8 | 31.2 |
| CECE | 6.6 | 5.9 |
|
Notes: The four programs are the Canada Emergency Wage Subsidy (CEWS), Canada Emergency Business Account (CEBA), Canada Emergency Commercial Rent Assistance (CECRA) and Canada Emergency Rent Subsidy (CERS). In September 2020, the CERS replaced the CECRA, and because they were conceptually similar programs, the authors combined them as the CECE. Some businesses received more than one kind of support. Source: Authors’ calculations using business microdata and COVID-19 datasets. |
||
Data and descriptive results
Data sources
This project uses three data sources: data on child care service providers, business microdata based on CRA tax data, and microdata on the COVID-19 support programs. To create the analysis sample, the BR was used to identify child care businesses based on the child care industry under the North American Industry Classification System (NAICS) code 624410.Note Child care businesses were then linked to 2019 business microdata to obtain their pre-pandemic characteristics, such as their size, financial situation, owner demographics, and province or territory of operation. Finally, the COVID-19 business support program data were linked to the data obtained in the previous step to include information on government support received during the pandemic.
Data considerations and restrictions
The business microdata contain all incorporated and unincorporated businesses with a valid BNNote in 2019 and 2020. To be eligible for the COVID-19 support programs, a business needed to have a valid BN. Hence, this paper focuses on those child care businesses with a valid BN so they can be linked to their pre-COVID-19 characteristics and the COVID-19 support programs.
In total, 14,544 active child care businesses had a valid BN in 2019, accounting for about 16% of all identified child care businesses (with and without BNs). However, child care businesses with a valid BN are relatively larger. For example, they accounted for more than 72% of the total revenue of the child care industry in 2019.Note The vast majority of those businesses, about 12,716, were active in 2020. Among these businesses, 6,573 received at least one type of business liquidity support during the pandemic.
One caveat to using only child care businesses with a valid BN is that only support received at the business level is captured; this may underestimate the total amount of federal government support received by the entire child care industry. Because a significant number of small child care service providers are self-employed individuals who provide home child care, they may not necessarily have a BN. If they had been affected by the pandemic, the owners of these businesses would have applied for support through individual programs such as the CERB. Identifying these self-employed child care providers and their use of other support programs such as the CERB is left for future research.
The other consideration is that the analysis sample includes only the businesses, child care and other businesses, that were active in 2019 and 2020. This is because only active businesses could apply for the liquidity support programs, and pre-pandemic business characteristics are needed for the analysis. Some businesses entered or exited the market or became inactive in 2020 and are thus excluded from the analysis sample. This selection may bias the results if business survival is different between child care businesses and other businesses. In the subsequent analysis, a Heckman selection model (Heckman [1979]) is adopted to control for this potential selection bias, which will be discussed with more details in the methodology section.
Descriptive results
Tables 1 to 5 show the descriptive results for the child care businesses included in the analysis sample. Table 1 displays the overall use of liquidity support programs by child care businesses. Overall, 6,573 child care businesses received at least one type of support, accounting for 52% of the 12,716 businesses. In total, they received more than $1.75 billion in liquidity support. Of the child care businesses in the sample, 38% received the CEWS, 39% received the CEBA and 22% received the CECE.Note
| Liquidity support program |
Number of recipients | Percentage of recipients | Value of support ($ million) |
|---|---|---|---|
| CEWS | 4,879 | 38.3 | 1,360 |
| CEBA | 5,016 | 39.4 | 280 |
| CECE | 2,771 | 21.7 | 110 |
| At least one of the four programs | 6,573 | 51.6 | 1,750 |
|
Notes: The four programs are the Canada Emergency Wage Subsidy (CEWS), Canada Emergency Business Account (CEBA), Canada Emergency Commercial Rent Assistance (CECRA) and Canada Emergency Rent Subsidy (CERS). In September 2020, the CERS replaced the CECRA, and because they were conceptually similar programs, the authors combined them as the CECE. Some businesses received more than one kind of support. Source: Authors’ calculations using COVID-19 datasets. |
|||
Tables 2 and 3 display the use of government support programs among child care businesses in the sample by business size and by province or territory. The shares of CEWS and CECE recipients (i.e., the number of recipients divided by total businesses) generally increased with business size, except for small decreases for businesses with 20 to 49 employees. However, for the CEBA, the share of recipients increased with business size up to businesses with 10 to 19 employees, after which it decreased. This decrease reflects the ineligibility of larger businesses for the CEBA, as discussed in Section 2.
The shares of child care businesses that received the CEWS or the CECE were highest among those with 50 employees or more, 74% for those receiving the CEWS and 43% for those receiving the CECE (see Table 2). The share of businesses receiving the CEWS was lowest for child care businesses with fewer than five employees (28%), while the share of businesses receiving the CEBA and the CECE was lowest among those with no employees. Overall, within each business size category, the share of recipients was lowest for the CECE, except for the largest size class, where the share of recipients was the lowest for the CEBA. Very few child care businesses without employees received any support. One possible reason for this could be that rather than applying for business liquidity support, they used non-business support such as the CERB. Among those businesses that received support, the average dollar value of support increased with business size, reflecting larger expenses for larger businesses.Note
| Business size(number of employees) | Percentage of recipients among total child care businesses | Average value of support per recipient ($) | ||||
|---|---|---|---|---|---|---|
| CEWS (%) | CEBA (%) | CECE (%) | CEWS ($) | CEBA ($) | CECE ($) | |
| 0 | Note ...: not applicable | 4.9 | 3.8 | Note ...: not applicable | 56,985 | 30,562 |
| 1 to 4 | 27.9 | 35.5 | 13.7 | 34,201 | 55,569 | 15,662 |
| 5 to 9 | 67.8 | 70.6 | 37.1 | 68,296 | 55,847 | 23,528 |
| 10 to 19 | 67.9 | 72.2 | 39.4 | 142,711 | 56,125 | 34,708 |
| 20 to 49 | 65.2 | 61.2 | 34.4 | 312,430 | 55,464 | 52,147 |
| 50 or more | 74.0 | 8.8 | 42.9 | 2,385,900 | 51,176 | 141,262 |
|
... not applicable Notes: The four programs are the Canada Emergency Wage Subsidy (CEWS), Canada Emergency Business Account (CEBA), Canada Emergency Commercial Rent Assistance (CECRA) and Canada Emergency Rent Subsidy (CERS). In September 2020, the CERS replaced the CECRA, and because they were conceptually similar programs, the authors combined them as the CECE. Some businesses received more than one kind of support. Source: Authors’ calculations using business microdata and COVID-19 datasets. |
||||||
Table 3 shows the proportion of support recipients and the average value of support per recipient in each province and territory. Regardless of the program, the proportions of recipient businesses were highest in Alberta, where 51%, 55% and 41% of businesses received the CEWS, the CEBA and the CECE, respectively. In comparison, Quebec had the lowest proportion of child care businesses receiving the CEWS (21%), and the region of Manitoba, Saskatchewan and the territories had the lowest proportion of those receiving the CEBA (19%) and the CECE (8%).Note
The last three columns of Table 3 illustrate the average dollar value of support per recipient business across provinces and territories. While the average value of support for the CEBA is similar across provinces, it is significantly different for the two other programs. Businesses in Ontario and Alberta received the highest average values of CEWS and CECE support. On average, CEWS and CECE recipients in Ontario received $325,592 and $56,219, respectively, and recipients in Alberta received $195,554 and $52,988, respectively. Note that the dollar value of support reported here is the total value of support received by a business. Therefore, the support value can vary by the size of a business, how hard COVID-19 affected the business and the length of time for which a business received support.
| Province or territory | Percentage of recipients among child care businesses | Average value of support per recipient business ($) | ||||
|---|---|---|---|---|---|---|
| CEWS (%) | CEBA (%) | CECE (%) | CEWS ($) | CEBA($) | CECE($) | |
| Atlantic Canada | 37.3 | 44.4 | 11.1 | 138,889 | 54,156 | 14,259 |
| Quebec | 21.2 | 34.2 | 16.1 | 77,402 | 56,883 | 24,070 |
| Ontario | 48.9 | 43.0 | 32.2 | 325,592 | 55,426 | 56,219 |
| Alberta | 50.9 | 54.5 | 41.4 | 195,554 | 56,694 | 52,988 |
| British Columbia | 25.4 | 40.4 | 12.9 | 89,244 | 55,682 | 27,586 |
| Man., Sask. and the territories | 29.8 | 19.2 | 8.2 | 93,084 | 55,238 | 11,049 |
|
Notes: The four programs are the Canada Emergency Wage Subsidy (CEWS), Canada Emergency Business Account (CEBA), Canada Emergency Commercial Rent Assistance (CECRA) and Canada Emergency Rent Subsidy (CERS). In September 2020, the CERS replaced the CECRA, and because they were conceptually similar programs, the authors combined them as the CECE. Some businesses received more than one kind of support. Source: Authors’ calculations using COVID-19 datasets. |
||||||
Table 4 illustrates the differences in the use of liquidity support programs between for-profit and non-profit child care businesses. In the sample, 10,146 child care businesses were for-profit, accounting for almost 80% of total child care businesses (Table 4). However, the second row of Table 4 shows that around 96% of non-profit businesses were employers, compared with 62% of those that are for-profit. Moreover, the number of employees in non-profit child care businesses was much larger than that of their for-profit counterparts (Table 5). At the mean, the number of employees for non-profit child care businesses was 33.4, compared with 11.8 for those that are for-profit. The numbers were also much higher at various percentiles of the distribution.
In terms of receiving COVID-19 support, the share of CEWS recipients among for-profit child care businesses with employees was lower than that among those that are non-profit, 53% versus 65%. Also, for-profit child care businesses received a smaller dollar value of the CEWS (less than one-third) than those that are non-profit (Table 4). However, regarding the CEBA and the CECE, a higher percentage of for-profit child care businesses received those supports. Specifically, 42% and 23% of for-profit businesses received the CEBA and the CECE, respectively, compared with 31% and 19% of non-profit businesses, respectively. For-profit child care businesses also received a higher dollar value of support from the CEBA and the CECE.
| For-profit child care business | Non-profit child care business | |
|---|---|---|
| Total number of businesses | 10,146 | 2,565 |
| Number of employer businesses | 6,187 | 2,474 |
| Number of CEWS recipients | 3,261 | 1,614 |
| CEWS recipients (% of employers) | 52.7 | 65.2 |
| Average value of the CEWS per recipient ($) | 151,074 | 535,616 |
| Number of CEBA recipients | 4,229 | 786 |
| CEBA recipients (% of total businesses) | 41.7 | 30.6 |
| Average value of the CEBA per recipient ($) | 56,207 | 53,791 |
| Number of CECE recipients | 2,297 | 474 |
| CECE recipients (% of total businesses) | 22.6 | 18.4 |
| Average value of the CECE per recipient ($) | 40,512 | 35,823 |
|
Notes: The four programs are the Canada Emergency Wage Subsidy (CEWS), Canada Emergency Business Account (CEBA), Canada Emergency Commercial Rent Assistance (CECRA) and Canada Emergency Rent Subsidy (CERS). In September 2020, the CERS replaced the CECRA, and because they were conceptually similar programs, the authors combined them as the CECE. Some businesses received more than one kind of support. The third row of the table shows the fraction of child care businesses with payroll employees. The fraction provided may overestimate the total population because businesses without a Business Number, the majority of which may not have payroll employees, are excluded from this paper. Source: Authors’ calculations using business microdata and COVID-19 datasets. |
||
| Organization type | Number of employer business | Mean | 25 percentile | 50 percentile | 75 percentile |
|---|---|---|---|---|---|
| For-profit | 6,187 | 11.8 | 2.2 | 8.2 | 16 |
| Non-profit | 2,474 | 33.4 | 9.6 | 18.5 | 31.4 |
|
Notes: The mean is the average number of employees. P25 is the 25th percentile of the employment distribution across employer child care businesses by organization type, P50 is the 50th percentile and P75 is the 75th percentile. The total of for-profit and non-profit businesses may not be equal to the total employer child care businesses because the organization type is missing for a few businesses. Source: Authors’ calculations using business microdata. |
|||||
A recent American study finds that restaurants owned by Black people were less likely to receive Paycheck Protection Program loans than those owned by White people, even after controlling for business characteristics and location (Chernenko and Scharfstein, 2022). The above finding suggests a possible relationship between ownership characteristics and COVID-19 support programs. Therefore, this study also controls for the ownership types of child care businesses, i.e., immigrant status of business owners. Child care businesses are classified into three categories depending on the ownership share of immigrants in a business: majority-owned by Canadian-born individuals (Canadian-born owners have more than 50% of the ownership share), majority-owned by immigrants (immigrant owners have more than 50% of the ownership share), and equally -owned businesses (Canadian-born individuals and immigrants owning equally 50% of a business share).
The descriptive results in Table 6 show some differences in the use of government support programs between businesses majority-owned by immigrants and those majority-owned by Canadian-born individuals. Child care businesses majority-owned by immigrants were slightly more likely to receive the CEWS than businesses majority-owned by Canadian-born individuals (51% versus 47%). However, on average, businesses majority-owned by immigrants received lower dollar values in the form of the CEWS than those majority-owned by Canadian-born individuals ($110,499 versus $150,622). These differences mostly reflect the higher proportion of employers among the former; however, the former employed fewer people on average and were also more likely to receive the CEBA and the CECE than the latter.
| Majority-owned by Canadian-born individuals | Majority-owned by immigrants | |
|---|---|---|
| Total number of businesses | 4,123 | 2,314 |
| Number of employer businesses | 2,533 | 1,552 |
| Number of CEWS recipients | 1,190 | 788 |
| CEWS recipients (% of employers) | 47.0 | 50.8 |
| Average value of the CEWS per recipient ($) | 150,622 | 110,499 |
| Number of CEBA recipients | 1,534 | 1,095 |
| CEBA recipients (% of total businesses) | 37.2 | 47.3 |
| Average value of the CEBA per recipient ($) | 55,437 | 57,461 |
| Number of CECE recipients | 726 | 653 |
| CECE recipients (% of total businesses) | 17.6 | 28.2 |
| Average value of the CECE per recipient ($) | 40,010 | 40,055 |
|
Notes: The four programs are the Canada Emergency Wage Subsidy (CEWS), Canada Emergency Business Account (CEBA), Canada Emergency Commercial Rent Assistance (CECRA) and Canada Emergency Rent Subsidy (CERS). In September 2020, the CERS replaced the CECRA, and because they were conceptually similar programs, the authors combined them as the CECE. Some businesses received more than one kind of support. Majority means owning at least 51% of a business share. The total number of businesses across different ownership types may not be equal to the total businesses in the study. This is because the ownership type cannot be determined for some of them as a result of missing ownership data or because an organization rather than individuals own a business. Source: Authors’ calculations using business microdata and COVID-19 datasets. |
||
Methodology
As seen from the previous section, child care businesses differ in their characteristics and in the support they received. This paper conducts a multivariate regression analysis to determine whether any of the differences in receiving liquidity support between child care businesses are still significant once business characteristics are considered. To specifically study the use of the COVID-19 support programs by businesses in the child care industry, the following regression model is applied for each liquidity support program:
(1)
In equation (1), the subscript i indicates child care business i. The dependent binary variable program_recipienti represents the use of a single specific support program by child care business i during the pandemic. For each support program, the dependent binary variable is 1 if business i received the liquidity program for at least one period,Note and 0 if otherwise. Therefore, a business is called a program recipient if it received a liquidity support for at least one period during the pandemic. The use of each support program is studied separately. The variables of interest are non_profiti and province, where the former determines whether a child care business is for-profit and the latter is a vector of categorical variable that represents the location of a child care business. The error term of the model is
.
X' is a vector of control variables,![]() including business size, business ownership type and the financial characteristics of businesses. Business size is determined based on the number of employees and is classified in six categories (see Table 2). Ownership type is the immigrant status of business owners as defined in the data section. Financial characteristics of businesses consist of the current ratio and the fixed-cost ratio. The current ratio is obtained by dividing current assets over current liability (current debt, accrued expenses, etc.) and is usually used to measure a business’s liquidity. A lower current ratio can be an indicator of a higher risk of distress or default, especially during a recession. The second variable is the ratio of fixed costs (i.e., rent, mortgage payments, utility costs, etc.) over the total cost of a business. A higher fixed-cost ratio can be related to a greater need of liquidity support such as the CECE.
including business size, business ownership type and the financial characteristics of businesses. Business size is determined based on the number of employees and is classified in six categories (see Table 2). Ownership type is the immigrant status of business owners as defined in the data section. Financial characteristics of businesses consist of the current ratio and the fixed-cost ratio. The current ratio is obtained by dividing current assets over current liability (current debt, accrued expenses, etc.) and is usually used to measure a business’s liquidity. A lower current ratio can be an indicator of a higher risk of distress or default, especially during a recession. The second variable is the ratio of fixed costs (i.e., rent, mortgage payments, utility costs, etc.) over the total cost of a business. A higher fixed-cost ratio can be related to a greater need of liquidity support such as the CECE.
As described in the data section, this paper’s analysis sample includes only businesses that were active in 2019 and 2020. This sample selection may bias the results if business survival is different between child care businesses and other businesses. Therefore, a Heckman selection model is adopted to control for this potential selection bias.Note First, the probability of businesses in 2019 being active in 2020 is estimated using a probit model and their characteristics in 2019, from which an inverse Mills ratio (IMR) is calculated for each business. Then this ratio, denoted as Z, is included in equation (1) to control for selection bias. To properly derive the IMR, an additional variable needs to be included in the regression of the first step, which is supposed to relate to a business being active but not to the program used by the business. For this purpose, the survival rate is used for all businesses from 2019 to 2020 within a census metropolitan area and an industry to which businesses belonged. The probabilities of receiving a liquidity support are estimated using probit models.
While equation (1) determines whether the likelihood of being the recipient of a liquidity support is different across business characteristics, it does not provide any information on the value of the support received. For example, under the CECRA and the CEWS programs, a business can be a recipient whether they reported a revenue loss of 10% or 100% or whether they received the subsidy for one period or for multiple periods. Therefore, the relationship between the variables of interest and the value of the liquidity support a business received is examined in equation (2):
(2)
In equation (2), the subscript i indicates program recipient i. The continuous variable all_program_valuei represents the log of the total value of the CEBA, the CECE and the CEWS combined for recipient i. The error term of the model is . The rest of the variables are the same as in equation (1), except for the new variable Vi, which is another IMR used to address the selection of program recipients, because the analysis on the value of the liquidity support received is carried out only for support recipients. This selection arises from a bad shock that caused a severe revenue loss for a business, making it more eligible for liquidity support and possibly increasing the amount of the support it received. To compute Vi, a first-step probit regression like the one in equation (1) was run, where the dependent variable became the probability of receiving either the CEBA, the CECE or the CEWS, as illustrated in equation (3):
(3)
The Ki is an exclusion variable for business i, constructed as the aggregate revenue growth of all businesses from 2019 to 2020 within each province or territory and industry (three-digit NAICS code), excluding the business itself, which is likely related to the probability of business i receiving support but not to the value of the support received by business i.
Equations (1) and (2) explain the use of liquidity support programs by child care businesses. They do not provide any comparison between child care businesses and the rest of the economy. Therefore, the study conducts another two regressions to compare the use of liquidity support programs between child care businesses and the rest of the economy. Specifically, the study investigates whether the probability of businesses in the child care industry receiving a liquidity support and the value of the liquidity support they received are significantly different from those of businesses in the rest of the economy:
(4)
(5)
Equations (4) and (5) have a similar setting as equations (1) and (2), except for an additional variable, childcarei, which is a discrete variable that has a value of 1 if the business is in the child care industry, and 0 if otherwise.Note The coefficient on this variable thus captures the difference in the use of liquidity support programs between child care businesses and the rest of the economy.
Regression results
This section presents regression results on the use of liquidity support by child care businesses after controlling for their business characteristics based on equations (1) to (5).
Results for the child care industry
The probability of receiving liquidity program support
Table 7 shows the results of the probit model described in equation (1), specifically the likelihood of being a support recipient among child care businesses. A business is a program recipient if it receives liquidity support for at least one period. Columns 2, 4 and 6 demonstrate the marginal effects of receiving support. The marginal effects measure, in percentages, the probability of being a recipient relative to the base variable. For example, the first row of results in Table 7 indicates that non-profit child care businesses were 30.6 percentage points, 20.4 percentage points and 16.2 percentage points less likely to be CEBA, CECE and CEWS recipients, respectively, than those that are for-profit. In other words, the marginal effects for the non-profit child care businesses indicate that regardless of liquidity support programs, they were less likely to receive liquidity support than those that are for-profit. This finding is consistent with the literature that argues that for-profit child care businesses have faced greater declines in enrolment because of higher child care fees and the higher unemployment rates of parents (Macdonald & Friendly, 2021).
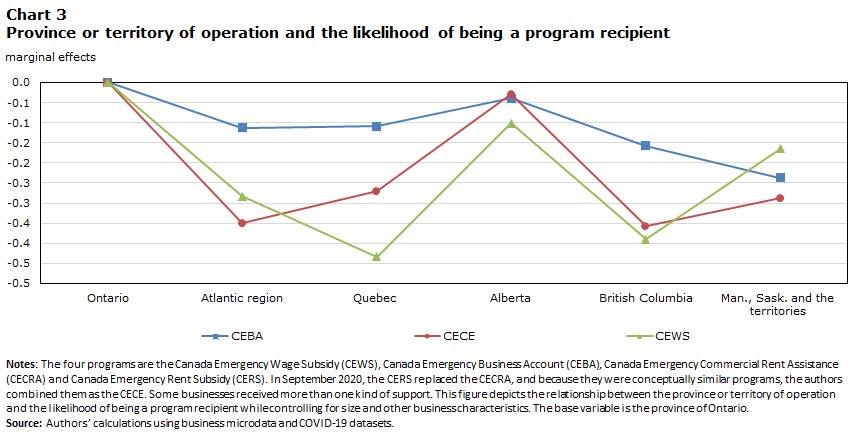
Across provinces and territories, regardless of the support programs, child care businesses in Ontario were most likely to be program recipients compared with those in other provinces and territories (Chart 3). Child care businesses in Alberta had on average the second-highest likelihood of being recipients of every support program.Note
Concerning the business owner type, child care businesses majority-owned by immigrants were more likely to be program recipients than those majority-owned by Canadian-born individuals. This finding is also in line with the literature highlighting that immigrant-owned businesses were hit harder by the pandemic than the ones owned by Canadian-born individuals (Beland et al., 2021, ; Tam, Sood, & Johnston, 2021). However, the results for child care businesses that were equally owned by immigrants and Canadian-born individuals do not significantly differ from those of child care businesses majority-owned by Canadian-born individuals.
Regarding businesses’ financial characteristics, the higher the fixed-cost ratio, the more likely a business was to receive support, regardless of the program. Moreover, the fixed-cost ratio also has the largest impact on the likelihood of receiving CECE support. Therefore, one can conclude that one of the main reasons businesses applied for liquidity support was to cover their fixed costs, such as rent, utility expenses, property taxes and mortgage payments. However, this paper does not find any significant relationship between the current ratio and the likelihood of receiving support.
Regarding the CEBA program, the child care businesses in the regionNote of Manitoba, Saskatchewan and the territories had the smallest probability of being CEBA recipients. In terms of size, the likelihood of receiving the CEBA increased with the business size up to 19 employees then decreased. This decrease can be explained by the fact that the CEBA was designed to support only small businesses.
For the CECE programs, child care businesses in British Columbia and the Atlantic region were the least likely to be program recipients. In terms of size, the likelihood of receiving the CECE generally increased with size. This is because larger businesses generally have higher fixed costs.
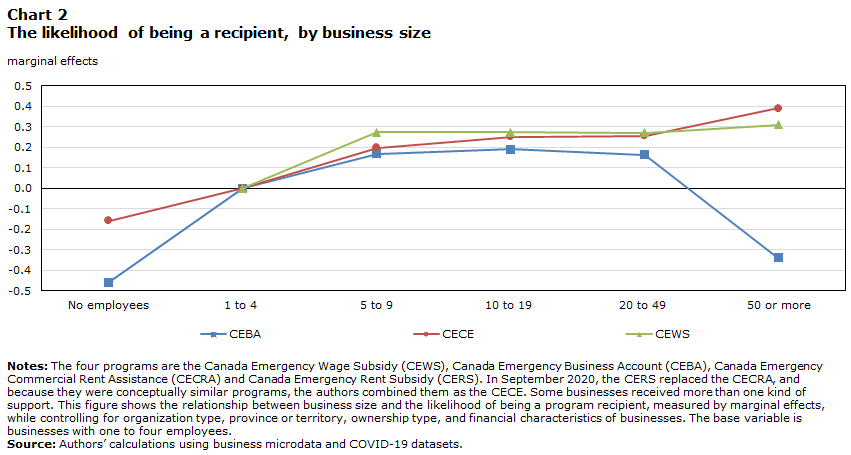
Concerning the CEWS, businesses in Quebec had the least probability of receiving support. Also, the regression results show a monotonic increasing relationship between business size and the probability of receiving the CEWS. However, the differences across the three size categories smaller than the “50 employees or more” category were small, as shown in Chart 2.
Lastly, the coefficients of the IMR are positive across all three support programs, although not significant (Table 7). The IMRs were used to control for potential selection bias where only active businesses in 2019 and 2020 were used for the analysis. The coefficients show a positive selection bias. That is, unobserved factors that caused businesses to stay active were positively correlated with their probability of receiving support.
| Probit regressions | CEBA | CECE | CEWS | |||
|---|---|---|---|---|---|---|
| Marginal effect | P-value | Marginal effect | P-value | Marginal effect | P-value | |
| Non-profit (base: for-profit) | -0.306 | 0.000 | -0.204 | 0.000 | -0.162 | 0.000 |
| Province or territory (base: Ontario) | ||||||
| Atlantic region | -0.099 | 0.000 | -0.343 | 0.000 | -0.270 | 0.000 |
| Quebec | -0.098 | 0.000 | -0.266 | 0.000 | -0.432 | 0.000 |
| Alberta | -0.026 | 0.143 | -0.022 | 0.309 | -0.099 | 0.000 |
| British Columbia | -0.157 | 0.000 | -0.347 | 0.000 | -0.388 | 0.000 |
| Man., Sask. and the territories | -0.224 | 0.000 | -0.271 | 0.000 | -0.172 | 0.000 |
| Business size (base: 1 to 4 employees) | ||||||
| No employees | -0.454 | 0.000 | -0.147 | 0.000 | Note ...: not applicable | Note ...: not applicable |
| 5 to 9 employees | 0.178 | 0.000 | 0.209 | 0.000 | 0.288 | 0.000 |
| 10 to 19 employees | 0.200 | 0.000 | 0.262 | 0.000 | 0.292 | 0.000 |
| 20 to 49 employees | 0.175 | 0.000 | 0.264 | 0.000 | 0.294 | 0.000 |
| 50 employees or more | -0.298 | 0.000 | 0.399 | 0.000 | 0.330 | 0.000 |
| Ownership (base: majority-owed by Canadian-born individuals) | ||||||
| Majority-owned by immigrants | 0.089 | 0.000 | 0.081 | 0.000 | 0.034 | 0.041 |
| Equally owned | 0.034 | 0.360 | 0.060 | 0.129 | 0.056 | 0.177 |
| Financial characteristics | ||||||
| Current ratio | 0.000 | 0.375 | 0.000 | 0.580 | 0.000 | 0.330 |
| Fixed-cost ratio | 0.355 | 0.000 | 1.423 | 0.000 | 0.542 | 0.000 |
| Inverse Mills ratio | 0.270 | 0.569 | 0.305 | 0.612 | 0.420 | 0.482 |
| Number of observations | 4,927 | Note ...: not applicable | 4,927 | Note ...: not applicable | 4,918 | Note ...: not applicable |
| Pseudo R-squared | 0.293 | Note ...: not applicable | 0.259 | Note ...: not applicable | 0.224 | Note ...: not applicable |
|
... not applicable Notes: The four programs are the Canada Emergency Wage Subsidy (CEWS), Canada Emergency Business Account (CEBA), Canada Emergency Commercial Rent Assistance (CECRA) and Canada Emergency Rent Subsidy (CERS). In September 2020, the CERS replaced the CECRA, and because they were conceptually similar programs, the authors combined them as the CECE. Some businesses received more than one kind of support. Source: Authors’ calculations using business microdata and COVID-19 datasets. |
||||||
Data table for Chart 2
| CEBA | CECE | CEWS | |
|---|---|---|---|
| No employees | -0.5 | -0.2 | Note ...: not applicable |
| 1 to 4 | 0.0 | 0.0 | 0.0 |
| 5 to 9 | 0.2 | 0.2 | 0.3 |
| 10 to 19 | 0.2 | 0.2 | 0.3 |
| 20 to 49 | 0.2 | 0.3 | 0.3 |
| 50 or more | -0.3 | 0.4 | 0.3 |
|
... not applicable Notes: The four programs are the Canada Emergency Wage Subsidy (CEWS), Canada Emergency Business Account (CEBA), Canada Emergency Commercial Rent Assistance (CECRA) and Canada Emergency Rent Subsidy (CERS). In September 2020, the CERS replaced the CECRA, and because they were conceptually similar programs, the authors combined them as the CECE. Some businesses received more than one kind of support. This figure shows the relationship between business size and the likelihood of being a program recipient, measured by marginal effects, while controlling for organization type, province or territory, ownership type, and financial characteristics of businesses. The base variable is businesses with one to four employees. Source: Authors’ calculations using business microdata and COVID-19 datasets. |
|||
Data table for Chart 3
| CEBA | CECE | CEWS | |
|---|---|---|---|
| Ontario | 0.0 | 0.0 | 0.0 |
| Atlantic region | -0.1 | -0.4 | -0.3 |
| Quebec | -0.1 | -0.3 | -0.4 |
| Alberta | 0.0 | 0.0 | -0.1 |
| British Columbia | -0.2 | -0.4 | -0.4 |
| Man., Sask. and the territories | -0.2 | -0.3 | -0.2 |
|
Notes: The four programs are the Canada Emergency Wage Subsidy (CEWS), Canada Emergency Business Account (CEBA), Canada Emergency Commercial Rent Assistance (CECRA) and Canada Emergency Rent Subsidy (CERS). In September 2020, the CERS replaced the CECRA, and because they were conceptually similar programs, the authors combined them as the CECE. Some businesses received more than one kind of support. This figure depicts the relationship between the province or territory of operation and the likelihood of being a program recipient while controlling for size and other business characteristics. The base variable is the province of Ontario. Source: Authors’ calculations using business microdata and COVID-19 datasets. |
|||
The value of liquidity support received by child care businesses
Table 8 (columns 2 and 3) displays the result of equation (2) and explains the relationship between the characteristics of child care businesses and the total dollar value of the liquidity support they received. In this table, the liquidity value refers to the total combined dollar values of the CEBA, the CECE and the CEWS that a business received throughout the study period.
The results show a positive relationship between non-profit child care businesses and the dollar value of the liquidity they received. Table 7 shows that non-profit child care businesses were less likely to be recipients. However, as shown in Table 8, non-profit recipients tended to receive greater dollar values than for-profit recipients. The dependent variables, i.e., the total values of subsidies, are in log forms. So, the coefficients in Table 8 indicate that, on average, non-profit child care recipients received 14.5% more support than those that are for-profit.Note The result is also significant at a 5% significance level. This finding may be related to the fact that non-profit child care businesses were larger than those that are for-profit (see Table 5). Therefore, the larger the business, the more expenses it would incur; hence, larger child care businesses received higher support values to cover their expenses.
Among provinces and territories, child care business recipients in Ontario received the highest value, on average, followed by businesses in Alberta. By contrast, liquidity recipients in the region of Manitoba, Saskatchewan and the territories received the lowest amount. Regarding the size, the value of liquidity support received increased with business size, as expected. Similar to the analysis of the likelihood of receiving support in the previous section, child care businesses majority-owned by immigrants received higher values than those majority-owned by Canadian-born individuals. Also, the results show a positive relationship between a recipient’s fixed-cost ratio and the dollar values they received. Finally, the higher the current ratio of a child care business, the lower the dollar value of the support it received. As previously mentioned, a higher current ratio indicates a business’s higher cash on hand and hence a lower risk of distress or default during the pandemic.
The coefficient of the IMR indicates that selection into programs was positive, although not significant. In other words, unobserved factors that caused child care businesses to receive support were positively correlated with the amount of support they received.
| Ordinary least squares regressions | Child care industry | Child care industry versus the rest of the economy | ||
|---|---|---|---|---|
| Coefficient | P-value | Coefficient | P-value | |
| Non-profit child care | 0.135 | 0.000 | Note ...: not applicable | Note ...: not applicable |
| Child care industry | Note ...: not applicable | Note ...: not applicable | 0.099 | 0.000 |
| Province or territory (base category: Ontario) | ||||
| Atlantic region | -0.760 | 0.000 | -0.143 | 0.000 |
| Quebec | -0.984 | 0.000 | -0.062 | 0.000 |
| Alberta | -0.255 | 0.000 | 0.029 | 0.000 |
| British Columbia | -0.830 | 0.000 | -0.076 | 0.000 |
| Man., Sask. and the territories | -1.131 | 0.000 | -0.088 | 0.000 |
| Business size (base category: 1 to 4 employees) | ||||
| No employees | -0.122 | 0.819 | -0.023 | 0.305 |
| 5 to 9 employees | 0.633 | 0.000 | 0.353 | 0.000 |
| 10 to 19 employees | 0.947 | 0.000 | 0.742 | 0.000 |
| 20 to 49 employees | 1.232 | 0.000 | 1.265 | 0.000 |
| 50 employees or more | 2.389 | 0.000 | 2.468 | 0.000 |
| Ownership (base category: majority-owned by Canadian-born individuals) | ||||
| Majority-owned by immigrants | 0.123 | 0.017 | -0.019 | 0.000 |
| Equally owned | 0.018 | 0.821 | 0.076 | 0.000 |
| Industry control | Note ...: not applicable | Note ...: not applicable | YES | YES |
| Financial characteristics | ||||
| Profit margin | Note ...: not applicable | Note ...: not applicable | -0.009 | 0.000 |
| Current ratio | -0.003 | 0.024 | 0.000 | 0.000 |
| Fixed-cost ratio | 1.127 | 0.000 | -0.067 | 0.000 |
| Inverse Mills ratio | 0.020 | 0.966 | -0.260 | 0.000 |
| Constant | 11.288 | 0.000 | 11.322 | 0.000 |
| Number of observations | 4,696 | Note ...: not applicable | 774,002 | Note ...: not applicable |
| Adjusted R-squared | 0.664 | Note ...: not applicable | 0.710 | Note ...: not applicable |
|
... not applicable Notes: The four programs are the Canada Emergency Wage Subsidy (CEWS), Canada Emergency Business Account (CEBA), Canada Emergency Commercial Rent Assistance (CECRA) and Canada Emergency Rent Subsidy (CERS). In September 2020, the CERS replaced the CECRA, and because they were conceptually similar programs, the authors combined them as the CECE. Some businesses received more than one kind of support. Source: Authors’ calculations using business microdata and COVID-19 datasets. |
||||
Comparison between child care businesses and the rest of the economy
The probability of receiving liquidity program support
This section shows the results of equation (3), which compares the likelihood of receiving liquidity program support in the child care industry and in the rest of the economy. After controlling for size, ownership type and financial characteristics, the results indicate that child care businesses were more likely to be CEBA or CECE recipients than other businesses (Table 9). Conversely, businesses in the rest of the economy were more likely to receive the CEWS than child care businesses. Specifically, child care businesses were 1.7 percentage points more likely to receive the CEBA and 2.9 percentage points more likely to receive the CECE than those in the rest of the economy. However, they were 3.9 percentage points less likely to receive the CEWS. One possible explanation for this finding is that the CEWS was mainly designed to support larger employer businesses, and child care businesses are, on average, smaller businesses.
One interesting finding is that the current ratio, which measures the liquidity of a business, now has a negative relationship with the probability of being a recipient, while it is not significant among child care businesses. The lower the ratio, the lower the liquidity of a business and hence the higher the risk of distress or default during a negative revenue shock. The significant negative relationship may be driven by businesses in the rest of the economy. Overall, the results indicate that, on average, the higher a business’s liquidity, the lower the probability of being a recipient, regardless of the support program. However, Leung and Liu (2022) find a non-linear relationship between the current ratio and the use of the CEWS during the pandemic by classifying the current ratio into five categories.
The coefficient on the selection bias is also positive and significant. Compared with the positive but not significant selection bias found among child care businesses in the previous section, this coefficient suggests a stronger and positive selection bias for the rest of the economy.
| Probit regression | CEBA | CECE | CEWS | |||
|---|---|---|---|---|---|---|
| Marginal effect | P-value | Marginal effect | P-value | Marginal effect | P-value | |
| Child care industry (base: the rest of the economy) | 0.017 | 0.005 | 0.029 | 0.000 | -0.039 | 0.000 |
| Business size (base: 1 to 4 employees) | ||||||
| No employees | -0.487 | 0.000 | -0.088 | 0.000 | Note ...: not applicable | Note ...: not applicable |
| 5 to 9 employees | 0.213 | 0.000 | 0.151 | 0.000 | 0.314 | 0.000 |
| 10 to 19 employees | 0.200 | 0.000 | 0.193 | 0.000 | 0.389 | 0.000 |
| 20 to 49 employees | -0.041 | 0.000 | 0.213 | 0.000 | 0.435 | 0.000 |
| 50 employees or more | -0.480 | 0.000 | 0.199 | 0.000 | 0.415 | 0.000 |
| Province or territory (base: Ontario) | ||||||
| Atlantic region | -0.001 | 0.741 | -0.053 | 0.000 | 0.022 | 0.000 |
| Quebec | 0.031 | 0.000 | -0.004 | 0.000 | 0.044 | 0.000 |
| Alberta | -0.023 | 0.000 | -0.015 | 0.000 | -0.002 | 0.021 |
| British Columbia | -0.042 | 0.000 | -0.033 | 0.000 | -0.007 | 0.000 |
| Man., Sask. and the territories | -0.024 | 0.000 | -0.035 | 0.000 | -0.031 | 0.000 |
| Ownership (base: majority-owned by Canadian-born individuals) | ||||||
| Majority-owned by immigrants | 0.070 | 0.000 | 0.041 | 0.000 | -0.043 | 0.000 |
| Equally owned | 0.048 | 0.000 | 0.039 | 0.000 | 0.000 | 0.881 |
| Financial characteristics | ||||||
| Profit margin | 0.004 | 0.000 | -0.001 | 0.009 | 0.008 | 0.000 |
| Fixed-cost ratio | 0.088 | 0.000 | 0.273 | 0.000 | -0.001 | 0.000 |
| Current ratio | -0.001 | 0.000 | -0.001 | 0.000 | -0.152 | 0.000 |
| Inverse Mills ratio | 0.023 | 0.052 | 0.105 | 0.000 | 0.120 | 0.000 |
| Number of observations | 1,283,479 | Note ...: not applicable | 1,283,479 | Note ...: not applicable | 1,282,668 | Note ...: not applicable |
| Pseudo R-squared | 0.277 | Note ...: not applicable | 0.221 | Note ...: not applicable | 0.308 | Note ...: not applicable |
|
... not applicable Notes: The four programs are the Canada Emergency Wage Subsidy (CEWS), Canada Emergency Business Account (CEBA), Canada Emergency Commercial Rent Assistance (CECRA) and Canada Emergency Rent Subsidy (CERS). In September 2020, the CERS replaced the CECRA, and because they were conceptually similar programs, the authors combined them as the CECE. Some businesses received more than one kind of support. Source: Authors’ calculations using business microdata and COVID-19 datasets. |
||||||
The value of the liquidity support received
On average, recipients in the child care industry received a higher dollar value, 10.4% more, than businesses in other industries after controlling for size, province and territory, owner type, industry, and financial characteristics (columns 4 and 5 in Table 8). Among all businesses, recipients in Alberta received the highest liquidity values. In contrast, recipients in the Atlantic region received the lowest amount of liquidity support. Also, recipient businesses majority-owned by immigrants received a smaller amount of liquidity support than recipients businesses majority-owned by Canadian-born individuals. Like in the child care industry, the dollar value of liquidity support increases with the size of the recipient business. Finally, regarding the financial characteristics, the results show that the higher the profit margin and fixed-cost ratio, the lower the amount of support received among all recipients in the economy, on average. This negative effect of the fixed-cost ratio, compared with the positive effect for child care businesses only (column 2 in Table 8), is likely driven by the dominance of businesses in the rest of the economy. As a business becomes larger, its proportion of fixed costs is likely to decline.
The coefficient on the selection bias into programs is negative and significant. Compared with the positive but not significant selection bias found among child care businesses only, as described in the previous section, this coefficient suggests a stronger and negative selection bias for the rest of the economy.
Conclusion
Although the child care industry represents a small portion of total GDP, it plays an essential role in the economy. Specifically, it allows parents to participate in the labour force. The COVID-19 pandemic, as a specific health and economic shock, undoubtedly had a large impact on the child care industry because of its nature of in-person care. To alleviate the impacts of the pandemic on businesses, the government of Canada launched various liquidity support programs. This study specifically examines the use of four liquidity support programs by businesses in the child care industry.
The results show that, compared with the rest of the economy, child care businesses were more likely to receive liquidity support such as the CEBA and the CECE but were less likely to receive the CEWS. One possible explanation is that the CEWS was mainly designed to support larger firms, and child care businesses are, on average, smaller businesses. Another possibility is that child care businesses experienced a larger decline in demand, so they could try to reduce their losses by temporarily closing and applying for support from the CEBA and the CECE. Moreover, child care businesses, on average, received higher amounts of total liquidity support than businesses in the rest of the economy after controlling for business characteristics and program selection. This result can indicate that, compared with a typical business in the rest of the economy, ceteris paribus, a typical child care business was more adversely impacted by the pandemic.
Among child care businesses, there were also variations in the use of the liquidity support programs. For-profit child care businesses were more likely than non-profit ones to receive the CEBA, the CECE and the CEWS. This result is consistent with other studies that find that for-profit child care businesses have faced greater declines in enrolment because of higher child care fees and the higher unemployment rate of parents, particularly mothers, during the pandemic (Macdonald & Friendly, 2021). However, of the recipients in the child care industry, non-profit businesses received a higher dollar value of support than those that are for-profit. This result could be related to the larger size and higher expenses of non-profit child care businesses than for-profit ones.
Moreover, the results show that, regardless of the liquidity programs, child care businesses in Ontario and Alberta were most likely to receive liquidity support. They also received the highest dollar value of support. The finding about child care businesses in Alberta is consistent with Alberta’s economic conditions. The oil and gas sector is an important contributor in Alberta’s economy, accounting for about 21% of total GDP in Alberta (Wang 2020). In 2020, the pandemic and the resulting significant drop in oil prices brought double blows to Alberta’s economy. As a result, its child care businesses were impacted more severely. For instance, Friendly et al.(2020) find that during the first stage of the pandemic, 63% of child care centres in Alberta reported that their financial situation was “much worse” than before the pandemic, the highest percentage across the provinces.
One limitation of this study is that only child care businesses with a valid BN were used in the analysis. These child care businesses tend to be larger. A significant number of small child care service providers are self-employed individuals who provide home child care and may not have a BN; thus, they are excluded from the study. Therefore, the analyses in this study are more relevant to larger child care businesses and may not paint the full picture for the entire child care industry.
References
Archer, J., Duhamel, B., Macdonald, R., Watt, J., & Yam, N. (2021). The early learning and child care industry in Canada: Business characteristics and industry gross domestic product. Economic and Social Reports. Catalogue no. 36-28-0001. Ottawa: Statistics Canada.
Beland, L.-P., Fakorede, O., Mikola, D., & Tang, H. (2021). The effect of COVID-19 on Canadian small businesses’ owners and their employees. Carleton University Working Paper.
Bezanson, K., Bevan, A., & Lysack, M., (2020, July 23). Rebuilding childcare for a fair recovery and a stronger economy.Retrieved from Brock University: https://brocku.ca/brock-news/2020/07/bezanson-bevan-and-lysack-rebuilding-childcare-for-a-fair-recovery-and-a-stronger-economy/
Chernenko, S., & Scharfstein, D. 2022. Racial Disparities in the Paycheck Protection Program, NBER Working Papers, No. 29748.
Findlay, L.C., & Arim, R. (2020). Child Care Use During and After the Pandemic. StatCan COVID-19: Data to Insights for a Better Canada. Statistics Canada Catalogue no. 45280001. Ottawa: Statistics Canada.
Friendly, M. Forer, B., Vickerson, R., & Mohamed, S. (2020). Canadian Child Care: Preliminary results from a national survey during the COVID-19 pandemic. Toronto: Childcare Resource and Research Unit; Ottawa: Child Care Now; Ottawa: Canadian Child Care Federation. Retrieved from https://childcarecanada.org/publications/other-publications/20/07/canadian-child-care-preliminary-results-national-survey-during
Heckman, J.J. (1979). Sample Selection Bias as a Specification Error. Econometrica, 47(1), 153–161. https://doi.org/10.2307/1912352
Leung, D., & Liu, H. (2022). The Canada Emergency Wage Subsidy program and business survival and growth during the COVID-19 pandemic in Canada. Economic and Social Reports. Catalogue no. 36-28-0001. Ottawa: Statistics Canada. DOI: https://doi.org/10.25318/36280001202200200006-eng
Macdonald, D., & Friendly, M. (2021). Sounding the Alarm: COVID-19’s impact on Canada’s precarious child care sector. Canadian Centre for Policy Alternatives.
Moyser, M., & Burlock, A. (2018). Time use: Total work burden, unpaid work, and leisure. Women in Canada: A Gender-based Statistical Report. Catalogue no. 89-503-X. Ottawa: Statistics Canada.
Standford, J. (2020). The Role of Early Learning and Child Care in Rebuilding Canada’s Economy After COVID-19. Vancouver: Centre for Future Work.
Statistics Canada. (2021). Survey on Early Learning and Child Care Arrangements, 2020. The Daily. Retrieved from https://www150.statcan.gc.ca/n1/daily-quotidien/210407/dq210407b-eng.htm.
Tam, S., Sood, S., & Johnston, C. (2021). Impact of COVID-19 on businesses majority-owned by specific populations, first quarter of 2021. StatCan COVID-19: Data to Insights for a Better Canada, Catalogue no. 45-28-0001. Ottawa: Statistics Canada
Wang, W. 2020. The Decline in Production and Investment in Canada’s Oil and Gas Sector and Its Impact on the Economy. Economic Insights, no. 109. Statistics Canada Catalogue no. 11-626-X. Ottawa: Statistics Canada.
Zamarro, G., & Pardos, M.J. (2021). Gender differences in couples’ division of childcare, work and mental health during COVID-19. Review of Economic of the Household, 19, 11-40. Retrieved from https://doi.org/10.1007/s11150-020-09534-7
- Date modified: