
Economic and Social Reports
Real production and real income growth over the COVID-19 pandemic
DOI: https://doi.org/10.25318/36280001202300400004-eng
Skip to text
Text begins
Abstract
During the COVID-19 pandemic, real consumption and real gross fixed capital formation (GFCF) grew at a stronger pace than real gross domestic product (GDP). Typically, real consumption and real GFCF are expected to progress similarly to real GDP, making the pandemic period unusual. This article illustrates how examining real income rather than real production can address this paradox. Specifically, the roles of changes in production (the use of capital, labour and multifactor productivity to produce real GDP) and changes in non-production sources of real income growth (the trading gain and net income from abroad) are examined. The results show that the terms of trade were a major source of real income growth that supported consumption and GFCF beyond what changes in production would suggest.
Keywords: Real income, terms of trade
Authors
Sean Clarke is with the Strategic Analysis, Publications and Training Division, Analytical Studies and Modelling Branch, at Statistics Canada. Ryan Macdonald is with the Economic Analysis Division, Analytical Studies and Modelling Branch, at Statistics Canada.
The COVID-19 pandemic affected the Canadian economy in numerous ways, one of which was changing the relationship between growth in production, and changes in real consumption and real gross fixed capital formation (GFCF). Generally, changes in real economic production (output), as measured by real gross domestic product (GDP), and changes in real income (the purchasing power of that output), as measured by real gross national income (GNI),Note tend to be fairly similar over time. As a result, real consumption or real GFCF typically tend to follow real GDP because it is the main source of changes in the ability of Canadians to buy consumption or investment goods.
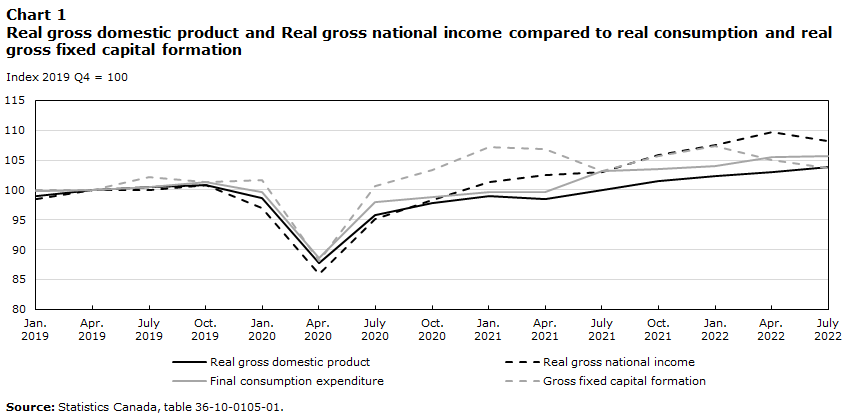
However, periodically, real GNI growth decouples from real GDP growth for short periods of time because of large terms of trade changes.Note This occurred during the commodity boom of the early 2000s and again during the pandemic.Note When large swings in the terms of trade occur, growth in real consumption or real GFCF will not be aligned with changes in real production. From the fourth quarter of 2019 to the third quarter of 2022, Canada’s terms of trade improved markedly so that, while real GDP increased by 3.0%, real GNI increased by 7.3% (Chart 1). Over the same period, real consumption rose by 4.3%, while real GFCF initially rose strongly only to flatten out after the middle of 2021.
Data table for Chart 1
| Real gross domestic product | Real gross national income | Final consumption expenditure | Gross fixed capital formation | |
|---|---|---|---|---|
| Index 2019 Q4 = 100 | ||||
| 2019 | ||||
| January | 99.05 | 98.42 | 99.90 | 100.00 |
| April | 100.00 | 100.00 | 100.00 | 100.00 |
| July | 100.43 | 100.00 | 100.56 | 102.21 |
| October | 100.78 | 100.79 | 101.35 | 101.34 |
| 2020 | ||||
| January | 98.61 | 97.02 | 99.70 | 101.60 |
| April | 87.78 | 85.96 | 88.65 | 88.11 |
| July | 95.75 | 95.18 | 98.04 | 100.70 |
| October | 97.75 | 98.33 | 98.80 | 103.40 |
| 2021 | ||||
| January | 99.05 | 101.32 | 99.70 | 107.17 |
| April | 98.44 | 102.54 | 99.59 | 106.92 |
| July | 99.91 | 103.07 | 103.09 | 103.20 |
| October | 101.56 | 105.79 | 103.56 | 105.61 |
| 2022 | ||||
| January | 102.25 | 107.54 | 104.00 | 107.42 |
| April | 103.03 | 109.74 | 105.53 | 105.08 |
| July | 103.81 | 108.16 | 105.74 | 103.74 |
| Source: Statistics Canada, table 36-10-0105-01. | ||||
Measuring real income
Changes in the real income (real GNI) of a trading economy such as Canada’s stem from three sources—changes in real production (real GDP), relative price changes (primarily the terms of trade) and changes in net international income flows. Real GDP is a measure of production based on the use of capital and labour to transform inputs into outputs. It is calculated using production prices to create real values.Note In an economy that does not trade, real production and the prices that consumers, businesses and governments face would be equal, and, therefore, real GDP and real GNI would be equal.
However, once an economy opens to trade, differences can arise between prices related to production and prices paid for consumption and real GFCF. For Canada, this generally occurs when raw materials (e.g., oil, lumber, wheat) are traded for consumer and investment products (e.g., clothing, computers, machinery, motor vehicles).Note Changes in the prices of raw materials relative to the prices for consumer and investment products can potentially create an effect called a trading gain that captures this relative price change. The trading gain comprises an effect from changes in the terms of trade (the price of exports relative to the price of imports) and an effect from changes in the relative prices of traded to non-traded commodities (referred to as a real exchange rate effect).Note When these relative prices change, they can raise (or lower) real GNI growth relative to real GDP growth as the economy is better (or worse) able to transform its outputs into consumption and investment products.
Additionally, when an economy participates in the global economy, it engages in and receives international investments, and it sends and receives international workers’ compensation for their efforts. The international investments can be portfolio investments or foreign direct investments. The investments create incomes that can be repatriated, and international workers may return money to their home countries from income they earn abroad. These effects create income flows referred to as net income from abroad, and they can raise or lower real income growth relative to real GDP.
Production drives real income growth over long periods
In Canada, over long periods, the single largest source of real income growth is production. From the first quarter of 1990 to the fourth quarter of 2019, real GNI increased at a quarterly annualized rate (QAR) of 2.6%, with 2.4 percentage points of that growth coming from increases in real GDP. Increases in real GDP are the result of increasing inputs into the production system (capital and labour) and from increasing multifactor productivity (MFP).Note Non-production sources of growth can make important contributions in particular periods, but these are typically partially offset in later periods (Baldwin and Macdonald 2012).
Contrary to the long-term trend, increases in non-production components of real income growth over the pandemic, particularly the terms of trade, were the major drivers of rising real incomes (Table 1). Real production grew from the fourth quarter of 2019 to the third quarter of 2022 because of increases in labour input and capital input, but MFP growth was near 0 (Table 1). As a result, increases in the use of capital and labour accounted for about half of real income growth, while the economy was not able to increase the efficiency of production. This is consistent with a situation where COVID-19-related disruptions affected the ability of the economy to function smoothly.
| 2019 Q4 to 2022 Q3 | Percentage points |
|---|---|
| Real gross national income | 2.60 |
| Contribution to growth from real gross domestic product | 1.08 |
| Contribution to growth from labour input | 0.49 |
| Contribution to growth from capital input | 0.66 |
| Contribution to growth from multifactor productivity | -0.06 |
| Contribution to growth from trading gain | 1.66 |
| Contribution to growth from terms of trade | 1.63 |
| Contribution to growth from real exchange rate | 0.04 |
| Contribution to growth from net income from abroad | -0.06 |
|
Note: Values may not sum because of rounding. Source: Statistics Canada. |
|
In addition to the pandemic-related disruptions, the shift in the composition of investment in the Canadian economy from more productive business sector assets such as machinery and equipment towards the housing stock also affected growth in MFP. From the fourth quarter of 2019 to the first quarter of 2022, business GFCF in machinery and equipment rose 1.2% at a QAR, while business GFCF in non-residential structures declined 1.8% at a QAR, but residential construction increased 7.0% at a QAR. This pattern reversed itself as interest rates rose over the summer and fall of 2022, leading to a decline of 23.9% at a QAR for housing investment, while building investment (+12.7% at a QAR) and machinery and equipment (+6.6% at a QAR) increased. Overall, this means that, compared with the start of the pandemic, the Canadian capital stock is providing relatively more benefits to homeowners and relatively fewer benefits to businesses. Since the housing stock is not as productive as the business sector capital stock, all else equal, the total capital stock is not as productive as before the pandemic, even though there is more capital available.
Trading gains are a major source of real income growth over the pandemic
While production essentially returned to pre-pandemic levels by the first quarter of 2022, this was not the case for the non-production components of real income growth—the trading gain and net income from abroad. Net income from abroad decreased marginally from the fourth quarter of 2019 to the third quarter of 2022, lowering real income growth by 0.06 percentage points per quarter. Canada’s trading gain, however, rose sharply as a result of rising commodity prices, especially energy commodities. From the fourth quarter of 2019 to the third quarter of 2022, the trading gain contributed 1.66 percentage points per quarter to real income growth and was a major source of real GNI growth during this period (Table 1).
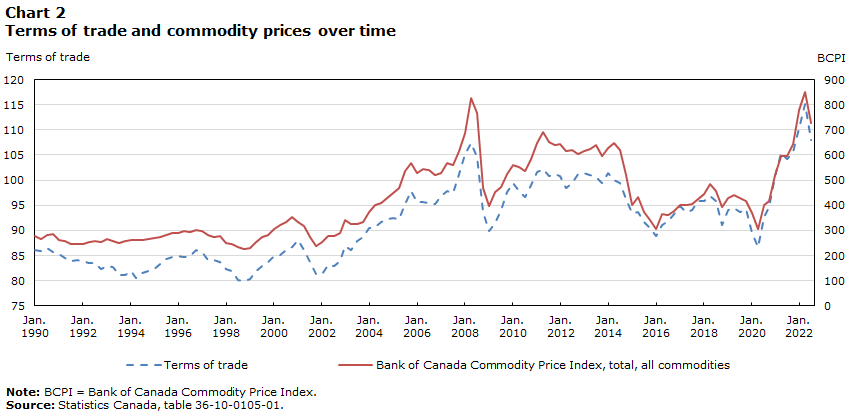
Canada’s trading gain is primarily the result of terms of trade changes, which move similarly to commodity prices over time (Chart 2). By the first quarter of 2022, the terms of trade had increased significantly, raising real GNI compared with immediately before the pandemic. And while recent declines have unwound some of these gains, the terms of trade are still elevated compared with before the pandemic.
Data table for Chart 2
| Terms of trade | Bank of Canada Commodity Price Index, total, all commodities | |
|---|---|---|
| 1990 | ||
| January | 86.2 | 276.8 |
| April | 86.0 | 266.6 |
| July | 86.5 | 283.5 |
| October | 85.7 | 287.0 |
| 1991 | ||
| January | 85.4 | 260.4 |
| April | 84.6 | 256.7 |
| July | 83.9 | 246.6 |
| October | 84.2 | 246.3 |
| 1992 | ||
| January | 84.0 | 246.4 |
| April | 83.6 | 255.6 |
| July | 83.5 | 257.0 |
| October | 82.3 | 254.6 |
| 1993 | ||
| January | 83.0 | 266.4 |
| April | 82.8 | 258.2 |
| July | 81.2 | 248.4 |
| October | 81.2 | 255.9 |
| 1994 | ||
| January | 82.0 | 262.6 |
| April | 80.6 | 263.3 |
| July | 81.5 | 262.3 |
| October | 82.0 | 264.4 |
| 1995 | ||
| January | 82.3 | 271.7 |
| April | 83.4 | 274.1 |
| July | 84.4 | 283.3 |
| October | 84.7 | 289.9 |
| 1996 | ||
| January | 84.9 | 290.4 |
| April | 84.8 | 298.6 |
| July | 85.0 | 295.1 |
| October | 86.2 | 302.8 |
| 1997 | ||
| January | 85.8 | 296.8 |
| April | 84.2 | 281.2 |
| July | 84.2 | 275.0 |
| October | 83.8 | 276.3 |
| 1998 | ||
| January | 82.3 | 249.6 |
| April | 82.0 | 245.3 |
| July | 80.2 | 233.6 |
| October | 79.9 | 228.0 |
| 1999 | ||
| January | 80.3 | 230.4 |
| April | 81.9 | 252.7 |
| July | 82.9 | 271.8 |
| October | 83.7 | 281.8 |
| 2000 | ||
| January | 85.0 | 304.2 |
| April | 85.2 | 320.6 |
| July | 86.2 | 333.7 |
| October | 86.6 | 352.8 |
| 2001 | ||
| January | 88.0 | 332.2 |
| April | 86.1 | 317.8 |
| July | 83.8 | 273.6 |
| October | 81.3 | 237.6 |
| 2002 | ||
| January | 81.3 | 252.9 |
| April | 83.2 | 279.7 |
| July | 82.9 | 276.9 |
| October | 84.0 | 289.3 |
| 2003 | ||
| January | 86.9 | 339.8 |
| April | 86.1 | 326.6 |
| July | 87.8 | 325.4 |
| October | 88.7 | 334.5 |
| 2004 | ||
| January | 90.5 | 372.2 |
| April | 90.7 | 402.1 |
| July | 91.7 | 408.6 |
| October | 92.2 | 427.1 |
| 2005 | ||
| January | 92.5 | 448.7 |
| April | 92.3 | 467.0 |
| July | 95.2 | 537.2 |
| October | 97.9 | 569.1 |
| 2006 | ||
| January | 95.6 | 529.5 |
| April | 95.6 | 546.1 |
| July | 95.5 | 539.3 |
| October | 95.3 | 521.0 |
| 2007 | ||
| January | 96.8 | 529.1 |
| April | 97.8 | 570.0 |
| July | 97.5 | 561.6 |
| October | 101.2 | 614.4 |
| 2008 | ||
| January | 105.2 | 687.9 |
| April | 107.4 | 825.9 |
| July | 104.5 | 765.5 |
| October | 93.6 | 469.1 |
| 2009 | ||
| January | 89.9 | 397.3 |
| April | 91.5 | 453.6 |
| July | 94.1 | 471.4 |
| October | 97.6 | 523.8 |
| 2010 | ||
| January | 99.4 | 562.1 |
| April | 97.8 | 552.1 |
| July | 96.7 | 537.8 |
| October | 99.1 | 585.0 |
| 2011 | ||
| January | 101.6 | 648.0 |
| April | 102.3 | 691.0 |
| July | 100.9 | 653.5 |
| October | 101.3 | 640.2 |
| 2012 | ||
| January | 100.8 | 643.6 |
| April | 98.5 | 614.0 |
| July | 99.4 | 618.5 |
| October | 101.3 | 603.4 |
| 2013 | ||
| January | 101.4 | 615.8 |
| April | 101.0 | 623.5 |
| July | 100.7 | 638.2 |
| October | 99.5 | 595.5 |
| 2014 | ||
| January | 101.5 | 629.0 |
| April | 100.0 | 649.5 |
| July | 99.4 | 621.4 |
| October | 96.2 | 521.0 |
| 2015 | ||
| January | 93.4 | 399.5 |
| April | 93.6 | 434.4 |
| July | 91.6 | 371.9 |
| October | 90.5 | 340.4 |
| 2016 | ||
| January | 88.8 | 304.3 |
| April | 91.0 | 365.0 |
| July | 91.9 | 362.8 |
| October | 93.3 | 375.7 |
| 2017 | ||
| January | 94.9 | 400.6 |
| April | 93.6 | 400.1 |
| July | 94.0 | 404.8 |
| October | 95.8 | 425.2 |
| 2018 | ||
| January | 95.9 | 443.0 |
| April | 96.8 | 484.5 |
| July | 95.9 | 456.7 |
| October | 91.1 | 393.6 |
| 2019 | ||
| January | 94.0 | 429.6 |
| April | 94.5 | 441.0 |
| July | 93.7 | 427.3 |
| October | 94.2 | 417.2 |
| 2020 | ||
| January | 89.5 | 367.9 |
| April | 86.6 | 303.8 |
| July | 92.6 | 399.4 |
| October | 94.7 | 417.8 |
| 2021 | ||
| January | 100.8 | 520.7 |
| April | 105.3 | 594.2 |
| July | 104.1 | 597.7 |
| October | 105.6 | 641.8 |
| 2022 | ||
| January | 110.3 | 779.3 |
| April | 115.2 | 852.4 |
| July | 107.9 | 727.1 |
|
Note: BCPI = Bank of Canada Commodity Price Index. Source: Statistics Canada, table 36-10-0105-01. |
||
Conclusion
In the Canadian economy, as of the third quarter of 2022, real income growth has outpaced real GDP growth since the fourth quarter of 2019. Over this period, the efficiency of production in the economy stagnated as capital and labour were added into the economy but without a corresponding increase in MFP. Given the issues in global supply chains and global logistics, improvements to efficiency will take time to work out. Firms will also require time to determine how best to use the remote work capabilities that were put in place during the pandemic. The latter challenges require changes to organizational structures and workplace cultures, and it is not clear what the short- and medium-term impacts of these changes will be.
Since the onset of the pandemic, major gains in real income have come from the terms of trade. Improvements in the terms of trade supported rising consumption and the initial bounce back in GFCF, but these are known to be volatile since commodity price movements can be significant and rapid. Therefore, there remains uncertainty about the permanence of the real income gains as the war in Ukraine continues to affect commodity markets and the global economy digests the recent increases in interest rates.
References
Baldwin, J., and R. Macdonald. 2012. Natural Resources, the Terms of Trade, and Real Income Growth in Canada: 1870 to 2010. Statistics Canada Catalogue no. 11F0027M. Ottawa, Ontario. Economic Analysis Research Paper Series. No. 79.
Francis, M. 2008. Adjusting to the commodity boom: The experience of four industrialized economies. Bank of Canada Review: Autumn 2008. p. 29–41.
Macdonald, R. 2008. Terms of trade and domestic spending. Insights on the Canadian Economy. Statistics Canada catalogue number 11-624-MIE. No. 10. Statistics Canada: Ottawa.
Macdonald, R. 2010. “Real gross domestic income, relative prices and economic performance across the OECD.” Review of Income and Wealth. Vol. 56. No. 3. p. 498−518.
United Nations (UN), European Commission (EC). International Monetary Fund (IMF), Organisation for Economic Co-operation and Development (OECD), and World Bank (WB). 2009. System of National Accounts, 2008. New York: United Nations. Available at: System of National Accounts, 2008 (accessed February 27, 2023).
- Date modified: