
Economic and Social Reports
Registered education savings plan investments by family income and liquid wealth
DOI: https://doi.org/10.25318/36280001202200900001-eng
Text begins
Registered Education Savings Plans (RESPs) are an important vehicle to help families save for postsecondary education. Several financial incentives have existed for many years to encourage low- and middle-income families to open RESP accounts and contribute to them. Despite these targeted incentives, large differences in RESP savings persist between families of different income levels. Among families with children, those in the top 20% of the after-tax income distribution held $22,052 in RESP investments in 2019, compared with $3,295 among their counterparts in the bottom 20% (Frenette 2022).Note
Why do such differences remain? The answer is not fully known, but a recent study did investigate the role of several parental factors, including wealth; education; and literacy, numeracy and financial literacy (Bonikowska and Frenette 2020). The main factor identified by the study was wealth (net worth), which accounted for 50% to 79% of the total gap in RESP participation between families in the top and bottom income quartiles, depending on the method and dataset used. These results were perhaps not surprising, since investing in RESPs requires available funds or assets to borrow against, both of which may be more available from one’s stock reserves (i.e., wealth) as opposed one’s flow of funds (i.e., income).
Wealth can take two forms: liquid or illiquid. Illiquid wealth, such as a residence or certain registered investments—namely Registered Retirement Savings Plans (RRSPs), Registered Retirement Income Funds (RRIFs), or Deferred Profit Sharing Plans (DPSPs)—cannot be accessed without significant transaction costs and may be less relevant than liquid wealth when it comes to gauging a family’s ability to invest in RESPs. Liquid wealth (including chequing and savings accounts, investment funds and trusts, stocks and shares, bonds and debentures, and Tax-Free Savings
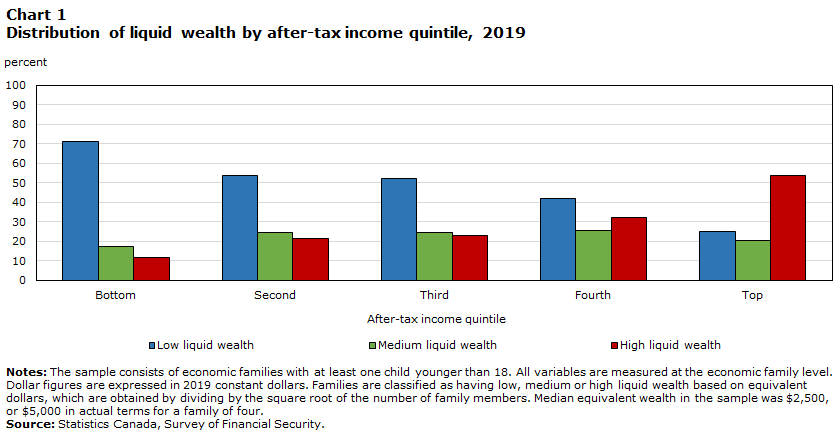
Do families targeted by the income-based RESP incentives all have low levels of liquid wealth, and do families excluded from these incentives all have significant liquid wealth? The answer is no, as shown in Chart 1. In 2019, 11.5% of families in the bottom 20% (or lowest income quintile) of the income distribution had high liquid wealth (at least $20,000 for a family of four), while 25.3% of families in the top income quintile had low liquid wealth (below $5,000 for a family of four).
Importantly, families within the same income bracket (or quintile), but with different levels of liquid wealth, made very different RESP investment decisions. For example, Chart 2 indicates that among families in the middle (or third) income quintile, mean RESP investments were $15,085 among those with high liquid wealth—almost three times more than families with low liquid wealth ($5,504). Similar trends were evident in all other income quintiles.Note
In summary, despite the existence of several financial incentives for low- and middle-income families to open and contribute to an RESP account, large differences in RESP investments persist across the income distribution. Another important factor is liquid wealth—high‑liquid-wealth families tend to hold considerably more RESP investments than low-liquid-wealth families, even when both are in the same income group.
Data table for Chart 1
| After-tax income quintile | Low liquid wealth | Medium liquid wealth | High liquid wealth |
|---|---|---|---|
| percent | |||
| Bottom | 71.3 | 17.2 | 11.5 |
| Second | 53.9 | 24.5 | 21.6 |
| Third | 52.5 | 24.5 | 23.1 |
| Fourth | 41.9 | 25.8 | 32.3 |
| Top | 25.3 | 20.7 | 54.0 |
|
Notes: The sample consists of economic families with at least one child younger than 18. All variables are measured at the economic family level. Dollar figures are expressed in 2019 constant dollars. Families are classified as having low, medium or high liquid wealth based on equivalent dollars, which are obtained by dividing by the square root of the number of family members. Median equivalent wealth in the sample was $2,500, or $5,000 in actual terms for a family of four. Source: Statistics Canada, Survey of Financial Security. |
|||

Data table for Chart 2
| After-tax income quintile | Low liquid wealth | Medium liquid wealth | High liquid wealth |
|---|---|---|---|
| mean RESP investments (dollars) | |||
| Bottom | 2,497.1 | 5,022.1 | 5,665.9 |
| Second | 4,440.3 | 8,968.2 | 11,522.7 |
| Third | 5,504.4 | 7,221.7 | 15,084.8 |
| Fourth | 9,523.5 | 8,872.8 | 17,230.3 |
| Top | 13,841.5 | 13,960.4 | 28,997.4 |
|
Notes: RESP = Registered Education Savings Plan. The sample consists of economic families with at least one child younger than 18. All variables are measured at the economic family level. Dollar figures are expressed in 2019 constant dollars. Families are classified as having low, medium or high liquid wealth based on equivalent dollars, which are obtained by dividing by the square root of the number of family members. Median equivalent wealth in the sample was $2,500, or $5,000 in actual terms for a family of four. Source: Statistics Canada, Survey of Financial Security. |
|||
References
Bonikowska, A., and M. Frenette. 2020. Why Are Lower-income Parents Less Likely to Open an RESP Account? The Roles of Literacy, Education, and Wealth. Analytical Studies Branch Research Paper Series, No. 449. Statistics Canada Catalogue No. 11F0019M. Ottawa: Statistics Canada.
Frenette, M. 2022. Recent Trends in RESP Holdings by Income, Immigrant Status, Indigenous Identity, and Province. Economic and Social Reports. Statistics Canada Catalogue No. 36-28-0001. Ottawa: Statistics Canada.
Kaplan, G., G. L. Violante, and J. Weidner, 2014. The Wealthy Hand-to-Mouth. Brookings Papers on Economic Activity, Economic Studies Program. The Brookings Institution. 45(1), p. 77–153.
- Date modified: