
Economic and Social Reports
The COVID-19 pandemic and gross domestic product per capita growth in Canada
DOI: https://doi.org/10.25318/36280001202200500002-eng
Abstract
The COVID-19 pandemic has been affecting Canadians’ daily lives since the second quarter of 2020. During the pandemic, many economic activities have been restricted, fully or partially, to help slow down the spread of this contagious disease. As a result, production and employment were cut back substantially, leading to a sharp decrease in income and a rise in the unemployment rate. While gross domestic product (GDP) had largely recovered to pre-pandemic levels by the end of 2021, GDP per capita has not. GDP per capita of a country is often used for assessing the standard of living. Since 2020, Canada’s GDP per capita growth has averaged a decrease of 1.3% per year, down from its long-term annual average of 1.2% from 1981 to 2019 and of 1.0% per year from 2010 to 2019.
For a better understanding of the sources of Canada’s GDP per capita growth, GDP per capita is decomposed into labour productivity, work intensity, the employment rate, the participation rate and the share of the working-age population. The results show that, in the long run, labour productivity growth is the major source of Canada’s GDP per capita growth, although the contribution of other factors is also significant. However, during the pandemic, the decline in GDP per capita was driven by drops in work intensity, the employment rate and the participation rate. The drops in the participation rate and employment rate were largely driven by young people and seniors, and the drop in work intensity was mainly driven by male workers. If all three ratios had not been affected by the pandemic and had kept their momentum from 2010 onward, GDP per capita in Canada could have been 4% higher than it actually was in 2021.
Author
Weimin Wang is with the Economic Analysis Division at Statistics Canada.
Introduction
The COVID-19 pandemic has significantly affected economic activities in Canada for past two years. Since the second quarter of 2020, nonessential economic activities such as travel, hospitality and personal services were closed or restricted to help slow down the spread of COVID-19. These restrictions were relaxed or tightened at times to try to reach a good balance between saving lives and saving the economy. As a result, production and employment were significantly cut back in the second quarter of 2020. Both production and employment have been recovering gradually since then.
This study analyzes the trends in Canada’s gross domestic product (GDP) per capitaNote and its sources, and examines how these trends are influenced by the COVID-19 pandemic. GDP per capita is often used for assessing the standard of living and for making cross-country comparisons in the economic standing of a country (Easterlin, 2000; Maddison, 1983).Note Canada’s GDP per capita decreased by 1.3% per year during the pandemic from 2020 to 2021, decelerating from its long-term trend of 1.2% per year over the period from 1981 to 2019. Although Canada’s GDP has almost reached its pre-pandemic level, Canadians may not feel the recovery of the economy since GDP per capita is still lagging.
There are three sources of GDP per capita growth. The first is the improvement of production efficiency often indicated by (labour) productivity growth; the second is the change in work intensity measured as hours worked per employment; and the third is the increase of the wide measure of employment, which is defined in this paper as the ratio of total employment to population. Any change in the wide measure of employment is a result of interaction between labour demand and labour supply, and also a reflection of demographic characteristics.
Productivity growth and GDP per capita growth have been widely used interchangeably in growth theory and empirical applications under the assumption of full use of resources. Krugman (1990) claimed that productivity growth is the only way to sustain improvements in living standards or quality of life. Tang and Wang (2004) pointed out that productivity is the fundamental determinant of differences in GDP per capita across a country or region since it provides the economic base for health, education, environmental improvement, infrastructure, poverty reduction and social security. Nevertheless, Marattin and Salotti (2011) showed that it is important to recognize the difference between productivity growth and GDP per capita growth, and failing to recognize the difference can be misleading.
The most important aspect of dynamics in the wide measure of employment is the increase in the female participation rate in past decades (see, for example, Beaudry and Lemieux [1999] for Canada from 1976 to 1994, Euwals et al. [2011] for the Netherlands in the 1980s and 1990s, and Jaumotte [2003] for Organisation for Economic Co-operation and Development countries from 1985 to 1999).
For a better understanding of the sources of GDP per capita growth in Canada, this paper decomposes GDP per capita into five ratios: hourly labour productivity measured as GDP per hour worked, work intensity measured as hours worked per employment, employment rate measured as employment per labour force, participation rate measured as the labour force to working-age population ratio and the share of the working-age population in the total population. The last three ratios together give the ratio of employment to population, which is termed “wide measure of employment” in this paper. To examine the role of women in the labour market, the wide measure of employment and its three components were decomposed into contributions by men and women.
The results show that over the long term from 1981 to 2019, 92.5% of GDP per capita growth was attributable to hourly labour productivity growth that was partly offset by a 14.5% decline in work intensity, and 22.0% came from growth of the wide measure of employment during the same period. During the pandemic, work intensity, the employment rate and the participation rate decreased significantly, leading to a large drop in GDP per capita. At the same time, hourly labour productivity increased by 0.7% per year on average. Without the gain in hourly labour productivity, the drop in GDP per capita in the past two years could have been 50% more than reported.
Also, the drops in the participation rate and the employment rate during the pandemic were largely driven by young people and seniors, and the drop in work intensity was mainly driven by male workers. Had the steady momentum of all ratios from 2010 onward not been interrupted by the pandemic, GDP per capita in Canada could have been 4% higher than reported in 2021.
Gross domestic product per capita: A three-term decomposition
Let be real GDP, be the total population, be total hours worked and be the employment of people aged 15 and older. GDP per capita can then be written as
Each of these three ratios gives different information about the economy. Hourly labour productivity ( ) indicates the efficiency level of the employed resources in production, which relies on both the capital–labour ratio and multifactor productivity levelNote . The hours worked per employment ratio ( ) provides information on labour supply and work intensity. Its trend over time largely reflects the social progress in work–life balance. The employment per population ratio ( ) reflects a result of labour market conditions and demographic characteristics.
Chart 1 presents trends in GDP per capita, GDP per hours worked, hours worked per employment (work intensity) and employment per population (the wide measure of employment) from 1981 to 2021. As expected, GDP per capita and hourly labour productivity moved up closely together before the start of the pandemic in 2020. Meanwhile, the wide measure of employment increased at a much slower pace, and work intensity trended down moderately. The chart clearly shows that before the pandemic, productivity growth was the major source of growth in GDP per capita, although the contribution of the increase in the wide measure of employment is also not negligible.
Since 2020, economic activities in Canada such as travel, hospitality and personal services have been significantly affected by the pandemic-related restrictions and regulations implemented to help slow down the spread of COVID-19. The initial impact of these restrictions and regulations was a large drop in production and employment in the second quarter of 2020. The economy has recovered gradually since the initial shock. Chart 1 shows that GDP per capita, work intensity and the wide measure of employment dropped significantly in 2020, then partly recovered in 2021. At the same time, hourly labour productivity deviated from its long-term relationship with GDP per capita and moved in the opposite direction. It moved up in response to the shock in 2020, but moved down when the economy was recovering in 2021.

Data table for Chart 1
| GDP per capita | GDP per hour | Hours per employment | Employment per population | |
|---|---|---|---|---|
| percent | ||||
| 1981 | 100.0 | 100.0 | 100.0 | 100.0 |
| 1982 | 95.7 | 101.4 | 98.6 | 95.7 |
| 1983 | 97.2 | 103.7 | 98.3 | 95.4 |
| 1984 | 102.0 | 106.5 | 98.8 | 96.9 |
| 1985 | 105.8 | 107.5 | 99.4 | 99.0 |
| 1986 | 107.0 | 106.6 | 99.4 | 101.0 |
| 1987 | 109.9 | 107.1 | 100.2 | 102.4 |
| 1988 | 113.3 | 108.2 | 100.5 | 104.1 |
| 1989 | 113.9 | 108.4 | 100.4 | 104.6 |
| 1990 | 112.3 | 108.4 | 99.9 | 103.8 |
| 1991 | 108.6 | 109.3 | 98.7 | 100.7 |
| 1992 | 108.3 | 111.4 | 98.7 | 98.5 |
| 1993 | 110.0 | 113.5 | 99.0 | 97.9 |
| 1994 | 113.7 | 115.4 | 99.6 | 98.9 |
| 1995 | 115.5 | 116.7 | 99.4 | 99.6 |
| 1996 | 116.2 | 116.5 | 100.2 | 99.5 |
| 1997 | 120.0 | 119.8 | 99.5 | 100.6 |
| 1998 | 123.6 | 122.0 | 99.1 | 102.3 |
| 1999 | 128.9 | 125.0 | 99.2 | 104.0 |
| 2000 | 134.4 | 129.0 | 98.6 | 105.6 |
| 2001 | 135.3 | 131.0 | 97.7 | 105.7 |
| 2002 | 137.9 | 133.2 | 96.7 | 107.1 |
| 2003 | 139.1 | 133.4 | 95.9 | 108.7 |
| 2004 | 142.1 | 134.5 | 96.5 | 109.4 |
| 2005 | 145.2 | 137.5 | 96.2 | 109.8 |
| 2006 | 147.6 | 139.1 | 96.1 | 110.4 |
| 2007 | 149.2 | 139.3 | 96.0 | 111.6 |
| 2008 | 149.0 | 138.8 | 95.9 | 112.0 |
| 2009 | 143.0 | 139.4 | 94.2 | 108.9 |
| 2010 | 145.8 | 140.9 | 94.8 | 109.2 |
| 2011 | 148.9 | 143.2 | 94.7 | 109.8 |
| 2012 | 149.9 | 143.7 | 95.0 | 109.8 |
| 2013 | 151.8 | 145.8 | 94.6 | 110.0 |
| 2014 | 154.6 | 149.8 | 94.3 | 109.5 |
| 2015 | 154.5 | 149.5 | 94.4 | 109.4 |
| 2016 | 154.3 | 150.1 | 94.4 | 108.9 |
| 2017 | 157.0 | 152.5 | 93.8 | 109.8 |
| 2018 | 159.1 | 153.0 | 94.6 | 110.0 |
| 2019 | 159.8 | 154.3 | 93.4 | 110.9 |
| 2020 | 149.7 | 165.6 | 87.0 | 103.9 |
| 2021 | 155.7 | 156.3 | 92.0 | 108.3 |
|
Note: GDP = gross domestic product. Sources: Common Output Data Repository tables 36-10-0207, 14-10-0022 and 17-10-0060. |
||||
For having an exact growth accounting framework, decomposition can be rewritten in its logarithm form:
Decomposition suggests that the growth in the natural logarithm (“growth” or “log growth” hereafter) in GDP per capita is additive on the log growth in GDP per hour worked, hours worked per employment and employment per population.
Table 1 shows the results of decomposition for Canada in the long term before the pandemic (1981 to 2019), in the medium term after the financial crisis (2010 to 2019) and during the pandemic (2019 to 2021). As shown, Canada’s GDP per capita dropped by 1.3% per year on average over the two years during the pandemic, down from an increase of 1.2% per year on average over the long term before the pandemic. The drop in GDP per capita growth during the pandemic was largely driven by both the wide measure of employment and work intensity. It was slightly improved by the increase in hourly labour productivity. In the long term before the pandemic, GDP per capita trended up by 1.2% per year on average from 1981 to 2019, of which 92.5% came from hourly labour productivity growth and 22.0% came from the increase in the wide measure of employment, and the decreasing work intensity lowered GDP per capita growth by 0.2 percentage points per year, or by 14.5%. Annual average growth of GDP per capita and its sources for the medium-term period after the financial crisis (2010 to 2019) are similar to those in the long run.
| Before the pandemic (1981 to 2019) | After the financial crisis (2010 to 2019) | During the pandemic (2019 to 2021) | |
|---|---|---|---|
| percent | |||
| GDP per capita growth | 1.2 | 1.0 | -1.3 |
| percentage point | |||
| Source of GDP per capita growth | |||
| GDP per hour | 1.1 | 1.0 | 0.7 |
| Hours per employment | -0.2 | -0.2 | -0.8 |
| Employment per population | 0.3 | 0.2 | -1.2 |
| Total | 1.2 | 1.0 | -1.3 |
| percent | |||
| Source of GDP per capita growth | |||
| GDP per hour | 92.5 | 98.8 | -50.2 |
| Hours per employment | -14.5 | -15.6 | 60.9 |
| Employment per population | 22.0 | 16.8 | 89.3 |
| Total | 100.0 | 100.0 | 100.0 |
|
Note: GDP refers to gross domestic product. Sources: Author’s calculations based on Common Output Data Repository tables 36-10-0207, 14-10-0022 and 17-10-0060. |
|||
Employment per population: A three-term decomposition
With as the number of people in the labour force aged 15 and older, and as the population aged 15 and older, employment per population can be written as
Thus, employment per population equals the product of three ratios: the employment rate ( ), the participation rate ( ) and the share of the working population ( ). The employment rate reflects the aggregate demand for labour in an economy in which many individuals who are looking for a job can actually have one. The participation rate indicates how many people out of the working population are looking for a job, and the share of the working population is a demographic feature of an economy.
Chart 2 presents the trends in employment per population and its three components. As shown, both employment per population and the share of the working population trended up at a similar pace, while the participation rate and the employment rate did not demonstrate a trend. It seems as though the trend in employment per population is mainly driven by the share of the working population, and its variations are driven by the variations in the participation rate and the employment rate. These relationships can also be seen from their movements during the pandemic. As expected, the movement in the share of the working population was not interrupted by the pandemic, because this ratio is a reflection of demographic characteristics. The other three ratios experienced a large drop in 2020 and a partial recovery in 2021.

Data table for Chart 2
| Employment per population | Employment rate | Participation rate | Share of working population | |
|---|---|---|---|---|
| percent | ||||
| 1981 | 100.0 | 100.0 | 100.0 | 100.0 |
| 1982 | 95.7 | 96.3 | 99.0 | 100.4 |
| 1983 | 95.4 | 95.2 | 99.5 | 100.7 |
| 1984 | 96.9 | 96.0 | 100.0 | 101.0 |
| 1985 | 99.0 | 96.9 | 101.0 | 101.3 |
| 1986 | 101.0 | 97.9 | 101.6 | 101.6 |
| 1987 | 102.4 | 98.7 | 101.9 | 101.8 |
| 1988 | 104.1 | 99.8 | 102.4 | 101.9 |
| 1989 | 104.6 | 100.1 | 102.5 | 102.0 |
| 1990 | 103.8 | 99.4 | 102.2 | 102.1 |
| 1991 | 100.7 | 97.1 | 101.6 | 102.1 |
| 1992 | 98.5 | 96.1 | 100.4 | 102.0 |
| 1993 | 97.9 | 95.9 | 100.0 | 102.1 |
| 1994 | 98.9 | 97.0 | 99.7 | 102.2 |
| 1995 | 99.6 | 98.0 | 99.3 | 102.4 |
| 1996 | 99.5 | 97.8 | 99.1 | 102.7 |
| 1997 | 100.6 | 98.4 | 99.3 | 103.0 |
| 1998 | 102.3 | 99.3 | 99.8 | 103.3 |
| 1999 | 104.0 | 100.0 | 100.3 | 103.6 |
| 2000 | 105.6 | 100.8 | 100.7 | 104.0 |
| 2001 | 105.7 | 100.4 | 100.8 | 104.4 |
| 2002 | 107.1 | 99.9 | 102.2 | 104.8 |
| 2003 | 108.7 | 100.0 | 103.3 | 105.1 |
| 2004 | 109.4 | 100.5 | 103.2 | 105.5 |
| 2005 | 109.8 | 100.9 | 102.7 | 105.9 |
| 2006 | 110.4 | 101.4 | 102.4 | 106.4 |
| 2007 | 111.6 | 101.7 | 102.9 | 106.7 |
| 2008 | 112.0 | 101.5 | 103.1 | 106.9 |
| 2009 | 108.9 | 99.2 | 102.5 | 107.2 |
| 2010 | 109.2 | 99.5 | 102.2 | 107.4 |
| 2011 | 109.8 | 100.1 | 102.0 | 107.6 |
| 2012 | 109.8 | 100.3 | 101.7 | 107.7 |
| 2013 | 110.0 | 100.5 | 101.6 | 107.8 |
| 2014 | 109.5 | 100.7 | 100.9 | 107.8 |
| 2015 | 109.4 | 100.7 | 100.8 | 107.8 |
| 2016 | 108.9 | 100.6 | 100.4 | 107.8 |
| 2017 | 109.8 | 101.3 | 100.5 | 107.9 |
| 2018 | 110.0 | 101.8 | 100.0 | 108.0 |
| 2019 | 110.9 | 102.0 | 100.5 | 108.1 |
| 2020 | 103.9 | 97.9 | 98.0 | 108.2 |
| 2021 | 108.3 | 100.2 | 99.7 | 108.4 |
| Sources: Common Output Data Repository tables 14-10-0022 and 17-10-0060. | ||||
Similarly, to obtain the associated growth accounting results, decomposition can be rewritten in its logarithm form as
Table 2 presents the results of decomposition for Canada from 1981 to 2021. During the pandemic, the wide measure of employment declined by 1.2% per year, of which 79.1% came from the drop in the employment rate and 33.2% came from the drop in the participation rate. In the long term, the wide measure of employment increased steadily by 0.3% per year on average, mainly driven by the increase in the employment rate and the share of the working population. There was little change in the participation rate in the long run.
| Before the pandemic (1981 to 2019) | After the financial crisis (2010 to 2019) | During the pandemic (2019 to 2021) | |
|---|---|---|---|
| percent | |||
| Employment per population growth | 0.3 | 0.2 | -1.2 |
| percentage point | |||
| Source of employment per population growth | |||
| Employment rate | 0.1 | 0.3 | -0.9 |
| Participation rate | 0.0 | -0.2 | -0.4 |
| Share of working population | 0.2 | 0.1 | 0.1 |
| Total | 0.3 | 0.2 | -1.2 |
| percent | |||
| Source of employment per population growth | |||
| Employment rate | 19.5 | 166.1 | 79.1 |
| Participation rate | 4.7 | -109.3 | 33.2 |
| Share of working population | 75.8 | 43.2 | -12.3 |
| Total | 100.0 | 100.0 | 100.0 |
| Sources: Author’s calculations based on Common Output Data Repository tables 14-10-0022 and 17-10-0060. | |||
Participation rate, employment rate and work intensity by gender
Although productivity growth is the major driving force of GDP per capita growth in the long run, the participation rate, the employment rate and work intensity play an important role in the short run, especially during the pandemic. This subsection examines the extent to which women contribute to changes in the participation rate, the employment rate and work intensity during the pandemic and in the longer term.
Participation rate
As shown in Table 2, the participation rate dropped by 0.4% per year during the pandemic, but it was hardly changed over the period from 1981 to 2019. However, the stable overall participation rate is a result of the increasing female participation rate and the decreasing male participation rate. As shown in Chart 3, the female participation rate rose rapidly in the 1980s and 1990s, from 50.8% in 1981 to 60.0% in 2003, and remained stable thereafter. Meanwhile, the male participation rate declined steadily over the whole sample, from 76.4% in 1981 to 67.6% in 2021. The female participation rate was 59.0% in 2021, 8.6 percentage points lower than that of men.

Data table for Chart 3
| All | Male | Female | |
|---|---|---|---|
| percent | |||
| 1981 | 100.0 | 100.0 | 100.0 |
| 1982 | 99.0 | 98.2 | 100.2 |
| 1983 | 99.5 | 98.0 | 101.8 |
| 1984 | 100.0 | 97.8 | 103.3 |
| 1985 | 101.0 | 97.9 | 105.5 |
| 1986 | 101.6 | 97.9 | 107.0 |
| 1987 | 101.9 | 97.6 | 108.2 |
| 1988 | 102.4 | 97.3 | 109.9 |
| 1989 | 102.5 | 97.0 | 110.7 |
| 1990 | 102.2 | 96.2 | 111.3 |
| 1991 | 101.6 | 94.8 | 111.6 |
| 1992 | 100.4 | 93.7 | 110.4 |
| 1993 | 100.0 | 93.1 | 110.2 |
| 1994 | 99.7 | 92.8 | 110.0 |
| 1995 | 99.3 | 92.1 | 109.9 |
| 1996 | 99.1 | 91.8 | 109.9 |
| 1997 | 99.3 | 91.8 | 110.5 |
| 1998 | 99.8 | 91.8 | 111.6 |
| 1999 | 100.3 | 92.1 | 112.6 |
| 2000 | 100.7 | 92.0 | 113.5 |
| 2001 | 100.8 | 91.8 | 114.0 |
| 2002 | 102.2 | 92.8 | 116.2 |
| 2003 | 103.3 | 93.3 | 118.1 |
| 2004 | 103.2 | 92.9 | 118.3 |
| 2005 | 102.7 | 92.4 | 117.7 |
| 2006 | 102.4 | 91.8 | 117.8 |
| 2007 | 102.9 | 92.1 | 118.7 |
| 2008 | 103.1 | 92.4 | 118.9 |
| 2009 | 102.5 | 91.4 | 118.8 |
| 2010 | 102.2 | 90.9 | 118.7 |
| 2011 | 102.0 | 90.8 | 118.4 |
| 2012 | 101.7 | 90.3 | 118.3 |
| 2013 | 101.6 | 90.1 | 118.4 |
| 2014 | 100.9 | 89.7 | 117.3 |
| 2015 | 100.8 | 89.8 | 116.9 |
| 2016 | 100.4 | 89.3 | 116.8 |
| 2017 | 100.5 | 89.2 | 117.0 |
| 2018 | 100.0 | 88.6 | 116.7 |
| 2019 | 100.5 | 89.0 | 117.2 |
| 2020 | 98.0 | 87.2 | 113.8 |
| 2021 | 99.7 | 88.5 | 116.1 |
| Sources: Common Output Data Repository tables 14-10-0022 and 17-10-0060. | |||
To examine the contribution by gender, the log growth of a particular measure can be written as the weighted sum of the log growth of the measure by gender as follows:
The weight ( ) can then be solved as
Substituting into enables the decomposition of the log growth of a particular variable into the contributions by men and women. Table 3 presents the corresponding decomposition results for the participation rate. As shown, the female participation rate declined by 0.4% per year during the pandemic and declined by 0.2% per year over the period from 2010 to 2019. Women and men contributed almost equally to the decline of the participation rate during these two periods. However, over the long run before the pandemic, from 1981 to 2019, the rising female participation rate led to an increase of 0.2 percentage points per year in the overall participation rate.
Employment rate
The employment rate declined during economic downturns (the early 1980s recession, the early 1990s recession, the 2008/2009 financial crisis and the current economic downturn caused by the COVID-19 pandemic), then recovered gradually after each downturn, as shown in Chart 4. Also, there are no significant differences between male and female employment rates in terms of their patterns over time.

Data table for Chart 4
| All | Male | Female | |
|---|---|---|---|
| percent | |||
| 1981 | 100.0 | 100.0 | 100.0 |
| 1982 | 96.3 | 95.6 | 97.3 |
| 1983 | 95.2 | 94.4 | 96.4 |
| 1984 | 96.0 | 95.5 | 96.7 |
| 1985 | 96.9 | 96.5 | 97.5 |
| 1986 | 97.9 | 97.5 | 98.4 |
| 1987 | 98.7 | 98.5 | 99.0 |
| 1988 | 99.8 | 99.7 | 100.1 |
| 1989 | 100.1 | 99.8 | 100.5 |
| 1990 | 99.4 | 98.9 | 100.2 |
| 1991 | 97.1 | 96.1 | 98.4 |
| 1992 | 96.1 | 94.8 | 97.9 |
| 1993 | 95.9 | 94.8 | 97.4 |
| 1994 | 97.0 | 96.0 | 98.3 |
| 1995 | 98.0 | 97.2 | 99.1 |
| 1996 | 97.8 | 97.1 | 98.9 |
| 1997 | 98.4 | 97.8 | 99.3 |
| 1998 | 99.3 | 98.5 | 100.3 |
| 1999 | 100.0 | 99.3 | 101.0 |
| 2000 | 100.8 | 100.2 | 101.7 |
| 2001 | 100.4 | 99.6 | 101.5 |
| 2002 | 99.9 | 99.0 | 101.2 |
| 2003 | 100.0 | 99.2 | 101.2 |
| 2004 | 100.5 | 99.7 | 101.5 |
| 2005 | 100.9 | 100.2 | 102.0 |
| 2006 | 101.4 | 100.7 | 102.4 |
| 2007 | 101.7 | 100.8 | 102.8 |
| 2008 | 101.5 | 100.6 | 102.8 |
| 2009 | 99.2 | 97.5 | 101.3 |
| 2010 | 99.5 | 98.2 | 101.0 |
| 2011 | 100.1 | 99.1 | 101.3 |
| 2012 | 100.3 | 99.4 | 101.5 |
| 2013 | 100.5 | 99.6 | 101.8 |
| 2014 | 100.7 | 99.7 | 102.0 |
| 2015 | 100.7 | 99.6 | 102.1 |
| 2016 | 100.6 | 99.4 | 102.1 |
| 2017 | 101.3 | 100.4 | 102.5 |
| 2018 | 101.8 | 101.1 | 102.9 |
| 2019 | 102.0 | 101.1 | 103.2 |
| 2020 | 97.9 | 97.4 | 98.7 |
| 2021 | 100.2 | 99.4 | 101.1 |
| Sources: Common Output Data Repository tables 14-10-0022 and 17-10-0060. | |||
During the COVID-19 pandemic, the employment rate declined sharply because of the full or partial closure of many nonessential businesses. As shown in Table 3, the employment rate dropped by 0.9% per year from 2019 to 2021, of which 0.4 percentage points came from the drop in the male employment rate and 0.5 percentage points came from the drop in the female employment rate, suggesting that men and women more or less equally contributed to the drop in the employment rate during the pandemic. However, over the period after the 2009 financial crisis and before the pandemic, Canada’s employment rate increased steadily by 0.3 percentage points per year on average, totally driven by the rise in the female employment rate.
| Log growth | Contribution | ||
|---|---|---|---|
| Male | Female | ||
| percent | percentage point | ||
| Participation rate | |||
| 2019 to 2021 | -0.4 | -0.2 | -0.2 |
| 2010 to 2019 | -0.2 | -0.1 | -0.1 |
| 1981 to 2019 | 0.0 | -0.2 | 0.2 |
| Employment rate | |||
| 2019 to 2021 | -0.9 | -0.4 | -0.5 |
| 2010 to 2019 | 0.3 | 0.0 | 0.3 |
| 1981 to 2019 | 0.1 | 0.0 | 0.0 |
| Work intensity | |||
| 2019 to 2021 | -0.8 | -0.6 | -0.2 |
| 2010 to 2019 | -0.2 | -0.2 | 0.0 |
| 1981 to 2019 | -0.2 | -0.2 | 0.0 |
| Sources: Author’s calculations based on Common Output Data Repository tables 14-10-0022, 17-10-0060 and 14-10-0030. | |||
Work intensity
During the COVID-19 pandemic, many workers had their hours reduced involuntarily, leading to a large decline in work intensity. As shown in Table 3, work intensity dropped by 0.8% per year from 2019 to 2021, of which about three-fourths were attributable to male workers and one-fourth were attributable to female workers.
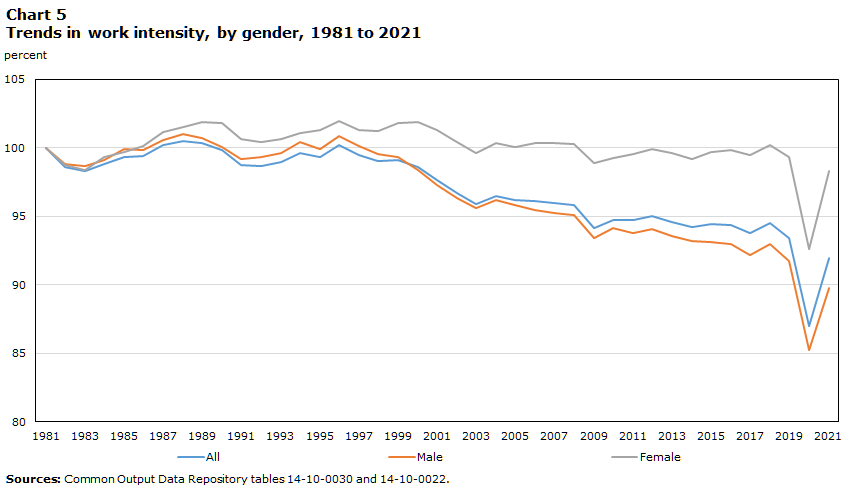
Over the long term, work intensity also trended down, but at a much smaller pace. Over the longer period (1981 to 2019) and the more recent period (2010 to 2019), work intensity declined by 0.2% per year. In both periods, the drop in work intensity was totally driven by male workers, and female work intensity remained almost unchanged, as shown in Chart 5. This finding may be because male workers worked longer hours than female workers. Average hours worked were 41.6 in 1981 and 38.7 in 2021 for male workers aged 15 and older, while they were 33.3 in 1981 and 33.9 in 2021 for female workers aged 15 and older.Note
Data table for Chart 5
| All | Male | Female | |
|---|---|---|---|
| percent | |||
| 1981 | 100.0 | 100.0 | 100.0 |
| 1982 | 98.6 | 98.8 | 98.8 |
| 1983 | 98.3 | 98.7 | 98.4 |
| 1984 | 98.8 | 99.1 | 99.3 |
| 1985 | 99.4 | 99.9 | 99.7 |
| 1986 | 99.4 | 99.9 | 100.1 |
| 1987 | 100.2 | 100.6 | 101.2 |
| 1988 | 100.5 | 101.1 | 101.5 |
| 1989 | 100.4 | 100.7 | 101.9 |
| 1990 | 99.9 | 100.1 | 101.8 |
| 1991 | 98.7 | 99.2 | 100.7 |
| 1992 | 98.7 | 99.3 | 100.4 |
| 1993 | 99.0 | 99.6 | 100.6 |
| 1994 | 99.6 | 100.4 | 101.1 |
| 1995 | 99.4 | 99.9 | 101.3 |
| 1996 | 100.2 | 100.9 | 102.0 |
| 1997 | 99.5 | 100.2 | 101.3 |
| 1998 | 99.1 | 99.6 | 101.2 |
| 1999 | 99.2 | 99.4 | 101.8 |
| 2000 | 98.6 | 98.4 | 101.9 |
| 2001 | 97.7 | 97.3 | 101.3 |
| 2002 | 96.7 | 96.4 | 100.4 |
| 2003 | 95.9 | 95.6 | 99.6 |
| 2004 | 96.5 | 96.2 | 100.4 |
| 2005 | 96.2 | 95.8 | 100.1 |
| 2006 | 96.1 | 95.5 | 100.3 |
| 2007 | 96.0 | 95.3 | 100.4 |
| 2008 | 95.9 | 95.1 | 100.3 |
| 2009 | 94.2 | 93.4 | 98.9 |
| 2010 | 94.8 | 94.1 | 99.3 |
| 2011 | 94.7 | 93.8 | 99.6 |
| 2012 | 95.0 | 94.1 | 99.9 |
| 2013 | 94.6 | 93.5 | 99.6 |
| 2014 | 94.3 | 93.2 | 99.2 |
| 2015 | 94.4 | 93.1 | 99.7 |
| 2016 | 94.4 | 93.0 | 99.8 |
| 2017 | 93.8 | 92.2 | 99.5 |
| 2018 | 94.6 | 93.0 | 100.2 |
| 2019 | 93.4 | 91.7 | 99.3 |
| 2020 | 87.0 | 85.2 | 92.6 |
| 2021 | 92.0 | 89.8 | 98.3 |
| Sources: Common Output Data Repository tables 14-10-0030 and 14-10-0022. | |||
Participation rate, employment rate and work intensity by age group
Different age groups may respond differently to changes in labour market conditions because of the COVID-19 pandemic. In this subsection, changes in the participation rate, the employment rate and work intensity by age group during the pandemic are reviewed and compared with long-term trends. All workers are divided into three age groups: young (aged 15 to 24 years), prime (aged 25 to 54 years) and senior (aged 55 years and older).
Participation rate
As shown in Table 4, the participation rate for the prime age group increased slightly over the pandemic period (2019 to 2021), driven by prime-aged women, while the participation rates for the young and senior age groups were more affected. The participation rate for young people decreased by 0.3% per year during the pandemic, compared with their unchanged participation rate over the period from 2010 to 2019. This drop in the growth of the participation rate was totally driven by young women. For the senior age group, the participation rate dropped by 0.7% per year during the pandemic, compared with an increase of 0.6% per year on average from 1981 to 2019 and 0.8% per year on average from 2010 to 2019. The large increase in the senior participation rate over the longer term was mainly driven by senior women.
Employment rate
The COVID-19 pandemic affected the employment rate of all age groups, especially the young age group. As shown in Table 4, from the period after the financial crisis (2010 to 2019) to the period of the pandemic (2019 to 2021), the employment rate dropped by 7.1 percentage points, from an increase of 4.2% per year to a decrease of 2.9% per year, for the young age group. In comparison, the prime age group saw a drop of 3.9 percentage points, from an increase of 2.4% per year to a decrease of 1.5% per year, and the senior age group saw a drop of 3.8 percentage points, from an increase of 1.4% per year to a decrease of 2.4% per year. In all age groups, men and women more or less contributed equally to the drop in the growth of the employment rate between the two periods.
Work intensity
As expected, Canadian workers have gradually reduced their average working hours since 1981, reflecting an improvement in work–life balance. As shown in Table 4, work intensity declined by 0.6% per year from 1981 to 2019 for the young age group, mainly driven by young women. This decrease is much larger than the drop of 0.1% per year for the prime age group and the drop of 0.2% per year for the senior group. In more recent years (2010 to 2019), the work intensity of all age groups declined at a similar pace.
During the pandemic, the decline in work intensity accelerated because of a large involuntary reduction of working hours, especially for the prime and senior age groups. Work intensity dropped by 0.3% per year for the young age group, 0.9% for the prime group and 1.0% for the senior group. Such rate drops were mainly driven by a decline in hours worked for male workers.
| Log growth | Contribution | ||
|---|---|---|---|
| Male | Female | ||
| percent | percentage point | ||
| During the pandemic (2019 to 2021) | |||
| Participation rate | |||
| Aged 15 to 24 years | -0.3 | 0.0 | -0.3 |
| Aged 25 to 54 years | 0.1 | 0.0 | 0.1 |
| Aged 55 years and older | -0.7 | -0.3 | -0.4 |
| Employment rate | |||
| Aged 15 to 24 years | -2.9 | -1.3 | -1.6 |
| Aged 25 to 54 years | -1.5 | -0.7 | -0.7 |
| Aged 55 years and older | -2.4 | -1.1 | -1.3 |
| Work intensity | |||
| Aged 15 to 24 years | -0.3 | -0.3 | 0.0 |
| Aged 25 to 54 years | -0.9 | -0.6 | -0.3 |
| Aged 55 years and older | -1.0 | -0.7 | -0.2 |
| After the financial crisis (2010 to 2019) | |||
| Participation rate | |||
| Aged 15 to 24 years | 0.0 | 0.0 | 0.0 |
| Aged 25 to 54 years | 0.1 | 0.0 | 0.1 |
| Aged 55 years and older | 0.8 | 0.2 | 0.6 |
| Employment rate | |||
| Aged 15 to 24 years | 4.2 | 2.7 | 1.5 |
| Aged 25 to 54 years | 2.4 | 1.4 | 1.0 |
| Aged 55 years and older | 1.4 | 1.0 | 0.4 |
| Work intensity | |||
| Aged 15 to 24 years | -0.1 | -0.1 | 0.0 |
| Aged 25 to 54 years | -0.1 | -0.1 | 0.0 |
| Aged 55 years and older | -0.2 | -0.2 | 0.0 |
| Before the pandemic (1981 to 2019) | |||
| Participation rate | |||
| Aged 15 to 24 years | -0.2 | -0.2 | 0.0 |
| Aged 25 to 54 years | 0.2 | -0.1 | 0.3 |
| Aged 55 years and older | 0.6 | 0.0 | 0.6 |
| Employment rate | |||
| Aged 15 to 24 years | 2.0 | 0.7 | 1.3 |
| Aged 25 to 54 years | 1.3 | 0.2 | 1.1 |
| Aged 55 years and older | -0.9 | -0.3 | -0.7 |
| Work intensity | |||
| Aged 15 to 24 years | -0.6 | -0.2 | -0.4 |
| Aged 25 to 54 years | -0.1 | -0.1 | 0.0 |
| Aged 55 years and older | -0.2 | -0.2 | 0.0 |
| Sources: Author’s calculations based on Common Output Data Repository tables 14-10-0022, 17-10-0060 and 14-10-0030. | |||
Conclusion
Consistent with the findings in the literature, improvement in productivity is the most important source of Canada’s GDP per capita growth. However, the wedge between GDP per capita growth and productivity growth is not negligible. This paper shows that in Canada, 92.5% of GDP per capita growth over the period from 1981 to 2019 came from hourly labour productivity growth that was partly offset by a 14.5% decline in work intensity, and 22% came from growth of the wide measure of employment during the same period.
The COVID-19 pandemic has significantly affected economic activities in Canada. During the pandemic, GDP per capita and hourly labour productivity moved in opposite directions; this is different from their relationship in the long run. GDP per capita in Canada dropped by 1.3% per year from 2019 to 2021, and the drop was driven by decreases in work intensity, the employment rate and the participation rate. The drops in the participation rate and the employment rate during the pandemic were largely driven by the young and senior age groups, and the drop in work intensity was mainly driven by male workers. If all three ratios had not been interrupted by the pandemic and had kept their momentum from 2010 onward (i.e., the participation rate decreased by 0.2% per year instead of by 0.4% per year, the employment rate increased by 0.3% per year instead of dropping by 0.9% per year and work intensity decreased by 0.2% per year instead of by 0.8% per year), GDP per capita in Canada could have been 4% higher than it actually was in 2021.
References
Beaudry, P., & Lemieux, T. (1999). Evolution of the female labour force participation rate in Canada, 1976-1994: A cohort analysis. In A. Sharpe & L. Grignon (Eds.), Symposium on Canadian Labour Force Participation in the 1990s, Special Issue of Canadian Business Economics, 7(2): 57–70.
Easterlin, R. A. (2000). The worldwide standard of living since 1800. Journal of Economic Perspectives, 14(1), 7–26. https://doi.org/10.1257/jep.14.1.7
Euwals, R., Knoef, M., & van Vuuren, D. (2011). The trend in female labour force participation: What can be expected for the future? Empirical Economics, 40(3), 729–753. https://doi.org/10.1007/s00181-010-0364-9
Jaumotte, F. (2003). Female labour force participation: Past trends and main determinants in OECD countries (OECD Economics Department Working Papers, No. 376). OECD Publishing.
Krugman, P. (1990). The age of diminishing expectations. The MIT Press.
Maddison, A. (1983). A comparison of levels of GDP per capita in developed and developing countries, 1700-1980. The Journal of Economic History, 43(1), 27–41.
Marattin, L., & Salotti, S. (2011). Productivity and per capita GDP growth: The role of the forgotten factors. Economic Modelling, 28(3), 1219–1225. https://doi.org/10.1016/j.econmod.2011.01.004
Tang, J., & Wang, W. (2004). Sources of aggregate labour productivity growth in Canada and the United States. Canada Journal of Economics, 37(2), 421–444. https://doi.org/10.1111/j.0008-4085.2004.00009.x
- Date modified: