
Economic and Social Reports
The weekly earnings of Canadian-born individuals in designated visible minority and White categories in the mid-2010s
DOI: https://doi.org/10.25318/36280001202200100004-eng
Skip to text
Text begins
Abstract
Using data from the 2016 Census, this study compares the weekly earnings of individuals in designated visible minority and White categories, as defined in the Employment Equity Act. This study focuses on Canadian-born individuals aged 25 to 44 who had paid employment in 2015. Net of sociodemographic and job characteristics, the weekly earnings of men in 4 of the 10 designated visible minority categories were significantly lower than those of White people, with the largest differences observed among Black and Latin American people. The weekly earnings of men in five other designated visible minority categories were not significantly different from those of White people, while the weekly earnings of men in one category (South Asian) were slightly higher. Among women, weekly earnings were significantly higher among Chinese, Southeast Asian, Filipino and South Asian people than those who were White, with the largest difference observed among the Chinese. The weekly earnings of women in the six other designated visible minority categories were not significantly different from those of White people. Educational attainment, full- and part-time status and occupation accounted for substantial shares of the explained portion of these earning gaps. Among men and women in most designated visible minority categories, differences in weekly earnings relative to White people were about the same in 2015 as they were in 2005. However, the difference in weekly earnings between Black and White men widened by 4% after sociodemographic and job characteristics were taken into account.
Authors
Theresa Qiu and Grant Schellenberg are with the Social Analysis and Modelling Division, Analytical Studies and Modelling Branch at Statistics Canada.
Introduction
In Canada, as in other countries, efforts are underway to recognize and address racial injustices and discrimination experienced by racialized communities, Indigenous people and vulnerable populations (Library of Parliament, 2020). As highlighted in Building a Foundation for Change: Canada’s Anti-Racism Strategy, the Government of Canada is committed to “…removing barriers and promoting a country where every person is able to fully participate and have an equal opportunity to succeed” (Canadian Heritage, 2019). The strategy highlights the importance of data and evidence as tools for identifying and addressing inequalities.
This paper fits within this context. It updates Canadian research on the average weekly earnings received by workers across designated visible minority and White categories, as defined in the Employment Equity Act. Current evidence on these differences is quite dated. Articles by Hou and Coulombe (2010) and Pendakur and Pendakur (2011) are among the most recent comprehensive analyses, but both use data from the 2006 Census. Much has changed since then, and an update is warranted. While 2016 falls short of a “current” snapshot, it does update the available information by 10 years and sets the stage for future updates using the 2021 Census.
This paper addresses three sets of research questions. First, in 2015, were there significant differences in the estimated weekly earnings of individuals in designated visible minority categories relative to White people? Among which designated visible minority categories were differences in weekly earnings largest? Were these differences similar among women and men? Second, to what extent did sociodemographic and employment characteristics account for differences in average weekly earnings across designated visible minority and White categories? And third, were differences in average weekly earnings narrower, wider or about the same in 2015 as in 2005?
Following a short literature review, Section 3 presents the data sources, sample selection and variables used in this analysis. Differences in the sociodemographic compositional characteristics across categories of interest are underscored. In Section 4, estimates of the weekly earnings of individuals in designated visible minority and White categories are presented, incrementally taking into account sociodemographic and employment characteristics. The relative importance of these characteristics in explaining earnings differences is further assessed using a decomposition analysis, followed by a comparison of the size of earnings differences observed in 2005 and 2015. Section 5 draws conclusions and suggests directions for further research.
Literature review
The labour market outcomes of individuals in different designated visible minority categories in Canada have long been of interest in public policy research. Research on the economic outcomes of immigrants from different backgrounds and source countries is extensive and continues to grow. A much smaller body of research focuses on the outcomes of individuals in designated visible minority categories who were born in Canada. Some of the latter studies compare the outcomes of individuals in the second generation—that is, individuals born in Canada to one or more immigrant parents—to individuals in the first generation—that is, individuals who immigrated to Canada. Underlying these studies are concerns about intergenerational persistence of disadvantage that could arise if the children of immigrants “…experience similar impediments to social and economic integration as their parents…” (Palameta, 2007). This has generally not been the case, as the educational and labour market outcomes of the second generation have generally surpassed those of the first generation (Aydemir and Sweetman, 2007; Skuterud, 2010; Picot & Hou, 2010, 2011; Chen & Hou, 2019).Note
A second point of comparison is between second generation individuals in designated visible minority categories and individuals in the third generation or moreNote who are White. The number of second generation Canadians in designated visible minority categories increased almost fourfold, from approximately 552,000 to 2,100,000 from 2006 to 2016.Note This reflects the changing source country composition of immigrants to Canada since the late 1970s and underscores the increasing diversity of the Canadian-born population. As Pendakur and Pendakur (2011) argue, second generation individuals in these categories “...are educated and socialized in Canada, and speak either one or both official languages accentlessly. Under any reasonable scenario, they should not therefore be subject to an earnings penalty based on any of the traditional reasons why an immigrant may face a penalty” (p. 305). A number of studies have investigated this issue (Pendakur & Pendakur, 2002; Reitz et al., 2009; Hou & Coulombe, 2010; Pendakur & Pendakur, 2011; Chen & Hou, 2019). For example, using census data from various years, Pendakur and Pendakur (2011) found that the earnings gaps between Canadian-born individuals in designated visible minority and White categories observed in the 1990s had not diminished by 2006, and that earnings gaps remained particularly large among South Asian and Black people. Similarly, Hou and Coulombe (2010) examined earnings gaps in the public and private sectors using 2006 Census data. They found that in the public sector, “visible minorities and White [people] in general receive similar pay for similar jobs,” but that “…in the private sector visible minority men and Black women earn significantly less than observationally comparable White [people]” (p. 39). In addition, they found that earnings gaps were larger among Black people than among those who were Chinese and South Asian, and that earnings gaps differed between men and women. Overall, these studies document heterogeneity in the characteristics and employment outcomes of Canadian-born individuals across ethnic-origin groups. This analysis builds on these by using a similar research design and many of the same variables.
Data and concepts
Data
The analysis uses data from the 2016 Census of Population. About one in four Canadian households completed the 2016 Census Questionnaire (long), providing information on a broad range of demographic, social and economic characteristics. The large number of observations and richness of the census data make them well-suited for studying population subgroups. The 2006 Census is also used, allowing differences in weekly earnings to be compared over the 10 years from 2005 to 2015.Note
The analysis focuses on individuals meeting the following selection criteria: they were born in Canada, were aged 25 to 44 at the time of the 2016 Census, had at least one week of paid employment and $500 in earnings the previous year, and were not self-employed that year. It is these criteria that will now be discussed.
Sample selection
Consistent with Hou and Coulombe (2010) and Pendakur and Pendakur (2010), this analysis is restricted to individuals who were born in Canada. Immigrants are excluded to remove immigration-related issues from earnings comparisons drawn between individuals in designated visible minority and White categories. There is a large body of published research documenting the roles played by factors such as foreign credential recognition, foreign work experience and knowledge of official languages in the earnings of immigrants in Canada, most of whom are in designated visible minority categories (Hou, Crossman & Picot, 2020; Hou & Bonikowska, 2015; Boyd & Cao, 2009; Boyd & Schellenberg, 2007; Picot & Sweetman, 2005; Pendakur & Pendakur, 1998; Basran, 1998). Such factors are not directly relevant for individuals born in Canada, whose lifetime experiences in school, work and the community were predominantly acquired domestically. This provides a more even basis for comparing weekly earnings across categories of interest with the effects of immigration largely removed.
The implication of this sample selection criterion should not be underestimated. Previously published tables from the 2016 Census show that among individuals aged 25 to 44 (more on this below), 80% of those across all designated visible minority categories were in the first generation—for the most part, immigrants to Canada; 18% were in the second generation—individuals born in Canada to at least one immigrant parent. Less than 2% were in the third or higher generations—individuals born in Canada to two Canadian-born parents. By contrast, less than 10% of “non-visible minorities” were in the first generation and 75% were in the third or higher generations. Restricting the analysis to individuals born in Canada therefore excludes most individuals in the visible minority population. The shares excluded range from 54% of Japanese people to 96% of West Asian people. This underscores the degree to which ethnocultural diversity and immigration currently overlap in Canada. Furthermore, the vast majority of Canadian-born individuals in most designated visible minority categories were in the second generation, rather than in the third or higher generations; that is, they had at least one immigrant parent. One implication is that the contexts in which these individuals grew up were likely shaped by the settlement experiences of their immigrant parents. Immigration-related effects of this sort may still be reflected in weekly earnings.
| First generation | Second generation | Third generation or more | |
|---|---|---|---|
| percent | |||
| Total visible minority population | 80.1 | 18.3 | 1.6 |
| Chinese | 77.4 | 21.1 | 1.5 |
| Korean | 86.4 | 13.2 | 0.4 |
| Japanese | 54.1 | 19.8 | 26.1 |
| Southeast Asian | 76.8 | 22.7 | 0.4 |
| Filipino | 87.5 | 12.3 | 0.2 |
| South Asian | 82.0 | 17.5 | 0.4 |
| West Asian | 96.2 | 3.7 | 0.1 |
| Arab | 89.8 | 10.0 | 0.2 |
| Latin American | 87.7 | 12.0 | 0.3 |
| Black | 68.9 | 26.4 | 4.6 |
| Not a visible minorityTable 1 Note 1 | 9.7 | 15.0 | 75.3 |
|
|||
Among Canadian-born individuals, the population for this study is further selected on the basis of age. Both Hou and Coulombe (2010) and Pendakur and Pendakur (2011) limit their analyses to individuals aged 25 to 64 to exclude effects introduced by individuals who are mainly students or retirees. Sample selection for this study is somewhat narrower, focusing on individuals aged 25 to 44. This is done to improve the comparability between the designated visible minority and White categories. Chart 1 is restricted to individuals aged 25 to 64 and shows the shares of individuals in more detailed age groups. While 27% of White people were aged 25 to 34, this was the case for over 50% of individuals in most designated visible minority categories, and for over 70% of Latin American and Southeast Asian people. By contrast, 10% or less of individuals in most designated visible minority categories were aged 45 to 64, compared with almost 50% of White people. Restricting the study population to individuals aged 25 to 44 provides a more even basis for comparison. Age differences within this range are documented below.

Data table for Chart 1
| Age 25 to 34 | Age 35 to 44 | Age 45 to 64 | |
|---|---|---|---|
| percent | |||
| White | 26.6 | 24.4 | 49.0 |
| Japanese | 31.2 | 23.9 | 44.9 |
| Black | 50.4 | 32.8 | 16.8 |
| Chinese | 53.0 | 25.7 | 21.4 |
| Korean | 54.2 | 39.7 | 6.1 |
| Filipino | 58.1 | 37.8 | 4.1 |
| South Asian | 59.9 | 33.1 | 7.0 |
| Arab or West Asian | 63.4 | 26.5 | 10.1 |
| Latin American |
71.1 | 26.0 | 2.9 |
| Southeast Asian |
83.0 | 14.1 | 2.9 |
|
Note: Sample includes people aged 25 to 64 who were born in Canada, who had at least one week of paid employment and $500 in earnings in 2015, and who were not self-employed that year. Source: Statistics Canada, 2016 Census of Population. |
|||
The population for this study is further restricted to individuals who had some minimal involvement in paid employment during the year prior to the census, as indicated by at least one week of paid employment and total annual wages and salaries of $500 or more. In short, weekly earnings are conditional on employment. The study is further restricted to individuals who did not receive any self-employment income during the year prior to the census, eliminating issues related to business operations, accounting and taxation.
Designated visible minority categories
Consistent with previous Canadian literature on this topic, this analysis is structured around the “designated visible minority question” included in the Census of Population. As stated in 2016 Census documentation:
“‘Visible minority’ refers to whether a person belongs to a visible minority group as defined by the Employment Equity Act and, if so, the visible minority group to which the person belongs. The Employment Equity Act defines visible minorities as ‘persons, other than Aboriginal peoples, who are non-Caucasian in race or non-white in colour’” (Statistics Canada 2017).
Twelve response categories are provided for this question. These include
- White
- South Asian (e.g., East Indian, Pakistani, Sri Lankan)
- Chinese
- Black
- Filipino
- Arab
- Latin American
- Southeast Asian (e.g., Vietnamese, Cambodian, Laotian, Thai)
- West Asian (e.g., Iranian, Afghan)
- Korean
- Japanese
- other visible minorities.Note
For this analysis, these categories were treated separately to the extent the data permitted. However, it was necessary to combine the Arab and West Asian categories to obtain sample sizes sufficient to support robust statistical estimates. Overall, approaches to, and definitions of, identity groups continue to be the subject of debate and discussion. The approach above is used for this study as it allows us to build on previous research, provides a common basis for comparison over time, and is one of the few variables currently available for research across ethnocultural groups in Canada. In this paper, the term “categories of interest” refers to the 11 categories used, including “White,” while the term “designated visible minority categories” refers to individuals in the 10 categories aside from White.
Census respondents reporting an Indigenous ethnic origin are excluded from this analysis. Specific histories and circumstances pertaining to Indigenous people and established working relationships between Statistics Canada and Crown-Indigenous Relations and Northern Affairs Canada, Indigenous Services Canada, and national Indigenous organizations necessitate a separate analysis.
Weekly earnings
The outcome of interest in this study is the difference in average weekly earnings received by individuals in designated visible minority and White categories. Average weekly earnings are calculated as total wages and salaries received in 2015 divided by the number of weeks worked during that year.Note The measurement of earnings on a weekly basis, combined with a mostly full-time or part-time employment variable accounts for some, but not all, variation in labour supply. One limitation of the average weekly earnings approach is that any disadvantage individuals in some designated visible minority categories may experience finding full-year employment is not captured. Among men, the average number of weeks employed in 2015 ranged from 44.2 among Black men to 47.1 among Chinese men; among women, average weeks employed ranged from 43.1 among Arab and West Asian women to 45.3 weeks among Chinese women (Table 2).
The average weekly wages and salaries of men and women in the White and designated visible minority categories are shown in Table 2. There is considerable variation across categories. Among men, average weekly earnings ranged from $1160 (in 2016 dollars) among Latin American men to $1750 among Japanese men–a difference of $590. White men had average weekly earnings of $1,530, which was significantly higher than the average weekly earnings of men in 6 of the 10 designated visible minority categories, the exceptions being Chinese, South Asian, Japanese and Korean men.
Among women, average weekly earnings ranged from $1000 among Latin American women to $1,450 among Korean women–a difference of $450. White women had average earnings of $1,120, which was significantly higher than the averages among women in 2 of the 10 designated visible minority categories (Latin American and Black) and significantly lower than the averages in 6 other categories (Chinese, Korean, Japanese, South Asian, Filipino and Other visible minorities).
| Average weeks employed 2015 | Average weekly earnings | Average earnings relative to White category | |
|---|---|---|---|
| number of weeks | dollars | percent | |
| Men | |||
| White | 46.2 | 1,530 | 100 |
| Chinese | 47.1 | 1,580 | 103 |
| Korean | 46.5 | 1,720 | 112 |
| Japanese | 46.1 | 1,750 | 114 |
| Southeast Asian | 45.2 | 1,300 | 85 |
| Filipino | 46.8 | 1,290 | 84 |
| South Asian | 46.0 | 1,680 | 110 |
| Arab or West Asian | 45.0 | 1,490 | 97 |
| Latin American | 44.6 | 1,160 | 76 |
| Black | 44.2 | 1,210 | 79 |
| Other visible minorities | 45.8 | 1,300 | 85 |
| Women | |||
| White | 44.7 | 1,120 | 100 |
| Chinese | 45.3 | 1,440 | 129 |
| Korean | 44.4 | 1,450 | 130 |
| Japanese | 44.7 | 1,320 | 118 |
| Southeast Asian | 44.2 | 1,100 | 98 |
| Filipino | 44.6 | 1,260 | 113 |
| South Asian | 44.0 | 1,330 | 119 |
| Arab or West Asian | 43.1 | 1,120 | 101 |
| Black | 43.2 | 1,080 | 96 |
| Latin American | 43.5 | 1,000 | 90 |
| Other visible minorities | 44.3 | 1,170 | 104 |
Source: Statistics Canada, 2016 Census of Population. |
|||
Compositional characteristics
The weekly earnings comparisons above do not take into account any differences in the sociodemographic or employment characteristics of individuals in different categories. These differences are considerable and relevant to earnings.
While the study population is limited to individuals aged 25 to 44, age differences remain across the categories of interest. The average age of White people was just over 34 years while the average ages of most designated visible minority groups were younger, at 31 to 33 years (Table 3). Southeast Asian people were youngest, at just under 30 years, on average. Age is expected to be positively correlated with weekly earnings (although at a declining rate), reflecting factors such as work experience and job tenure. The age and age-squared of individuals are included in the analysis below.
Regarding place of residence, some 60% or more of individuals in most designated visible minority categories resided in Montréal, Toronto or Vancouver compared with around 27% of White people. These three census metropolitan areas (CMAs) have long been gateways for immigrants entering Canada and it appears that many of their Canadian-born children have remained there. Only about 1 in 20 individuals in designated visible minority categories lived in smaller cities, towns and rural areas that are not part of a CMA, compared with about 1 in 3 White people. Weekly earnings are expected to be higher in large urban centres reflecting cost of living, industrial composition and other factors. A CMA place of residence variable comprised of six categories is included in this analysis.Note In addition, a set of variables capturing province or territory of residence is included, with earnings expected to be higher in the oil-producing provinces of Alberta, Saskatchewan and Newfoundland and Labrador than in non-oil-producing provinces.
In addition to being younger and more urban, individuals in designated visible minority categories were more likely than White people to live with their parents and less likely to have started families of their own. In the census, individuals are recorded as a “child in a census family” if they (i) have never been married or in a common-law union, (ii) have never had children of their own and (iii) reside with one or both of their parents. This is a technical definition for delineating household composition and does not imply dependency. While 7% of women and 12% of men in the White category were children in a census family, this was the case for over 20% of women and over 30% of men in most designated visible minority categories. Conversely, individuals in many designated visible minority categories were less likely than White people to be “married with children.” The younger age profiles of designated visible minority groups, their longer durations of postsecondary study, and their concentration in Canada’s most expensive housing markets are likely contributing factors. Cultural factors may also play role. Family composition is expected to be correlated with weekly earnings in ways that vary between women and men. A family status variable comprised of six categories is included in the analysis.Note
In terms of human capital, far larger shares of people in designated visible minority categories had a university degree at the bachelor’s level or higher than those in the White category. Specifically, 24% of White men had a university degree compared with over 40% of Arab and West Asian, Japanese, and South Asian men and over 60% of Korean and Chinese men. Black and Latin American men were the only groups with rates of university completion lower than that of White men. The same patterns are observed among women. While 38% of White women had a university degree, this was the case for around 60% of Japanese and South Asian women and over 70% of Korean and Chinese women. Again, Black and Latin American women were the only groups with rates of university completion lower than White women. A variable comprised of five educational groups is included in this analysis and is expected to be strongly correlated with earnings.Note
Considering language abilities, census participants’ reported ability to conduct a conversation in both English and French—i.e., being bilingual—is included. Just over one-quarter of White men and women reported being bilingual. The shares were somewhat higher among men and women in designated visible minority categories, such as Arab and West Asian, Southeast Asian, Latin American, and Black, and lower among Korean, Japanese, Filipino, Chinese and South Asian categories. Reported ability to conduct a conversation in either, neither or both official languages is included in the analysis, with bilingualism expected to be positively correlated with weekly earnings.
In addition to sociodemographic characteristics, two employment-related characteristics are included in the analysis. The first is whether individuals worked mostly full time or part time during the year. The shares of men who worked mostly part time ranged from 6% among White men to 15% among Black men. Among women, the shares working mostly part time ranged from almost 14% among Chinese women to 22% among Arab and West Asian and Latin American women, with White women in the middle of the range. The distributions of individuals across occupations have implications for weekly earnings, and a set of 10 occupational categories are included. Differences are evident across categories. The share of men employed in sales and service occupations, for example, ranged from 15% among Japanese men to almost 29% among Black men.
Overall, the compositional characteristics of individuals across the categories of interest vary considerably. Some of these differences, such as the shares of individuals residing in Montréal, Toronto and Vancouver, reflect immigrant settlement and the experiences of the second generation. In addition, differences such as age, family status (e.g., neither married nor with children) and co-residence with parents can be viewed in terms of life-course transitions and moving past “markers” such as completing school, leaving home and starting a family. The characteristics and experiences of individuals in designated visible minority and White categories are different in this respect. So too are their employment characteristics, as measured by full-time and part-time status and occupation.
| Mean age | Residing in Montréal, Toronto or Vancouver | Residing outside CMAs | Recorded as "child in census family" | Married or common-law with children | With bachelor's degree or higher | Working mostly part time in 2015 | In sales or service job in 2015 | |
|---|---|---|---|---|---|---|---|---|
| years | percent | |||||||
| Men | ||||||||
| White | 34 | 26 | 32 | 12 | 43 | 24 | 6 | 16 |
| Chinese | 32 | 71 | 3 | 34 | 23 | 61 | 9 | 17 |
| Korean | 33 | 76 | 5 | 27 | 27 | 65 | 8 | 20 |
| Japanese | 34 | 52 | 14 | 18 | 31 | 45 | 8 | 15 |
| Southeast Asian | 30 | 59 | 5 | 41 | 15 | 36 | 13 | 24 |
| Filipino | 33 | 60 | 5 | 34 | 31 | 29 | 11 | 25 |
| South Asian | 33 | 71 | 4 | 39 | 29 | 49 | 9 | 20 |
| Arab or West Asian | 32 | 50 | 4 | 30 | 29 | 42 | 10 | 23 |
| Latin American | 31 | 67 | 5 | 35 | 24 | 17 | 13 | 27 |
| Black | 33 | 66 | 6 | 31 | 26 | 20 | 15 | 29 |
| Other visible minorities | 32 | 67 | 5 | 32 | 25 | 35 | 11 | 23 |
| Women | ||||||||
| White | 34 | 27 | 31 | 7 | 46 | 38 | 18 | 26 |
| Chinese | 32 | 72 | 3 | 29 | 27 | 73 | 14 | 16 |
| Korean | 33 | 72 | 5 | 22 | 32 | 71 | 18 | 18 |
| Japanese | 34 | 58 | 11 | 13 | 34 | 59 | 18 | 18 |
| Southeast Asian | 30 | 60 | 4 | 31 | 20 | 47 | 18 | 28 |
| Filipino | 33 | 59 | 4 | 23 | 37 | 47 | 17 | 22 |
| South Asian | 32 | 72 | 4 | 33 | 30 | 62 | 17 | 19 |
| Arab or West Asian | 32 | 50 | 5 | 29 | 33 | 54 | 22 | 26 |
| Latin American | 31 | 69 | 5 | 27 | 27 | 28 | 22 | 32 |
| Black | 33 | 70 | 5 | 24 | 22 | 36 | 21 | 31 |
| Other visible minorities | 32 | 69 | 4 | 26 | 25 | 51 | 18 | 23 |
Source: Statistics Canada, 2016 Census of Population. |
||||||||
Multivariate results
A series of multivariate regression models were estimated, with the natural log of weekly earnings regressed against the sociodemographic and employment characteristics presented above. Of central interest are the weekly earnings of individuals in each designated visible minority category relative to that of White people, after other characteristics are taken into account. The coefficients on log weekly earnings can generally be interpreted as the percentage difference in earnings between an individual with a specified characteristic relative to a reference group. Model 1 includes sociodemographic characteristics and Model 2 includes employment characteristics. This strategy offers flexibility in the approach to interpreting earnings differentials. Model 1 removes the effects of age, family composition, place of residence, education and bilingualism with the intent of tightening the comparisons to “observationally equivalent” individuals. Model 2 additionally removes the effects of full-time and part-time employment status and occupation. In short, Model 1 compares people with the same personal characteristics and asks if their weekly earnings are significantly different, while Model 2 compares people with the same personal characteristics employed in the same broad occupations, working similar hours (mostly full time or part time) and asks the same question. Hou and Coulombe (2010) outline the rationale for this:
“When controls for work characteristics [are] included, any earnings gaps experienced by visible minorities [are] manifested only through differential earnings structures within jobs. The corresponding assumption is that occupation allocation and working time are not differentially constrained across groups... If discrimination in part involves sorting into low-paying occupations and part-time jobs, then controlling for [these] work characteristics would underestimate the overall disadvantage of visible minorities” (p. 33).
The regression results for the sociodemographic and employment characteristics are presented in Appendix Table 1. Models were run separately for women and men, consistent with a gender-based analysis approach. Results from the models are consistent with expectations. Considering the full set of results in Model 2, weekly earnings were positively correlated with age, educational attainment and bilingualism, and were generally higher in Toronto, Vancouver and Montréal than in areas outside of Canada’s 35 CMAs. Compared with Ontario, weekly earnings were higher in the oil-producing provinces of Alberta, Saskatchewan and Newfoundland and Labrador and lower in Quebec and the Maritime provinces.
Weekly earnings varied significantly across family composition in ways that differed between women and men. For example, among married and common-law men, weekly earnings were 12% higher among those with children than those without children, while conversely, among married and common-law women, weekly earnings were 4% lower among those with children than those without. Weekly earnings were also relatively low among individuals classified as children in census families, with this correlation far stronger among men than women. The direction of this latter relationship may run either way. That is, low earnings may leave individuals with little choice but to live with parents, or alternatively, the financial support derived from living with parents may reduce the financial imperatives to pursue higher earnings. Establishing the direction of causation is beyond the scope of this paper.
In terms of employment characteristics, weekly earnings were about 70% higher among men employed mostly full time than those employed mostly part time. Among women, the difference was about 60%. Across occupations, estimates of weekly earnings were consistent with expectations—for example, being significantly and substantially lower in sales and in personal and customer information services occupations than in management occupations.
Results—Designated visible minority categories
In addition to the sociodemographic and employment characteristics above, the models included a set of variables identifying each of the designated visible minority categories, as well as the White category included as the reference group. The estimated differences in weekly earnings between men and women in these categories are shown in Table 4. In addition, charts 2 and 3 present the results graphically, along with the unadjusted comparisons between categories—that is, with no sociodemographic or employment characteristics taken into account.
Focusing first on men, the unadjusted weekly earnings of Japanese, Korean, Chinese and South Asian men were not significantly different than those who were White (Chart 2). These differences remained statistically non-significant when sociodemographics were taken into account (Table 4, Model 1 and Chart 2), and largely remained so when employment characteristics were taken into account as well.Note The unadjusted weekly earnings of Arab and West Asian men were 8% below those of White men, but this difference diminished and became non-significant when sociodemographic characteristics were taken into account. Similarly, the -24% difference in the unadjusted weekly earnings of Southeast Asian and White men declined to -4% when sociodemographic characteristics were added, and became non-significant when employment characteristics were further added (Chart 2). Turning to other categories, the unadjusted weekly earnings of Black and Latin American men were far lower than those of White men, at -33% and 32% respectively. These differences remained large and statistically significant, at -20% and -13% respectively, when sociodemographic characteristics were taken into account and remained so, at -11% and -9%, when employment characteristics were considered as well. The earnings of Filipino and men in “Other” designated visible minority categories were also significantly lower than the earnings of White men in the models.

Data table for Chart 2
| Unadjusted | Accounting for sociodemographic characteristics | Accounting for sociodemographic and employment characteristics | |
|---|---|---|---|
| percent | |||
| Japanese | 0.05 | -0.03 | -0.03 |
| Korean | 0.03 | -0.03 | -0.01 |
| Chinese | 0.01 | -0.01 | 0.00 |
| South Asian | 0.00 | 0.01 | 0.02 |
| Arab or West Asian | -0.08 | -0.02 | -0.01 |
| Filipino | -0.13 | -0.09 | -0.05 |
| Other visible minorities | -0.15 | -0.09 | -0.06 |
| Southeast Asian | -0.24 | -0.04 | -0.02 |
| Latin American | -0.32 | -0.13 | -0.09 |
| Black | -0.33 | -0.20 | -0.11 |
|
Note: Sample includes people aged 25 to 44 who were born in Canada, who had at least one week of paid employment and $500 in earnings in 2015, and who were not self-employed that year. Source: Statistics Canada, 2016 Census of Population. |
|||
Turning to women, the unadjusted weekly earnings of Korean and Japanese women were higher than those of White women by margins of 20% and 12%, respectively (Chart 3). These differences diminished and became non-significant when sociodemographic characteristics were taken into account. Unadjusted weekly earnings were also significantly higher among Chinese, South Asian and Filipino women than among White women, and remained so when sociodemographic characteristics were taken into account (at 5% to 11%) and when employment characteristics were taken into account as well (at 3% to 8%). Weekly earnings were also higher among Southeast Asian women than White women (by 4%) in Models 2 and 3. Both Latin American and Black women had unadjusted weekly earnings that were significantly lower than those of White women, at -14% and -8% respectively. When sociodemographic characteristics were taken into account, the difference for Latin American women diminished and become non-significant, while the difference for Black women diminished to -5% but remained significant. When employment characteristics were also taken into account, the difference between Black and White women became non-significant.
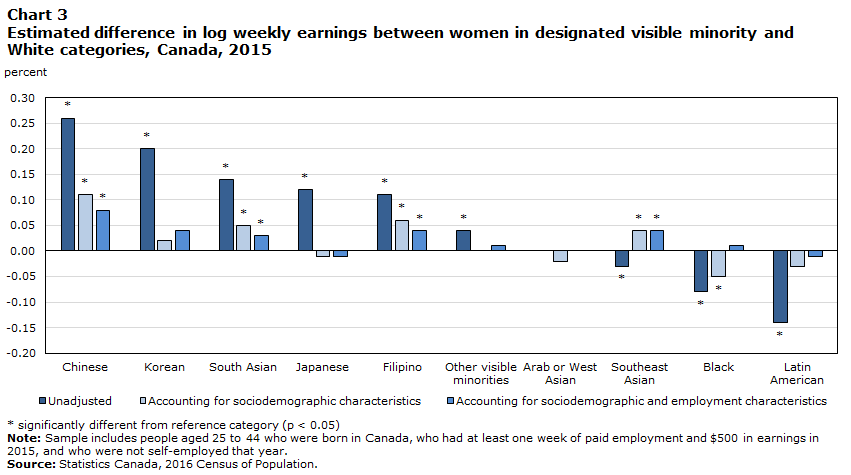
Data table for Chart 3
| Unadjusted | Accounting for sociodemographic characteristics | Accounting for sociodemographic and employment characteristics | |
|---|---|---|---|
| percent | |||
| Chinese | 0.26 | 0.11 | 0.08 |
| Korean | 0.20 | 0.02 | 0.04 |
| South Asian | 0.14 | 0.05 | 0.03 |
| Japanese | 0.12 | -0.01 | -0.01 |
| Filipino | 0.11 | 0.06 | 0.04 |
| Other visible minorities | 0.04 | 0.00 | 0.01 |
| Arab or West Asian | 0.00 | -0.02 | 0.00 |
| Southeast Asian | -0.03 | 0.04 | 0.04 |
| Black | -0.08 | -0.05 | 0.01 |
| Latin American | -0.14 | -0.03 | -0.01 |
|
Note: Sample includes people aged 25 to 44 who were born in Canada, who had at least one week of paid employment and $500 in earnings in 2015, and who were not self-employed that year. Source: Statistics Canada, 2016 Census of Population. |
|||
| Model 1 Sociodemographic characteristics |
Model 2 Sociodemographic and employment characteristics |
|
|---|---|---|
| log points | ||
| Men | ||
| White (reference group) | Note ...: not applicable | Note ...: not applicable |
| Chinese | -0.01 | 0.00 |
| Korean | -0.03 | -0.01 |
| Japanese | -0.03 | -0.03 |
| Southeast Asian | -0.04Note * | -0.02 |
| Filipino | -0.09Note *** | -0.05Note *** |
| South Asian | 0.01 | 0.02Note ** |
| Arab or West Asian | -0.02 | -0.01 |
| Latin American | -0.13Note *** | -0.09Note *** |
| Black | -0.20Note *** | -0.11Note *** |
| Other visible minorities | -0.09Note *** | -0.06Note *** |
| Women | ||
| White (reference group) | Note ...: not applicable | Note ...: not applicable |
| Chinese | 0.11Note *** | 0.08Note *** |
| Korean | 0.02 | 0.04 |
| Japanese | -0.01 | -0.01 |
| Southeast Asian | 0.04Note * | 0.04Note * |
| Filipino | 0.06Note *** | 0.04Note *** |
| South Asian | 0.05Note *** | 0.03Note *** |
| Arab or West Asian | -0.02 | 0.00 |
| Latin American | -0.03 | -0.01 |
| Black | -0.05Note *** | 0.01 |
| Other visible minorities | 0.00 | 0.01 |
... not applicable
Source: Statistics Canada, 2016 Census of Population. |
||
Several summary points can be drawn from the results above. First, in designated visible minority categories, women were more likely than men to have weekly earnings that were higher than those of their White counterparts. Women in four designated visible minority categories had weekly earnings that were higher than White women, while for men, this was the case in just one category. Conversely, the weekly earnings of men in five designated visible minority categories were significantly lower than those of White men, net of sociodemographic characteristics, while earnings of women in one category—Black women—were significantly lower.Note Second, weekly earnings varied considerably across designated visible minority categories themselves, being lowest among Black people and highest among Chinese people. Finally, the inclusion or exclusion of sociodemographic characteristics results in large changes in the estimates of relative weekly earnings. Now, to a more detailed assessment of these factors.
Results—Decomposing the “explained” portion of differences in earnings
An Oaxaca decomposition was used to divide the difference in weekly earnings between categories into an “explained” part, which is attributable to observed sociodemographic and employment characteristics in the multivariate models, and an “unexplained” part that captures the potential effects of differences in unobserved characteristics. The results of the decomposition are presented in Table 5.
Considering South Asian women as an example, the results show that the mean of log weekly earnings of this group was higher than the mean of log weekly earnings of White women by 0.14. The part explained by group differences in education, place of residence, language, age, family status, full-time status and occupation was 0.11. The unexplained part was 0.03—the amount between the total difference and the explained difference.
Further, Table 5 shows the shares of the explained portion attributable to each sociodemographic and employment variable. Some of these variables, such as the younger age profiles of South Asian women relative to White women, yield negative differences in relative earnings. That means if South Asian women had the same age distribution as White women, the mean of log weekly earnings of South Asian women would increase by 0.04. Other variables, such as the higher levels of educational attainment of South Asian women, yield positive differences. That is, if South Asian women had the same levels of educational attainment as White women, the mean of log weekly earnings of South Asian women would decrease by 0.06.
Overall, higher levels of educational attainment and urbanization in designated visible minority categories than in White ones were important factors in this regard. Educational attainment contributed positively to the explained portions of the gaps in earnings relative to White people, observed among men and women in most designated visible minorities and their White counterparts. This was particularly so among Chinese, Korean and South Asian people (e.g., decomposition terms of 0.08, 0.07 and 0.06, respectively, among women). Likewise, the predominantly urban residence of individuals in most categories contributed positively to the explained portion of the earnings gaps. Bilingualism in English and French accounted for very little of the difference.
Conversely, the younger age profiles of individuals in most designated visible minority categories contributed negatively to the explained portion of gaps in earnings. This was particularly so among Southeast Asian, Latin American, and Arab and West Asian people—the three categories with the youngest average ages (e.g., decomposition terms of -0.08, -0.06 and -0.05, respectively, among men). Family composition also contributed negatively to the explained portion of the gap, but played a far larger role among men than women. This consistent with the strong negative correlation between “child in census family” status and weekly earnings observed among men, and the relatively large shares of men in designated visible minority categories with this status.
The contributions of employment characteristics to the explained portion of the gaps in earnings differed between women and men. Full- or part-time employment status did not contribute much to the explained portions of the gaps in earnings between women in most designated visible minority categories, but did so among men, most notably those in the Black, Latin American and Southeast Asian categories.
The contribution of occupation to the explained portion of the earnings gap also differed somewhat between men and women. Occupation contributed negatively to the explained portion of the gaps in earnings for men in most designated visible minority groups, with results again largest among Black and Latin American men. Occupation also contributed negatively to the explained portion of the gaps in earnings observed among Black and Latin American women, but in contrast, contributed positively to the explained portion of those gaps observed among Chinese, Korean, South Asian and Japanese women. One interpretation is that women in these categories were able to convert high levels of educational attainment into employment in higher-paying occupations and relative earnings (Chen and Hou 2019).
| Total earnings gap | Earnings gap explained | Sources | |||||||
|---|---|---|---|---|---|---|---|---|---|
| Education | Place of residence | Language | Age | Family status | Full-time | Occupation | |||
| logarithmic scale | |||||||||
| Women | |||||||||
| Chinese | 0.26 | 0.18 | 0.08 | 0.07 | 0.00 | -0.05 | -0.01 | 0.03 | 0.06 |
| Korean | 0.20 | 0.17 | 0.07 | 0.07 | 0.00 | -0.02 | -0.01 | 0.00 | 0.05 |
| Japanese | 0.12 | 0.13 | 0.05 | 0.06 | 0.00 | -0.01 | 0.00 | 0.00 | 0.04 |
| Southeast Asian | -0.04 | -0.07 | 0.02 | 0.04 | 0.00 | -0.10 | -0.02 | 0.00 | -0.01 |
| Filipino | 0.11 | 0.07 | 0.03 | 0.07 | 0.00 | -0.03 | -0.02 | 0.00 | 0.02 |
| South Asian | 0.14 | 0.11 | 0.06 | 0.07 | 0.00 | -0.04 | -0.02 | 0.01 | 0.04 |
| Arab or West Asian | -0.03 | 0.00 | 0.04 | 0.04 | 0.01 | -0.07 | -0.02 | -0.02 | 0.01 |
| Latin American | -0.14 | -0.13 | -0.02 | 0.04 | 0.00 | -0.07 | -0.02 | -0.02 | -0.04 |
| Black | -0.08 | -0.07 | 0.00 | 0.03 | 0.00 | -0.03 | -0.02 | -0.02 | -0.03 |
| Other visible minorities | 0.04 | 0.04 | 0.03 | 0.06 | 0.00 | -0.05 | -0.01 | 0.00 | 0.01 |
| Men | |||||||||
| Chinese | 0.01 | 0.02 | 0.07 | 0.08 | 0.00 | -0.03 | -0.08 | -0.02 | 0.00 |
| Korean | 0.03 | 0.04 | 0.08 | 0.07 | 0.00 | -0.02 | -0.06 | -0.02 | -0.01 |
| Japanese | 0.05 | 0.07 | 0.04 | 0.07 | 0.00 | -0.01 | -0.03 | -0.01 | 0.01 |
| Southeast Asian | -0.24 | -0.23 | 0.02 | 0.03 | 0.00 | -0.08 | -0.11 | -0.05 | -0.03 |
| Filipino | -0.13 | -0.08 | 0.02 | 0.06 | 0.00 | -0.02 | -0.06 | -0.04 | -0.04 |
| South Asian | -0.01 | -0.03 | 0.05 | 0.06 | 0.00 | -0.03 | -0.07 | -0.02 | -0.01 |
| Arab or West Asian | -0.08 | -0.07 | 0.04 | 0.03 | 0.01 | -0.05 | -0.06 | -0.03 | -0.01 |
| Latin American | -0.32 | -0.23 | -0.02 | 0.03 | 0.00 | -0.06 | -0.08 | -0.05 | -0.05 |
| Black | -0.33 | -0.22 | -0.01 | 0.01 | 0.00 | -0.02 | -0.07 | -0.06 | -0.06 |
| Other visible minorities | -0.15 | -0.09 | 0.02 | 0.05 | 0.00 | -0.04 | -0.07 | -0.04 | -0.03 |
|
Note: Sample includes people aged 25 to 44 who were born in Canada, who had at least one week of paid employment and $500 in earnings in 2015, and who were not self-employed that year. Source: Statistics Canada, 2016 Census of Population. |
|||||||||
Results—Changes in relative weekly earnings, 2006 to 2016
Thus far, the analysis has focused on weekly earnings observed in 2015. One question that arises is whether the gaps in earnings between individuals in designated visible minority categories and White people widened, narrowed or remained the same over time. Evidence from the 2006 Census, and weekly earnings in 2005, are used to provide comparable estimates from 10 years earlier.
To do so, 2006 and 2016 Census respondents were combined in a single, pooled data file. Sociodemographic and employment characteristics for each year were included in the model, along with a variable distinguishing the 2006 and 2016 Census years. A set of dummy variables identifying each designated visible minority category and the White category as the reference group were also included. So too was a set of interaction terms combining the designated visible minority categories and the year 2016 flag. These variables (e.g., Chinese * 2016) equal 1 if individuals were Chinese in 2016 and equal 0 otherwise. In combination with other variables in the model, these interaction terms estimate changes in the magnitude of the weekly earnings gap between each designated visible minority category and the White category over the 2005-to-2015 period. If the variable is negative and significant, it indicates that the difference in weekly earnings widened; if it is positive and significant it indicates that the difference narrowed, and if it is non-significant it indicates the difference did not change in a statistically meaningful way.
Results are shown in Table 6. Among men and women in most designated visible minority categories, the differences in their weekly earnings relative to White people were about the same in 2015 as they were in 2005, as evidenced by the non-significance of the category*year interaction variables. However, the gaps did widen for other categories.
Taking sociodemographic characteristics into account, the gap in weekly earnings relative to White people widened by 8% among Latin American men and by 7% among Black men. When employment characteristics are additionally taken into account, the weekly earnings gap observed among Black men in relation to White people widened by 4%.
The gap in weekly earnings observed among Black women widened by 5% with sociodemographic characteristics taken into account, but did not change when employment characteristics were considered as well. Among South Asian and Filipino women, the weekly earnings advantage relative to White people observed in 2005 had diminished in 2015.
| Men | Women | |||
|---|---|---|---|---|
| Sociodemographic characteristics | Sociodemographic and employment characteristics | Sociodemographic characteristics | Sociodemographic and employment characteristics | |
| log points | ||||
| 2005 (reference group) | 0.00 | 0.00 | 0.00 | 0.00 |
| 2015 | 0.11Note *** | 0.11Note *** | 0.12Note *** | 0.11Note *** |
| White (reference group) | Note ...: not applicable | Note ...: not applicable | Note ...: not applicable | Note ...: not applicable |
| Chinese | 0.00 | -0.01 | 0.10Note *** | 0.05Note *** |
| Interaction term between Chinese and 2015 | -0.03Note * | -0.02 | -0.02 | 0.00 |
| Korean | 0.00 | 0.01 | 0.03 | 0.02 |
| Interaction term between Korean and 2015 | -0.06 | -0.05 | -0.05 | -0.02 |
| Japanese | 0.01 | 0.01 | 0.05 | 0.04 |
| Interaction term between Japanese and 2015 | -0.05 | -0.04 | -0.08Note * | -0.06 |
| Southeast Asian | -0.12Note ** | -0.12Note ** | 0.02 | -0.02 |
| Interaction term between Southeast Asian and 2015 | 0.06 | 0.08 | -0.01 | 0.02 |
| Filipino | -0.11Note *** | -0.08Note *** | 0.10Note *** | 0.02 |
| Interaction term between Filipino and 2015 | 0.01 | 0.01 | -0.06Note * | -0.01 |
| South Asian | -0.01 | -0.01 | 0.07Note *** | 0.03Note * |
| Interaction term between South Asian and 2015 | 0.00 | 0.00 | -0.06Note *** | -0.03Note * |
| Arab or West Asian | -0.09Note ** | -0.10Note *** | 0.04 | 0.02 |
| Interaction term between Arab or West Asian and 2015 | 0.05 | 0.07Note * | -0.09Note * | -0.03 |
| Latin American | -0.07Note * | -0.06 | -0.02 | -0.04 |
| Interaction term between Latin American and 2015 | -0.08Note * | -0.05 | -0.05 | 0.00 |
| Black | -0.16Note *** | -0.11Note *** | -0.03Note ** | -0.04Note ** |
| Interaction term between Black and 2015 | -0.07Note *** | -0.04Note ** | -0.05Note *** | -0.01 |
| Other visible minorities | -0.06Note ** | -0.04 | -0.02 | -0.03 |
| Interaction term between other visible minorities and 2015 | -0.05 | -0.05Note * | -0.02 | 0.00 |
... not applicable
Source: Statistics Canada, 2006 and 2016 Census of Population. |
||||
Discussion and conclusions
A primary objective of this paper has been to update Canadian information on weekly earnings differentials between individuals in designated visible minority and White categories. Evidence on the significance, direction and size of such differentials is one way to flag potential inequalities of opportunities across population groups. Several broad conclusions can be drawn from the results.
Selection criteria used to set up comparative assessments of labour market outcomes across designated visible minority and White categories are important. Most individuals in designated visible minority categories are immigrants to Canada and their employment outcomes reflect immigration-related issues, such as foreign credential recognition and knowledge of official languages. Limiting comparisons to individuals born in Canada is an effective way to reduce the effects of such confounding factors, although this restricts the focus to a small but rapidly growing segment of the visible minority population.
A related issue is the age at which individuals in this study were observed. Individuals in many designated visible minority categories were, on average, in their early thirties in 2016. Because many of them spent part of their 20s in university programs, they were likely to be at earlier stages of their careers than White people. Looking ahead, the earnings of university graduates may increase more than the earnings of those with lower levels of educational attainment, given that returns on educational investments yield a steeper age-earnings profile, particularly among men (Frenette, 2014). For this reason, the relative earnings of Canadian-born individuals in some designated visible minority categories may compare more favourably to White people as they age. The cohorts of individuals included in this study will be, on average, around 37 or 38 years of age in 2021. Weekly earnings comparisons using the 2021 Census will be informative, reflecting the outcomes of individuals further along their career and earnings trajectories.
Even among individuals born in Canada, sociodemographic characteristics vary considerably across designated visible minority and White categories. Individuals in designated visible minority categories are mostly born to immigrant parents, are relatively young and largely reside in Canada’s largest urban centres. Compared to White people, they are also more likely to live with their parents, to be single and to not (yet) have children. They are generally more likely than White people to have a university degree. Clearly, much needs to be taken into account when comparing weekly earnings across categories. Indeed, the inclusion of sociodemographic characteristics considerably diminishes the unadjusted differences in weekly earnings observed across categories.
After taking sociodemographic characteristics into account, the weekly earnings of men in five categories—Japanese, Korean, Chinese, South Asian, and Arab and West Asian—were not significantly different from those of White men. However, the weekly earnings of men in five other categories—Filipino, Southeast Asian, Latin American, Black, and Other visible minority groups—were significantly lower, with the largest differences observed among Black and Latin American men. When employment characteristics, specifically full- and part-time status and occupation, were taken into account, the weekly earnings of Black, Latin American and Filipino men were significantly lower than those of White men.
Among women, it was only among Black women that weekly earnings were significantly lower than White women, net of sociodemographic characteristics. Weekly earnings were significantly higher among Chinese, South Asian, Filipino and Southeast Asian women relative to their White counterparts, and not significantly different among women in five other categories. Overall, women in designated visible minority categories fared better relative to their White counterparts than did men.Note
The prevalence of university degrees among individuals in most designated visible minority categories is notable. The shares of Chinese and Korean women and men with a university degree were about 35 to 40 percentage points higher than the shares of their White counterparts, while the shares of South Asian and Japanese people with a university degree were 20 to 25 percentage points higher than that of White people. In the decomposition analysis, educational attainment accounts for a substantial share of the explained portion of the gaps in earnings relative to White people. By contrast, smaller shares of Black and Latin American individuals had a university degree and hence educational attainment accounted for very little of the earnings gap between them. The factors contributing to lower rates of university completion among Black and Latin American individuals, and the returns to education realized by those with postsecondary credentials, are two possible lines of inquiry.
Participation in full-time jobs and in higher-paying occupations are important components of relative weekly earnings. For Chinese, Korean, South Asian and Japanese women, the occupations in which they are employed contribute positively to their earnings relative to White people, suggesting that educational qualifications are being converted into positive labour market outcomes. By contrast, employment in part-time jobs and lower-paying occupations contributes negatively to the relative earnings of men in several categories, such as Black and Latin American.
Comparing two points in time, negative earnings differences observed among Latin American men and among Black men and women were wider in 2015 than in 2005, suggesting that these groups fell further behind.
Appendix
| Men | Women | |||
|---|---|---|---|---|
| Model 1 Sociodemographic characteristics | Model 2 Sociodemographic and employment characteristics | Model 1 Sociodemographic characteristics | Model 2 Sociodemographic and employment characteristics | |
| log points | ||||
| Age | 0.08Note *** | 0.06Note *** | 0.12Note *** | 0.08Note *** |
| Age-squared | 0.00Note *** | 0.00Note *** | 0.00Note *** | 0.00Note *** |
| Educational attainment | ||||
| No degree, certificate or diploma | -0.13Note *** | -0.12Note *** | -0.23Note *** | -0.16Note *** |
| High school (reference group) | Note ...: not applicable | Note ...: not applicable | Note ...: not applicable | Note ...: not applicable |
| Non-university postsecondary | 0.20Note *** | 0.15Note *** | 0.17Note *** | 0.12Note *** |
| Bachelor's degree | 0.32Note *** | 0.25Note *** | 0.50Note *** | 0.28Note *** |
| University above bachelor's degree | 0.37Note *** | 0.28Note *** | 0.59Note *** | 0.32Note *** |
| Official language | ||||
| English (reference group) | Note ...: not applicable | Note ...: not applicable | Note ...: not applicable | Note ...: not applicable |
| French | -0.02Note ** | -0.03Note *** | -0.01 | -0.03Note *** |
| English and French | 0.03Note *** | 0.03Note *** | 0.07Note *** | 0.04Note *** |
| Neither English nor French | -0.37Note *** | -0.31Note *** | -0.17 | -0.16 |
| Census family status | ||||
| Married or common-law without children | -0.15Note *** | -0.12Note *** | 0.10Note *** | 0.04Note *** |
| Married or common-law with children (reference group) | Note ...: not applicable | Note ...: not applicable | Note ...: not applicable | Note ...: not applicable |
| Lone parent | -0.17Note *** | -0.13Note *** | -0.08Note *** | -0.06Note *** |
| Child in a census family | -0.51Note *** | -0.36Note *** | -0.15Note *** | -0.09Note *** |
| Person living alone | -0.18Note *** | -0.14Note *** | 0.13Note *** | 0.07Note *** |
| Person not in a census family but living with other people | -0.41Note *** | -0.32Note *** | -0.07Note *** | -0.07Note *** |
| Province or territory of residence | ||||
| Newfoundland and Labrador | 0.16Note *** | 0.16Note *** | 0.01 | -0.01 |
| Prince Edward Island | -0.23Note *** | -0.22Note *** | -0.11Note *** | -0.14Note *** |
| Nova Scotia | -0.10Note *** | -0.10Note *** | -0.10Note *** | -0.11Note *** |
| New Brunswick | -0.11Note *** | -0.11Note *** | -0.09Note *** | -0.11Note *** |
| Quebec | -0.14Note *** | -0.13Note *** | -0.07Note *** | -0.09Note *** |
| Ontario (reference group) | Note ...: not applicable | Note ...: not applicable | Note ...: not applicable | Note ...: not applicable |
| Manitoba | 0.03Note *** | 0.02Note *** | 0.00 | 0.01 |
| Saskatchewan | 0.24Note *** | 0.21Note *** | 0.16Note *** | 0.14Note *** |
| Alberta | 0.37Note *** | 0.34Note *** | 0.19Note *** | 0.19Note *** |
| British Columbia | 0.09Note *** | 0.09Note *** | -0.03Note *** | 0.00 |
| Territories | 0.28Note *** | 0.28Note *** | 0.45Note *** | 0.37Note *** |
| Census metropolitan area (CMA) of residence | ||||
| Montréal | 0.03Note *** | 0.05Note *** | 0.08Note *** | 0.06Note *** |
| Toronto | 0.08Note *** | 0.09Note *** | 0.17Note *** | 0.11Note *** |
| Vancouver | -0.03Note *** | -0.02Note ** | 0.13Note *** | 0.07Note *** |
| Medium-sized CMAs | -0.04Note *** | -0.02Note *** | 0.10Note *** | 0.06Note *** |
| Small-sized CMAs | -0.07Note *** | -0.05Note *** | 0.03Note *** | 0.01Note *** |
| Not living in a CMA (reference group) | Note ...: not applicable | Note ...: not applicable | Note ...: not applicable | Note ...: not applicable |
| Occupations | ||||
| Management (reference group) | Note ...: not applicable | Note ...: not applicable | Note ...: not applicable | Note ...: not applicable |
| Professional occupations | Note ...: not applicable | -0.08Note *** | Note ...: not applicable | 0.03Note *** |
| Technical and paraprofessional occupations | Note ...: not applicable | -0.09Note *** | Note ...: not applicable | -0.14Note *** |
| Administration and administrative support | Note ...: not applicable | -0.28Note *** | Note ...: not applicable | -0.23Note *** |
| Sales | Note ...: not applicable | -0.29Note *** | Note ...: not applicable | -0.38Note *** |
| Personal and customer information services | Note ...: not applicable | -0.47Note *** | Note ...: not applicable | -0.43Note *** |
| Industrial, construction and equipment operation trades | Note ...: not applicable | -0.08Note *** | Note ...: not applicable | -0.07Note *** |
| Workers and labourers in transport and construction | Note ...: not applicable | -0.19Note *** | Note ...: not applicable | -0.22Note *** |
| Natural resources, agriculture and related production occupations | Note ...: not applicable | -0.02Note * | Note ...: not applicable | -0.32Note *** |
| Occupations in manufacturing and utilities | Note ...: not applicable | -0.15Note *** | Note ...: not applicable | -0.22Note *** |
| Full-time or part-time status | Note ...: not applicable | 0.70Note *** | Note ...: not applicable | 0.61Note *** |
| Constant | 5.31Note *** | 5.21Note *** | 3.84Note *** | 4.45Note *** |
| R2 | 0.21 | 0.30 | 0.19 | 0.34 |
... not applicable
Source: Statistics Canada, 2016 Census of Population. |
||||
References
Abada, T., Hou, F., & Ram, B. (2009). Ethnic differences in educational attainment among the children of immigrants. Canadian Journal of Sociology, 34(1): 1–28.
Aydemir, A., & Sweetman, A. (2007). First and second generation immigrant educational attainment and labor market outcomes: A comparison of the United States and Canada. Research in Labor Economics 27: 215–270.
Basran, G.S. (1998). Devaluation of foreign credentials as perceived by visible minority professional immigrants. Canadian Ethnic Studies, 30(3): 6.
Boudarbat, B., Lemieux, T., & Riddell, W.C. (2010). The Evolution of the Returns to Human Capital in Canada, 1980–2005. Canadian Public Policy, 36(1): 63-89.
Boyd, M. (2008). Variations in socioeconomic outcomes of second generation young adults. Canadian Diversity, 6(2): 20–24.
Boyd, M., & Grieco, E. (1998). Triumphant transitions: Socioeconomic achievements of the second generation in Canada. International Migration Review, 22(4): 857–876.
Boyd, M., & Cao, X. (2009). Immigrant Language Proficiency, Earnings, and Language Policies. Canadian Studies in Population, 36(1-2):63-86.
Boyd, M., &Schellenberg, G. (2007). Re-accreditation and the occupations of immigrant doctors and engineers. Canadian Social Trends. Statistics Canada, Catalogue No. 11-008.
Canadian Heritage. (2019). BUILDING A FOUNDATION FOR CHANGE: Canada’s Anti-Racism Strategy 2019-2022. Building a Foundation for Change: Canada’s Anti-Racism Strategy 2019–2022 - Canada.ca
Chen, W.-H., & Hou, F. (2019). Intergenerational Education Mobility and Labour Market Outcomes: Variation among the Second Generation of Immigrants in Canada. (Analytical Studies Branch Research Paper Series, No. 418). Statistics Canada Catalogue No. 11F0019M.
Corak, M. (2011). Age at Immigration and the Educational Outcomes of Children. (Analytical Studies Branch Research Paper Series, No. 336). Statistics Canada Catalogue No. 11F0019M.
Frenette, M. (2014). An Investment of a Lifetime? The Long-term Labour Market Premiums Associated with a Postsecondary Education. (Analytical Studies Branch Research Paper Series, No. 359). Statistics Canada Catalogue No. 11F0019M.
Hou, F., Abada, T., & Lu, Y. (2012). Bosses of Their Own: Are Children of Immigrants More Likely Than Their Parents to be Self-Employed? (Statistics Canada: Analytical Studies Branch Research Paper Series, Catalogue No. 11F0019M — No. 341).
Hou, F., Crossman, E. & Picot, G. (2020). Two-step Immigration Selection: Recent Trends in Immigrant Labour Market Outcomes. Economic Insights. Statistics Canada. Catalogue No. 11-626-X — 2020011 - No. 113.
Hou, F., & Bonikowska, A. (2017). Educational attainment of childhood immigrants: how does immigration type matter? Journal of Ethnic and Migration Study, 43(9): 1434–1452.
Hou, F., & Bonikowska, A.. (2016). Educational and Labour Market Outcomes of Childhood Immigrants by Admission Class. (Statistics Canada: Analytical Studies Branch Research Paper Series, Catalogue No. 11F0019M — No. 377).
Hou, F., & Bonikowska, A.. (2015). The Earnings Advantage of Landed Immigrants Who Were Previously Temporary Residents in Canada. (Statistics Canada: Analytical Studies Branch Research Paper Series, Catalogue No. 11F0019M — No. 370).
Hou, F., &, Coulombe, S. (2010). Earnings gaps for Canadian-born visible minority groups in the public and private sectors. Canadian Public Policy, 36(1): 29–43.
Library of Parliament. (2020). Canada’s Federal Anti-Racism Strategy. Hillnotes. Canada’s Federal Anti-Racism Strategy: An Overview - HillNotes.
Palameta, B. (2007). Economic integration of immigrants’ children. Perspectives on Labour and Income, (8): 10. Statistics Canada Catalogue No. 75-001-XWE.
Pendakur, K., & Pendakur, R. (2011). Color by Numbers: Minority Earnings in Canada 1995-2005. International Migration and Integration (12): 305-329.
Pendakur, K., & Pendakur, R. (2016). Which Child Immigrants Face Earnings Disparity? Age-at-immigration, Ethnic Minority Status and Labour Market Attainment in Canada. International Migration, 54(5): 43-58.
Pendakur, K., & Pendakur, R. (1998). “The Colour of Money: Earnings Differentials among Ethnic Groups in Canada.” Canadian Journal of Economics/Revue canadienne d’économique, 31 (3): 518-548.
Picot, G., & Hou, F. (2010). Seeking success in Canada and the United States: Labour market outcomes among the children of immigrants. In Equal Opportunities: The Labour Market Integration of the Children of Immigrants, chapter 3, p. 79–113. Paris: OECD Publishing.
Picot, G.,& Hou, F. (2011). Preparing for Success in Canada and the United States: The Determinants of Educational Attainment Among the Children of Immigrants. (Analytical Studies Branch Research Paper Series, No. 332). Statistics Canada Catalogue No. 11F0019M.
Picot, G., & Sweetman, A. (2005). The Deteriorating Economic Welfare of Immigrants and Possible Causes: Update 2005. (Statistics Canada: Analytical Studies Branch Research Paper Series, Catalogue No. 11F0019M — No. 262).
Portes, A., & Zhou, M. (1993). The new second generation: Segmented assimilation and its variants. Annals of the American Academy of Political and Social Science, 530: 74–96.
Skuterud, M. (2010). The visible minority earnings gap across generations of Canada. Canadian Journal of Economics, 43(3): 860–881.
Statistics Canada. (2017). Dictionary, Census of Population, 2016 - Visible minority (statcan.gc.ca).
Zhou, M., & Xiong, Y.S. (2005). The multifaceted American experiences of the children of Asian immigrants. Ethnic and Racial Studies, 28: 1119–1152.
- Date modified: