
Economic and Social Reports
Leveraging postsecondary student employment into a career: The importance of remaining in the firm after graduation
DOI: https://doi.org/10.25318/36280001202100600005-eng
Skip to text
Text begins
Abstract
The repercussions of the COVID-19 pandemic have led to increased competition among youth for fewer available jobs in general (and perhaps more so in specific sectors); this underscores the importance of being innovative in one’s job search. This study considers one feature of résumé-building that has not been previously explored: leveraging a student job into a career. More specifically, the study estimates the relationship between post-graduation labour market outcomes and the type of match between the student job and the post-graduation job. To do so, the study combines administrative data from various sources, including enrolment and graduation data from the Postsecondary Student Information System, employer data from the Longitudinal Worker File, and family income data from the T1 Family File. A key feature of these data is their ability to track individuals in a specific firm as they transition from postsecondary studies to the labour market. The study finds that after accounting for differences in detailed socioeconomic characteristics (parental income quintile, field of study, and postsecondary institution fixed effects) and post-graduation job characteristics (industry and firm size), the following conclusions were drawn: graduates who retained their student job earned $4,918 (men) and $2,471 (women) more, two years after graduation, than graduates who did not retain their student job, and $10,317 (men) and $7,873 (women) more than those who did not have a student job. Graduates who retained their student job were also more likely to have an employer-sponsored pension plan and to pay union dues than graduates who did not retain their student job or who did not have a student job.
Authors
Marc Frenette, Tomasz Handler and Ping Ching Winnie Chan are with the Social Analysis and Modelling Division, Analytical Studies Branch at Statistics Canada.
Acknowledgements
This study was funded by Employment and Skills Development Canada (ESDC). Helpful comments were received from René Morissette and Laura Gibson at Statistics Canada, and from Michelle G. Laing and Jason Gupta at Employment and Skills Development Canada.
Introduction
Building a résumé during one’s postsecondary studies may provide postsecondary students with an advantage in the labour market after graduation. Although there are many ways to do so, this study will investigate one previously unexplored detail that students may leverage: building human capital with a specific employer. Past employers might consider the value of a job candidate as particularly high in the post-graduation labour market when the candidate has significant experience within their firm. Moreover, firms had the opportunity to observe student employees first-hand, which could reduce the uncertainty associated with assessing them as job applicants. Some firms may also be willing to pay a premium to reduce risk in hiring student employees. As a result of these two factors—significant experience and reduced risk—students who land a job with a previous employer after graduation may have better early labour-market outcomes. Alternatively, from a postsecondary graduate’s perspective, retaining a job with a previous employer could signal a poor labour market outcome, particularly in certain industries that pay the minimum wage.
Understanding how a job held during one’s studies may benefit post-graduation outcomes could be more important now than ever, as youth compete for fewer jobs in the labour market following the COVID‑19 pandemic. Indeed, the unemployment rate among youth (aged 15 to 24 years) reached a historic high in May 2020 (29.4%), and remained well above the historical average of about 14% reported by Frenette, Messacar and Handler (2020) in December 2020 (17.7%). This study also showed that above average youth unemployment rates during the year of graduation have historically been associated with significantly lower earnings for high school, college and bachelor’s degree graduates several years later. While it is too early to know for sure, the impact of COVID-19 may affect graduates in certain areas more so than others.
To date, no Canadian studies have examined the relationship between the job held during one’s studies and the job held after graduation, because of data limitations. The closest strand of the literature relates to Work-Integrated Learning (WIL), which is defined as a “model” or a process of curricular experiential education that formally and intentionally integrates a student’s academic studies within a workplace or practice setting (Co-operative Education and Work-Integrated Learning Canada 2019). Some examples of WIL include applied research projects, apprenticeships, co-operative education, entrepreneurship, field placement, internships, mandatory professional practicum, service learning, and work experience. Such arrangements allow students to explore career development, to have an opportunity to apply theory through practice in real workplace, and to develop marketable workplace skills.
Several empirical studies in Canada have explored the National Graduates Survey, which contains information on WIL or co-op studies (the term has been used interchangeably over the years). Early studies concluded that co-op graduates had superior labour market outcomes to those of other graduates in terms of higher income (Darch 1995) and lower over-qualification rates (Frenette 2000). Since then, Rodriguez, Zhao and Ferguson (2016) analyzed co-op student participation rates, between 1986 and 2010, and found substantial increases in participation rates among college graduates (from 7% to 22%) and among bachelor’s degree graduates (from 5% to 12%). With co-op participation rates more than doubling in about a quarter of a century, it became important to revisit the labour market outcomes of co-op graduates. Walters and Zarifa (2008) found that co-op graduates still commanded a higher earnings premium in the labour market than other graduates, as did Wang (2017). Moreover, Wang (2017) found that co-op graduates also registered a closer match between the job and the field of study.Note The most recent study is by Galarneau, Kinack and Marshall (2020), who found that bachelor’s degree graduates who participated in WIL earned 7% more than those who did not participate in WIL, three years after graduation.
Using the Longitudinal and International Study of Adults, Martin and Rouleau (2020) focus more broadly on formal and informal WIL arrangements that resulted in student jobs related to the student’s field of study. They found that, between 2012 and 2016, 80.2% of postsecondary graduates had a job at some point during their studies. Of this group, more than half (56.7%) held a student job that was related to their field of study. In about one-third of these cases (34.3%), the students were registered in a formal WIL program, while the remaining students (65.7%) had secured a job related to their field of study on their own. This study concludes that finding a student job related to one’s field of study is positively associated with full-time employment status after graduation. Specifically, 74.6% of graduates who held a student job related to their field of study found full-time employment within three months of graduating, compared with 60.5% of graduates who held a student job that was not related to their field of study.
The findings of Martin and Rouleau (2020) are important, since they suggest that holding certain types of student jobs may matter to labour market outcomes; specifically, jobs related to their field of study may lead to better earnings outcomes after graduation. This might be because having a student job related to one’s field of study allows students to build on their human capital developed in class.
Another way for students to develop human capital is by working. Indeed, workers who retain a job that they held as a student may enable them to learn firm-specific skills that could benefit them in terms of career advancement if they remain in the same firm. This is the focus of the current study.
This analysis is based on administrative data from the Postsecondary Student Information System (PSIS), the T1 Family File (T1FF) and the Longitudinal Worker File (LWF). Combined, these data enable the tracking of postsecondary students as they progress from school to the labour market. It is also important that the data enable the tracking of employers as workers transition from student to graduate.
The data and methods used in the study are examined in the next section. This is followed by a presentation of the results. Last, the results are summarized in the conclusion.
Data and methods
The main objective of this study is to estimate the role that a student job plays in determining the earnings of recent bachelor’s degree graduates. Does it matter whether a graduate held a job while in school, and does retaining a student job after graduation matter?
To answer these questions, the study uses the linked administrative data that combine the PSIS, the T1FF, and the LWF. The PSIS contains data on enrolments and graduation in Canadian publicly funded postsecondary institutions. Coverage has been almost fully comprehensive for enrolments, since 2009, and for graduations, since 2010. The PSIS variables that were used in this study include the following: a postsecondary institution identifier, the primary groupings within the Classification of Instructional Programs, the education level of the program, the student’s birth year, the student’s enrolment and graduation dates, and the student’s citizenship status. The T1FF contains personal tax-filer information organized by family. Particularly useful for this study are the variables of parental income and sex. And finally, the LWF is a combination of information collected from the T4, T1, and record of employment files, and the Longitudinal Employment Analysis Program. The LWF contains, for each job the student held both before and after graduation, a firm identifier (to allow for longitudinal tracking of the firm), the North American Industrial Classification System (NAICS) code, the firm size (number of employees), as well as T4 wages and salaries (henceforth, “earnings”).
To limit the influence of previous postsecondary job experience, the methodology is designed to track Canadian bachelor’s degree graduate cohorts that most likely began their postsecondary studies right after high school. Specifically, only individuals who first enrolled in a bachelor’s degree program in a university or collegeNote during the year they were 18 or 19 years old as of December 31, are included. The focus is on graduates from 2015 who began their studies between 2010 and 2012,Note who were working in a paid job in 2017, and who had no self-employment income in that year. Furthermore, to ensure that all students were able to work, the sample includes only individuals who were Canadian citizens or permanent residents, from their first year of enrolment onwards. The final sample includes 26,010 bachelor’s degree graduates, of which just over 60% were female.Note
The primary outcome variable refers to the annual paid earnings of the 2015 graduates, two years after their graduation (in 2017). Total earnings are based on T4 earnings from all jobs, which are collected from T4 forms that include wages, salaries, commissions, and other taxable benefits. Note that the study also includes two other outcome variables: binary variables indicating whether the individual holds a registered pension plan or a deferred profit-sharing plan (i.e., an employer-sponsored pension plan) or whether they paid union dues (as a proxy for membership in a union). Having an employer-sponsored pension plan reduces the need to save for retirement, while being part of a union may result in acquiring job security and better working conditions. The main focus of the study, however, is on earnings.
The econometric model consists of a quantile (median) earnings regression.Note Specifically, median earnings are regressed on the binary indicators of job match (described later), various socioeconomic characteristics (binary indicators of parental income quintile, binary indicators of the 2011 Classification of Instructional Program primary groupings, institutional fixed effects, age at the beginning of the program, and start year of the program), and job characteristics (post-graduation industry of main job, as captured by binary indicators of four-digit 2012 NAICS codes, and binary firm size indicators of the number of employees). It is worth noting that, although the three types of job matches in this study (student job retained, student job not retained, no student job) can be prone to self-selection bias, the detailed socioeconomic characteristics examined here address some of the potential biases when comparing earnings across the different types of job match. Indeed, getting accepted into a particular program at a particular institution (both of which are taken into account in this study) is contingent on getting good grades in high school. Moreover, students from higher-income families also generally have higher grades in high school, as well higher expectations placed upon them by parents, who are far more likely to have a degree of their own (Frenette 2007). The post-graduation job characteristics (industry and firm size) accounted for could be indicative of job quality, which may also affect whether a graduate chooses to retain their student job or not.
One of the independent variables in the analysis, parental income quintile, is based on after-tax parental income. When available, this was measured during the first year of enrolment or, otherwise, during the closest year to the first year of enrolment. Parental income was captured during the first year of enrolment in nearly 88% of cases, and within one year of the first year of enrolment in just over 95% of cases. Prior to calculating income quintiles, which are measured from the analytical sample distribution, parental income was converted to 2017 constant dollars.
Being able to identify the specific firms where the graduates worked makes the LWF essential to creating the key variables used in the analysis: the job-matching variables associating the student with post-graduation jobs. Indeed, this is the main contribution of this study. Three mutually exclusive categories were created from this information:
- Graduates held a job two years after graduation that they also held as a student. For ease of presentation, these individuals are described as having retained their student job.
- Graduates did not hold a job two years after graduation that they also held as a student. For ease of presentation, these individuals are described as not having retained their student job.
- The graduates did not hold a student job.
Note that student jobs held in the first and last year of enrolment in a bachelor’s degree program are excluded, since it is not possible to know whether the job was held as a student because job data are annual in nature. Also, the first category (retaining a student job) can be subdivided into two categories: the student job matches the main job held two years after graduation (based on highest earnings) and the student job matches a secondary job held two years after graduation. Results are also presented according to this more detailed classification, but they are not the preferred specification, again, because of the annual nature of the job data (i.e., a secondary job based on annual earnings could actually be considered a main job if it began at only the end of the calendar year, and, thus, only lasted a short period of time during the year observed).
Finally, the analysis will be conducted separately for men and women, since they tend to register in different fields of study and work in different occupations and industries. A sex-based lens is also important, moving forward, since young women in the labour market have been somewhat more negatively affected by the pandemic than have young men.Note
Results
Before delving into labour market outcomes for bachelor’s degree graduates by type of job match, this section begins by examining the distribution of graduates by type of job match (Chart 1). First, the vast majority of bachelor’s degree graduates employed two years after graduation held a student job (more than 95% of men and women). Approximately one in three held a student job that matched at least one of their post-graduation jobs (29.7% of men and 30.2% of women). In two-thirds of cases, graduates did not retain their student job (66.0% of men and 66.6% of women).

Data table for Chart 1
| Student job retained after graduation | Student job not retained after graduation | No student job | |
|---|---|---|---|
| percent | |||
| Men | 29.72868 | 66.04104 | 4.23028 |
| Women | 30.20919 | 66.61156 | 3.17925 |
| Sources: Statistics Canada, Postsecondary Student Information System and Longitudinal Worker File. | |||
The remainder of this section focuses on differences in labour market outcomes by the three types of job matches, as shown in Chart 1. The analysis begins by examining median earnings two years after graduating with a bachelor’s degree, the share of workers with a registered pension plan or a deferred profit-sharing plan, and the share of workers who paid union dues during the same timeframe. These results are all shown by type of match between the student job and the post-graduation job. The focus then shifts, more specifically, to further understanding the differences in median earnings across the various types of job matches. To this end, differences in other determinants of earnings are described. Finally, median regressions of earnings for the type of job match are estimated with no covariates (equivalent to the unadjusted differences), with socioeconomic covariates (to estimate the overall role of job match on post-graduation earnings), and, then, with socioeconomic and post-graduation job characteristics (to estimate the role of job match on the earnings of graduates, net of the impact of job quality, as proxied by industry and firm size). Finally, the earnings results are further broken down into two categories of student jobs that were retained after graduation: those that were considered the main job, and others. As noted in this study’s “Data and methods” section, these results may, however, be subject to measurement error because of inherent difficulties in identifying the main job with annual data.
Chart 2 shows the median earnings for all jobs held two years after graduating from a bachelor’s degree program, by type of job match. Men and women who held a student job while completing their bachelor’s degree earned considerably more after graduating. For example, the median earnings of men with no student job were $31,808. In contrast, their male counterparts with a student job earned considerably more. Those whose student job was retained two years after graduation registered $50,174 in median earnings (57.7% higher), while men who held a student job that was not retained registered $45,142 in median earnings (41.9% higher). Similar findings were observed for women, although those who held a student job registered relatively higher median earnings when compared with those who had no student job: 71.2% higher when the student job was retained and 62.3% higher when the student job was not retained.
Among men and women with a student job, graduate earnings were higher when the student job was retained. This was especially the case for men, who registered $5,032 more in median earnings when their student job was retained (11.1% higher). In contrast, the median earnings of women were $2,095 higher when their student job was retained (a 5.5% difference).

Data table for Chart 2
| Student job retained after graduation | Student job not retained after graduation | No student job | |
|---|---|---|---|
| median earnings (2017 dollars) | |||
| Men | 50,174 | 45,142 | 31,808 |
| Women | 40,180 | 38,085 | 23,473 |
| Sources: Statistics Canada, Postsecondary Student Information System and Longitudinal Worker File. | |||
Thus, the descriptive results suggest that holding a student job is associated with considerably higher graduate earnings for both men and women. Among those with a student job, median earnings were somewhat higher for those whose student job was retained (especially for men).
These findings are largely mirrored in Chart 3, which shows the percentage of graduates with a registered pension plan or deferred profit-sharing plan (i.e., they had an employer-sponsored pension plan). The share of male and female graduates with an employer-sponsored pension plan increased monotonically with the degree of job match. For example, 18.2% of women with no student job had an employer-sponsored pension plan after graduation, compared with 31.8% of their counterparts with a student job that was not retained, and 37.7% among those with a student job that was retained. Results for men are almost identical.
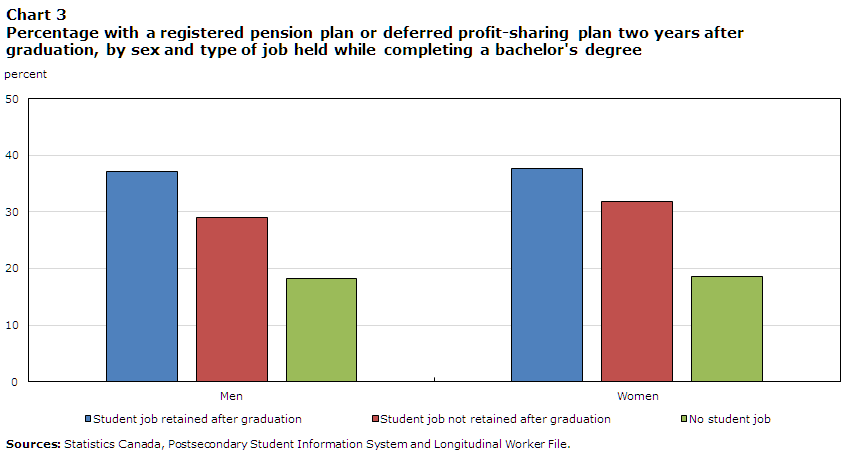
Data table for Chart 3
| Student job retained after graduation | Student job not retained after graduation | No student job | |
|---|---|---|---|
| percent | |||
| Men | 37.12790 | 28.96481 | 18.16092 |
| Women | 37.65523 | 31.82512 | 18.60000 |
| Sources: Statistics Canada, Postsecondary Student Information System and Longitudinal Worker File. | |||
The percentage of graduates who paid union dues (i.e., in a unionized job) appears in Chart 4. In this case, there is a very clear distinction between men and women, with the latter more likely to be unionized. Indeed, in university, women are more likely to study social sciences and health, but less likely to study business than men. Social sciences and health are generally more associated with the public and para-public sectors, where unionization rates are the highest, whereas business is generally more associated with the private sector, where unionization rates are the lowest. More importantly, for this study, the results signal a much flatter gradient by type of job match, especially among men. In fact, 15.4% of men whose student job was retained were members of a union, compared with 12.6% among their counterparts whose student job was not retained, and 10.1% among men with no student job. When combined with the median earnings results, by type of job match (Chart 2), the results shown in Chart 4 imply that the higher earnings associated with a stronger job match may not result from higher rates of unionization for men with a strong job match. Interestingly, previous research has indicated that unionization is associated with wage compression for men, but not for women (Card, Lemieux and Riddell 2003).
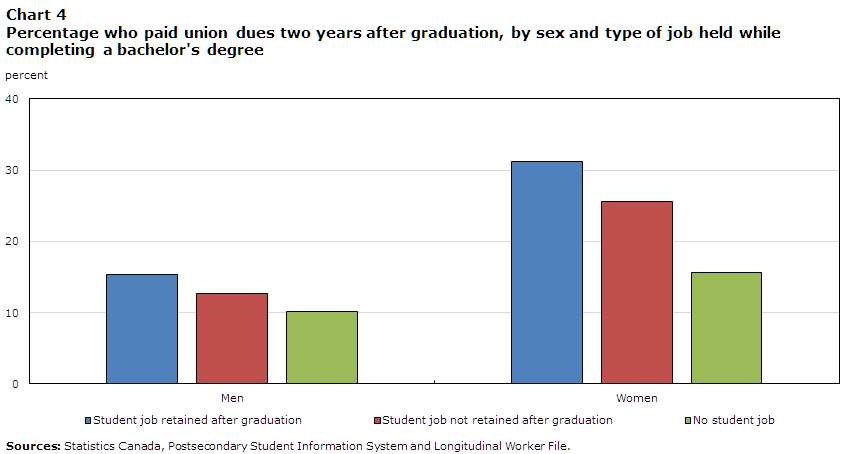
Data table for Chart 4
| Student job retained after graduation | Student job not retained after graduation | No student job | |
|---|---|---|---|
| percent | |||
| Men | 15.37455 | 12.63437 | 10.11494 |
| Women | 31.13029 | 25.56319 | 15.60000 |
| Sources: Statistics Canada, Postsecondary Student Information System and Longitudinal Worker File. | |||
Employer-sponsored pension plans and unions confer significant benefits to workers. Indeed, when an employer contributes to an employee pension plan, the worker may not have to save as much for retirement. Unions, for their part, may negotiate certain benefits on behalf of their membership, such as job security or work safety provisions. Thus, the results in charts 3 and 4 indicate that retaining the student job after graduation benefits the workers in ways not captured by earnings alone. This is important to keep in mind, as the remainder of this study will focus on the relationship between earnings and the type of match between the student and post-graduation jobs.
As a first step, differences in several key determinants of earnings are shown in tables 1 and 2 for men and women, respectively. Beginning with men, several important differences are evident. For example, the distribution of parental income varied considerably by type of job match. This was particularly the case when comparing men with no student job (where 41.4% were in the bottom parental income quintile and 9.9% were in the top income quintile) with those who had a student job (who displayed a much more even distribution across parental income quintiles). Those who retained their student job were slightly more likely to have parents in the higher income quintiles than those who did not retain their student job.Note
| Student job retained after graduation | Student job not retained after graduation | No student job | |
|---|---|---|---|
| percentage | |||
| Parental income quintile | |||
| Bottom | 15.0 | 18.5 | 41.4 |
| Second | 17.4 | 19.6 | 23.2 |
| Third | 20.8 | 19.1 | 14.3 |
| Fourth | 23.1 | 21.0 | 11.3 |
| Top | 23.7 | 21.9 | 9.9 |
| Field of study (CIP 2011 primary groupings) | |||
| Visual and performing arts, and communications technologies | 2.6 | 2.9 | 3.9 |
| Humanities | 6.9 | 5.4 | 7.1 |
| Social and behavioural sciences and law | 19.0 | 18.1 | 16.3 |
| Business, management and public administration | 28.5 | 28.0 | 25.7 |
| Physical and life sciences and technologies | 8.2 | 9.6 | 15.6 |
| Mathematics, computer and information sciences | 3.6 | 4.3 | 7.6 |
| Architecture, engineering, and related technologies | 19.5 | 18.4 | 12.0 |
| Agriculture, natural resources and conservation | 1.7 | 2.0 | 1.6 |
| Health and related fields | 7.3 | 8.0 | 9.2 |
| Personal, protective and transportation services | 1.2 | 1.2 | 0.0 |
| Other (including education) | 1.5 | 2.0 | 0.9 |
| Firm size of main post-graduation job (number of employees) | |||
| Fewer than 5 | 6.7 | 5.3 | 6.7 |
| 5 to fewer than 20 | 9.0 | 9.6 | 10.6 |
| 20 to fewer than 50 | 8.3 | 9.5 | 9.2 |
| 50 to fewer than 100 | 6.5 | 7.8 | 9.4 |
| 100 to fewer than 200 | 5.2 | 7.6 | 7.1 |
| 200 to fewer than 500 | 6.6 | 8.2 | 7.6 |
| 500 or more | 57.7 | 51.9 | 49.4 |
| Industry of main post-graduation job (one-digit NAICS 2012 code) | |||
| Agriculture, forestry, fishing and hunting | 0.4 | 1.0 | 0.7 |
| Mining, quarrying, and oil and gas extraction; utilities; and construction | 1.0 | 0.5 | 0.5 |
| Manufacturing | 8.5 | 5.2 | 2.3 |
| Wholesale trade, retail trade, and transportation and warehousing | 7.6 | 7.5 | 5.7 |
| Information and cultural industries; finance and insurance; real estate and rental and leasing; professional, scientific and technical services; management of companies and enterprises; and administrative and support, waste management and remediation services | 15.2 | 14.1 | 20.0 |
| Educational services, and health care and social assistance | 38.1 | 47.3 | 46.2 |
| Arts, entertainment and recreation, and accommodation and food services | 8.3 | 9.7 | 12.2 |
| Other services (except public administration) | 6.3 | 5.5 | 6.2 |
| Public administration | 2.0 | 1.8 | 2.1 |
| Unknown | 12.7 | 7.5 | 4.1 |
|
Notes: CIP stands for Classification of Instructional Programs and NAICS stands for North American Industry Classification System. Sources: Statistics Canada, Postsecondary Student Information System, Longitudinal Worker File and T1 Family File. |
|||
The distribution of fields of study also varied by type of job match. Indeed, 19.5% of men who retained their student job after graduation studied architecture, engineering, and related technologies (associated with high pay), compared with 12.0% among those who did not have a student job. However, the proportion who enrolled in another high-paying broad field-of-study grouping (business, management and public administration) registered only small differences. Conversely, the share of men enrolled in physical and life sciences and technologies (a low-paying field) was much higher among those with no student job (15.6%) than the other two groups (below 10% in each case).Note
Men who retained their student job after graduation were somewhat more likely to be employed in a large firm (with 500 or more employees) compared with other male graduates. They were also more likely than all other groups of men to land a post-graduation job in manufacturing, and less likely to be employed in information and cultural industries; finance and insurance; real estate and rental and leasing; professional, scientific and technical services; management of companies and enterprises; and administrative and support, waste management and remediation services; or in educational services, and health care and social assistance.
Some key differences are also observed for women (Table 2). First, women were generally less likely than men to come from a household in the top income quintile. This might be because far more women go to university than men. Since parental income is a strong, positive correlate of university enrolment, this may lower the average parental income of women who enrol. Otherwise, the trends in the distribution of parental income by type of job match were qualitatively similar to what was registered by men.
| Student job retained after graduation | Student job not retained after graduation | No student job | |
|---|---|---|---|
| percentage | |||
| Parental income quintile | |||
| Bottom | 17.2 | 20.0 | 46.6 |
| Second | 20.2 | 21.4 | 21.0 |
| Third | 21.8 | 20.6 | 12.8 |
| Fourth | 22.3 | 19.4 | 9.6 |
| Top | 18.5 | 18.6 | 10.0 |
| Field of study (CIP 2011 primary groupings) | |||
| Visual and performing arts, and communications technologies | 3.8 | 5.5 | 6.2 |
| Humanities | 8.2 | 7.1 | 8.2 |
| Social and behavioural sciences and law | 27.7 | 29.0 | 26.8 |
| Business, management and public administration | 18.4 | 16.3 | 16.0 |
| Physical and life sciences and technologies | 10.0 | 9.5 | 18.0 |
| Mathematics, computer and information sciences | 0.8 | 0.9 | 2.4 |
| Architecture, engineering, and related technologies | 3.4 | 3.6 | 3.0 |
| Agriculture, natural resources and conservation | 2.2 | 2.4 | 1.4 |
| Health and related fields | 19.5 | 19.4 | 15.6 |
| Personal, protective and transportation services | 1.3 | 0.9 | 0.6 |
| Other (including education) | 4.8 | 5.4 | 1.8 |
| Firm size of main post-graduation job (number of employees) | |||
| Fewer than 5 | 5.1 | 5.5 | 7.6 |
| 5 to fewer than 20 | 8.7 | 9.7 | 10.8 |
| 20 to fewer than 50 | 7.6 | 8.9 | 9.8 |
| 50 to fewer than 100 | 5.6 | 6.9 | 6.6 |
| 100 to fewer than 200 | 4.9 | 6.4 | 5.8 |
| 200 to fewer than 500 | 5.8 | 7.9 | 8.4 |
| 500 or more | 62.3 | 54.6 | 51.0 |
| Industry of main post-graduation job (one-digit NAICS 2012 code) | |||
| Agriculture, forestry, fishing and hunting | 0.4 | 0.7 | 1.2 |
| Mining, quarrying, and oil and gas extraction; utilities; and construction | 0.9 | 0.5 | 0.0 |
| Manufacturing | 3.5 | 1.9 | 2.0 |
| Wholesale trade, retail trade, and transportation and warehousing | 3.1 | 4.0 | 1.8 |
| Information and cultural industries; finance and insurance; real estate and rental and leasing; professional, scientific and technical services; management of companies and enterprises; and administrative and support, waste management and remediation services | 14.8 | 12.9 | 19.6 |
| Educational services, and health care and social assistance | 22.6 | 29.1 | 33.4 |
| Arts, entertainment and recreation, and accommodation and food services | 25.2 | 30.1 | 25.8 |
| Other services (except public administration) | 9.0 | 8.5 | 7.0 |
| Public administration | 3.0 | 3.7 | 3.0 |
| Unknown | 17.6 | 8.7 | 6.2 |
|
Notes: CIP stands for Classification of Instructional Programs and NAICS stands for North American Industry Classification System. Sources: Statistics Canada, Postsecondary Student Information System, Longitudinal Worker File and T1 Family File. |
|||
The distribution of fields of study, generally, did not vary much by type of job match for women. In particular, the percentage of women enrolled in architecture, engineering, and related technologies (a rare choice for them) was about the same regardless of the type of job match (unlike men). However, as was the case for men, women with no student job were considerably more likely to be enrolled in physical and life sciences and technologies. In addition, women with a student job (whether retained or not) were somewhat more likely to have enrolled in health and related fields (a popular choice among women) compared with women with no student job. Women whose student job was retained were considerably more likely to be employed, as a graduate, in a large firm (with 500 or more employees) compared with other female graduates. They were also more likely than all other groups of women to land a post-graduation job in mining, quarrying, and oil and gas extraction; utilities; and construction. They were less likely to be employed in educational services, and health care and social assistance.
Do the differences in socioeconomic and job characteristics presented in tables 1 and 2 matter for the relationship between graduate earnings and the type of match between the student and post-graduation job? To answer this question, median earnings regressions were estimated, and the results are shown in tables 3 and 4.
The analysis begins with results for men in Table 3. The descriptive results from Chart 2 appear in Model 1 (consisting of a median regression of earnings on the type of job match and no other covariates). The omitted category consists of men with no student job, and the coefficients associated with the other categories refer to the estimated differences in median earnings between those other categories and the reference category. Median earnings were much higher among those with a student job. Furthermore, median earnings were somewhat higher among those who retained their student job compared with those who did not retain their student job.
| Model 1: No covariates | Model 2: Socioeconomic covariates added | Model 3: Job covariates added | ||||
|---|---|---|---|---|---|---|
| coefficient | standard error | coefficient | standard error | coefficient | standard error | |
| Type of job held while completing a bachelor's degree | ||||||
| Student job retained after graduation | 18,366Note *** | 1,654 | 12,902Note *** | 1,352 | 10,317Note *** | 1,231 |
| Student job not retained after graduation | 13,334Note *** | 1,597 | 8,035Note *** | 1,299 | 5,399Note *** | 1,180 |
| No student job | Table 3 Note ‡ | Table 3 Note ‡ | Table 3 Note ‡ | Table 3 Note ‡ | Table 3 Note ‡ | Table 3 Note ‡ |
| Parental income quintile | ||||||
| Bottom | Table 3 Note ‡ | Table 3 Note ‡ | Table 3 Note ‡ | Table 3 Note ‡ | Table 3 Note ‡ | Table 3 Note ‡ |
| Second | Table 3 Note ‡ | Table 3 Note ‡ | -275 | 829 | 471 | 753 |
| Third | Table 3 Note ‡ | Table 3 Note ‡ | 1,488Tableau 3 Note † | 831 | 1,539Note * | 755 |
| Fourth | Table 3 Note ‡ | Table 3 Note ‡ | 2,297Note ** | 819 | 2,490Note *** | 746 |
| Top | Table 3 Note ‡ | Table 3 Note ‡ | 2,460Note ** | 826 | 2,908Note *** | 752 |
| Field of study (CIP 2011 primary groupings) | ||||||
| Visual and performing arts, and communications technologies | Table 3 Note ‡ | Table 3 Note ‡ | Table 3 Note ‡ | Table 3 Note ‡ | Table 3 Note ‡ | Table 3 Note ‡ |
| Humanities | Table 3 Note ‡ | Table 3 Note ‡ | -791 | 1,966 | -1,134 | 1,831 |
| Social and behavioural sciences and law | Table 3 Note ‡ | Table 3 Note ‡ | 9,798Note *** | 1,759 | 2,706 | 1,659 |
| Business, management and public administration | Table 3 Note ‡ | Table 3 Note ‡ | 22,862Note *** | 1,722 | 10,756Note *** | 1,653 |
| Physical and life sciences and technologies | Table 3 Note ‡ | Table 3 Note ‡ | 1,630 | 1,863 | -359 | 1,758 |
| Mathematics, computer and information sciences | Table 3 Note ‡ | Table 3 Note ‡ | 31,152Note *** | 2,079 | 16,468Note *** | 1 968 |
| Architecture, engineering, and related technologies | Table 3 Note ‡ | Table 3 Note ‡ | 32,237Note *** | 1,780 | 19,415Note *** | 1,732 |
| Agriculture, natural resources and conservation | Table 3 Note ‡ | Table 3 Note ‡ | 11,016Note *** | 2,492 | 2,696 | 2,345 |
| Health and related fields | Table 3 Note ‡ | Table 3 Note ‡ | 9,530Note *** | 1,887 | 5,279Note ** | 1,829 |
| Personal, protective and transportation services | Table 3 Note ‡ | Table 3 Note ‡ | 15,666Note *** | 3,092 | 10,895Note *** | 2,866 |
| Other (including education) | Table 3 Note ‡ | Table 3 Note ‡ | 18,536Note *** | 2,533 | 9,156Note *** | 2,618 |
| Firm size of main post-graduation job (number of employees) | ||||||
| Fewer than 5 | Table 3 Note ‡ | Table 3 Note ‡ | Table 3 Note ‡ | Table 3 Note ‡ | Table 3 Note ‡ | Table 3 Note ‡ |
| 5 to fewer than 20 | Table 3 Note ‡ | Table 3 Note ‡ | Table 3 Note ‡ | Table 3 Note ‡ | 9,579Note *** | 1,232 |
| 20 to fewer than 50 | Table 3 Note ‡ | Table 3 Note ‡ | Table 3 Note ‡ | Table 3 Note ‡ | 11,454Note *** | 1,260 |
| 50 to fewer than 100 | Table 3 Note ‡ | Table 3 Note ‡ | Table 3 Note ‡ | Table 3 Note ‡ | 13,413Note *** | 1,323 |
| 100 to fewer than 200 | Table 3 Note ‡ | Table 3 Note ‡ | Table 3 Note ‡ | Table 3 Note ‡ | 13,436Note *** | 1,358 |
| 200 to fewer than 500 | Table 3 Note ‡ | Table 3 Note ‡ | Table 3 Note ‡ | Table 3 Note ‡ | 15,585Note *** | 1,339 |
| 500 or more | Table 3 Note ‡ | Table 3 Note ‡ | Table 3 Note ‡ | Table 3 Note ‡ | 16,947Note *** | 1,135 |
| Intercept | 31,808Note *** | 1,548 | 20,779Note *** | 3,014 | 13,476Note *** | 3,791 |
Sources: Statistics Canada, Postsecondary Student Information System, Longitudinal Worker File and T1 Family File. |
||||||
After accounting for the differences in socioeconomic covariates and job characteristics described in Table 1, the gap in median earnings between graduates with and those without a student job narrowed considerably. Specifically, male bachelor’s degree graduates who retained their student job earned $18,366 more than their counterparts with no student job (Model 1), but $12,902 more after accounting for differences in socioeconomic characteristics (Model 2), and $10,317 more after also accounting for differences in job characteristics (Model 3).
Similarly, male bachelor’s degree graduates who did not retain their student job earned $13,334 more than their counterparts with no student job (Model 1), but $8,035 more after accounting for differences in socioeconomic characteristics (Model 2), and $5,399 more after also accounting for differences in job characteristics (Model 3).
The smaller differences in earnings described above are the result of differences in the socioeconomic and job characteristics between graduates with a student job and those without, as well as the strong correlations between these covariates and graduate earnings. In Model 2, for example, men with parents in the top income quintile earned $2,460 more than their counterparts with parents in the bottom income quintile. Similarly, men whose parents were in the fourth income quintile earned $2,297 more than those whose parents were in the bottom income quintile. Table 1 showed that individuals who did not have a student job were far more likely to have parents whose income was in the bottom quintile. These differences could reflect network or ability effects. Earnings also varied by field of study, which could also reflect ability effects (through human capital development) or signalling effects (through credential or “sheepskin” effects). Other factors, such as age at the beginning of the program, start year of the program, and institution fixed effects, were also included in the models. However, the coefficients associated with these factors are not shown here (they are available upon request). Results from Model 3 show that firm size is also an important determinant of earnings (with earnings increasing with firm size), as is the industry in which graduates are employed (the latter results are available upon request).
In contrast, the gap in median earnings between men who retained their student job and those who did not remained more or less the same across all three models, when more covariates are introduced (around $5,000, which was statistically significant at 5%, in Model 1, and at 1%, in models 2 and 3). This could partly be explained by the fact that socioeconomic and job characteristics are more similar between these two groups (Table 1).
The results for women (in Table 4) are very similar to those for men (in Table 3), and the main highlights will not be repeated. One notable difference, however, is that the conditional earnings difference between women who retained their student job and those who did not was much smaller compared with men (about $2,000 in all three models). Furthermore, the gap is only statistically significant in Model 3 (at 10%).
| Model 1: No covariates | Model 2: Socioeconomic covariates added | Model 3: Job covariates added | ||||
|---|---|---|---|---|---|---|
| coefficient | standard error | coefficient | standard error | coefficient | standard error | |
| Type of job held while completing a bachelor's degree | ||||||
| Student job retained after graduation | 16,707Note *** | 1,544 | 11,301Note *** | 1,323 | 7,873Note *** | 1,009 |
| Student job not retained after graduation | 14,612Note *** | 1,503 | 9,319Note *** | 1,286 | 5,402Note *** | 979 |
| No student job | Table 4 Note ‡ | Table 4 Note ‡ | Table 4 Note ‡ | Table 4 Note ‡ | Table 4 Note ‡ | Table 4 Note ‡ |
| Parental income quintile | ||||||
| Bottom | Table 4 Note ‡ | Table 4 Note ‡ | Table 4 Note ‡ | Table 4 Note ‡ | Table 4 Note ‡ | Table 4 Note ‡ |
| Second | Table 4 Note ‡ | Table 4 Note ‡ | 243 | 691 | -257 | 527 |
| Third | Table 4 Note ‡ | Table 4 Note ‡ | 1,497Note * | 699 | 1,024Table 4 Note † | 533 |
| Fourth | Table 4 Note ‡ | Table 4 Note ‡ | 1,672Note * | 710 | 271 | 542 |
| Top | Table 4 Note ‡ | Table 4 Note ‡ | 1,634Note * | 739 | 904 | 564 |
| Field of study (CIP 2011 primary groupings) | ||||||
| Visual and performing arts, and communications technologies | Table 4 Note ‡ | Table 4 Note ‡ | Table 4 Note ‡ | Table 4 Note ‡ | Table 4 Note ‡ | Table 4 Note ‡ |
| Humanities | Table 4 Note ‡ | Table 4 Note ‡ | -61 | 1,397 | -1,829Table 4 Note † | 1,083 |
| Social and behavioural sciences and law | Table 4 Note ‡ | Table 4 Note ‡ | 4,221Note *** | 1,210 | -81 | 948 |
| Business, management and public administration | Table 4 Note ‡ | Table 4 Note ‡ | 19,694Note *** | 1,255 | 8,771Note *** | 1,003 |
| Physical and life sciences and technologies | Table 4 Note ‡ | Table 4 Note ‡ | -3,710Note ** | 1,347 | -6,470Note *** | 1,055 |
| Mathematics, computer and information sciences | Table 4 Note ‡ | Table 4 Note ‡ | 22,725Note *** | 2,585 | 11,932Note *** | 2,004 |
| Architecture, engineering, and related technologies | Table 4 Note ‡ | Table 4 Note ‡ | 29,615Note *** | 1,635 | 15,166Note *** | 1,347 |
| Agriculture, natural resources and conservation | Table 4 Note ‡ | Table 4 Note ‡ | 9,786Note *** | 1,852 | 1,996 | 1,465 |
| Health and related fields | Table 4 Note ‡ | Table 4 Note ‡ | 26,808Note *** | 1,257 | 9,542Note *** | 1,042 |
| Personal, protective and transportation services | Table 4 Note ‡ | Table 4 Note ‡ | 9,554Note *** | 2,571 | 2,345 | 1,983 |
| Other (including education) | Table 4 Note ‡ | Table 4 Note ‡ | 17,623Note *** | 1,572 | 10,899Note *** | 1,388 |
| Firm size of main post-graduation job (number of employees) | ||||||
| Fewer than 5 | Table 4 Note ‡ | Table 4 Note ‡ | Table 4 Note ‡ | Table 4 Note ‡ | Table 4 Note ‡ | Table 4 Note ‡ |
| 5 to fewer than 20 | Table 4 Note ‡ | Table 4 Note ‡ | Table 4 Note ‡ | Table 4 Note ‡ | 6,813Note *** | 921 |
| 20 to fewer than 50 | Table 4 Note ‡ | Table 4 Note ‡ | Table 4 Note ‡ | Table 4 Note ‡ | 8,685Note *** | 959 |
| 50 to fewer than 100 | Table 4 Note ‡ | Table 4 Note ‡ | Table 4 Note ‡ | Table 4 Note ‡ | 9,549Note *** | 1,021 |
| 100 to fewer than 200 | Table 4 Note ‡ | Table 4 Note ‡ | Table 4 Note ‡ | Table 4 Note ‡ | 10,148Note *** | 1,051 |
| 200 to fewer than 500 | Table 4 Note ‡ | Table 4 Note ‡ | Table 4 Note ‡ | Table 4 Note ‡ | 12,852Note *** | 1,021 |
| 500 or more | Table 4 Note ‡ | Table 4 Note ‡ | Table 4 Note ‡ | Table 4 Note ‡ | 14,019Note *** | 881 |
| Intercept | 23,473Note *** | 1,468 | 21,145Note *** | 2,495 | 19,982Note *** | 2,860 |
Sources: Statistics Canada, Postsecondary Student Information System, Longitudinal Worker File and T1 Family File. |
||||||
So far, the analysis has combined the results for all individuals who retained their student job. No distinction was made between student jobs that became the main post-graduation job and student jobs that became secondary jobs. The reason for not making this distinction in the main regressions, presented in tables 3 and 4, is that it is not always possible to identify main jobs with annual data. Nevertheless, the distinction is made in Table 5, which otherwise replicates Model 3. In the first set of results, where earnings from all post-graduation jobs are considered, men and women who retained their student job as a main job (based on annual earnings), after graduating from a bachelor’s degree program, earned more than their counterparts who retained their student job as a secondary job. In the case of men, the difference is $5,136 (statistically significant at 1%) while, for women, it is $3,719 (statistically significant at 5%).
| Men | Women | |||||||
|---|---|---|---|---|---|---|---|---|
| Earnings from all post-graduation jobs | Earnings from main post-graduation job | Earnings from all post-graduation jobs | Earnings from main post-graduation job | |||||
| coefficient | standard error | coefficient | standard error | coefficient | standard error | coefficient | standard error | |
| Type of job held while completing a bachelor's degree | ||||||||
| Student job retained as main job after graduation | 11,323Note *** | 1,243 | 11,674Note *** | 1,297 | 9,406Note *** | 1,017 | 9,503Note *** | 1,140 |
| Student job retained as secondary job after graduation | 6,187Note *** | 1,449 | 137 | 1,512 | 5,687Note *** | 1,079 | 783 | 1,211 |
| Student job not retained after graduation | 5,227Note *** | 1,168 | 5,062Note *** | 1,219 | 5,475Note *** | 962 | 4,909Note *** | 1,079 |
| No student job | Table 5 Note ‡ | Table 5 Note ‡ | Table 5 Note ‡ | Table 5 Note ‡ | Table 5 Note ‡ | Table 5 Note ‡ | Table 5 Note ‡ | Table 5 Note ‡ |
| Intercept | 15,883Note *** | 3,754 | 12,275Note ** | 3,916 | 21,357Note *** | 2,812 | 19,263Note *** | 3,154 |
† significantly different from reference category (p < 0.10) Notes: Regression covariates also include age at beginning of program, start year of program, institution fixed effects, firm size, and four-digit North American Industry Classification System (NAICS 2012) code. Sources: Statistics Canada, Postsecondary Student Information System, Longitudinal Worker File and T1 Family File. |
||||||||
The exercise is then repeated by looking at only the earnings from the main post-graduation job. In this case, retaining a student job as a main job is associated with much higher median earnings than retaining a student job as a secondary job. For men, the difference is $11,538, while for women, it is $8,720 (both statistically significant at 0.1%). In essence, retaining a student job as a secondary job is almost equivalent to having no student job with respect to the earnings of the main job.
The approach so far has been to account for job characteristics following graduation. This is because of the inclusion of individuals who held no student job. However, when comparing graduates who retained their student job with those who did not retain their student job, it is important to account for job characteristics of the student job. By doing so, the question becomes, “Do students earn more after graduation when they retain their student job compared to their counterparts who held a similar student job but did not retain it after graduation?” To answer this question, a separate analysis was performed exclusively on individuals who held exactly one student job, whereby the firm size and industry of the student job where included in the models. The results were quite similar to those in Table 5, and are available upon request.
Conclusion
Does holding a student job help one’s career later on, particularly if the student remains in the firm after graduation? This question may be more relevant now than ever before, because the COVID‑19 pandemic and subsequent lockdown have led to historically high youth unemployment rates in recent months. The purpose of this study was to estimate the relationship between post-graduation labour market outcomes and the type of match between the student job and the post-graduation job.
The study finds that after accounting for differences in detailed socioeconomic characteristics (parental income quintile, field of study and postsecondary institution fixed effects) and post-graduation job characteristics (industry and firm size), graduates who retained their student job earned $4,918 (men) and $2,471 (women) more, two years after graduation, than graduates who did not retain their student job, and $10,317 (men) and $7,873 (women) more than those who did not have a student job. Graduates who retained their student job were also more likely to have an employer-sponsored pension plan and to pay union dues than graduates who did not retain their student job or who did not have a student job.
Although some students may accept jobs while in school simply to cover their current educational and living expenses, the results highlighted here suggest that there may be long-term implications for their student job search. Indeed, having worked in the same firm as a student is associated with higher earnings after graduation, perhaps because that firm already had an opportunity to observe the student’s productivity. In essence, graduates in these circumstances may begin their careers with an advantage over other graduates who also worked while in school, but at a different firm after graduation.
References
Card, D., T. Lemieux, and W.C. Riddell. 2003. Unionization and Wage Inequality: A Comparative Study of the U.S., the U.K., and Canada. Working Paper Series, no. 9473. Cambridge, Massachusetts: National Bureau of Economic Research.
Co-operative Education and Work-Integrated Learning Canada. 2019. What Is WIL? Available at: https://cewilcanada.ca/CEWIL/About%20Us/Work-Integrated-Learning/CEWIL/About-Us/Work-Integrated-Learning.aspx?hkey=ed772be2-00d0-46cd-a5b8-873000a18b41 (accessed March 17, 2021).
Darch, J. 1995. “Labour market outcomes for university co-op graduates.” Perspectives on Labour and Income, vol. 7, no. 3, pp. 20-24. Statistics Canada Catalogue no. 75-001-E.
Frenette, M. 2000. “Overqualified? Recent graduates and the needs of their employers.” Education Quarterly Review, vol. 7, no. 1, pp. 6-20. Statistics Canada Catalogue no. 81-003-X.
Frenette, M. 2007. Why Are Youth from Lower-income Families Less Likely to Attend University? Evidence from Academic Abilities, Parental Influences, and Financial Constraints. Analytical Studies Branch Research Paper Series, no. 295. Statistics Canada Catalogue no. 11F0019M. Ottawa: Statistics Canada.
Frenette, M. 2019. Obtaining a Bachelor’s Degree from a Community College: Earnings Outlook and Prospects for Graduate Studies. Analytical Studies Branch Research Paper Series, no. 428. Statistics Canada Catalogue no. 11F0019M. Ottawa: Statistics Canada.
Frenette, M., D. Messacar, and T. Handler. 2020. Potential Earnings Losses Among High School and Postsecondary Graduates Due to the COVID-19 Economic Downturn. Economic Insights, no. 114. Statistics Canada Catalogue no. 11-626-X. Ottawa: Statistics Canada.
Galarneau, D., M. Kinack, and G. Marshall. 2020. Work-integrated Learning During Postsecondary Studies, 2015 Graduates. Insights on Canadian Society, no. 114. Statistics Canada Catalogue no. 75‑006‑X. Ottawa: Statistics Canada.
Martin, S., and B. Rouleau. 2020. An Exploration of Work, Learning, and Work-integrated Learning in Canada Using the Longitudinal and International Study of Adults. Longitudinal and International Study of Adults Research Paper Series. Statistics Canada Catalogue no. 89-648-X. Ottawa: Statistics Canada.
Rodriguez, C., J. Zhao, and S.J. Ferguson. 2016. Co-op Participation of College and Bachelor’s Graduates. Insights on Canadian Society. Statistics Canada Catalogue no. 75-006-X. Ottawa: Statistics Canada.
Statistics Canada. Table 14-10-0287-03 Labour Force Characteristics by Province, Monthly, Seasonally Adjusted. Available at: https://doi.org/10.25318/1410028701-eng (accessed March 17, 2021).
Walters, D., and D. Zarifa. 2008. “Earnings and employment outcomes for male and female postsecondary graduates of coop and non-coop programmes.” Journal of Vocational Education and Training, vol. 60, no. 4: pp. 377–399.
Wang, S. 2017. Labour Market Outcome Differences Between Co-op and Non-co-op Graduates. Economic Policy Directorate working paper. Ottawa: Employment and Social Development Canada.
- Date modified: