
Economic and Social Reports
Impacts of the COVID-19 pandemic on productivity growth in Canada
by Weimin Wang
DOI: https://doi.org/10.25318/36280001202100500004-eng
Abstract
This Insights article examines the growth in labour productivity in Canada and its sources, by industry, during the COVID-19 pandemic. The findings of this paper show that strong labour productivity growth in the Canadian business sector is largely a result of the structural changes during the pandemic towards industries that carry out a larger share of essential activities. The findings also show that, in 2020, labour productivity can be visualized in the shape of an inverted V. In the early months of the pandemic, hours worked declined more rapidly than output, and when the economy reopened, hours worked rose faster than output. Industries with large gains in productivity during the lockdowns in the early months of the pandemic also experienced large losses when the economy reopened. One possible permanent change associated with the pandemic is the widespread adoption of work-from-home arrangements. However, no conclusive evidence was found to show that working from home increases or reduces industry productivity performance.
Author
Weimin Wang is with the Economic Analysis Division, Analytical Studies Branch at Statistics Canada.
Introduction
The COVID-19 pandemic has changed many aspects of daily life. It will transform the economy and disrupt every business, as summarized in Stackhouse (2020). There have already been two major changes in the way production occurs in the economy. One is the full or partial cessation of non-essential production activities, such as travel, hospitality, arts and entertainment, personal services, and airlines, to help slow down the spread of COVID-19. The other is the widespread shift from in-office work to working from home (WFH), enforced by COVID-19-related lockdowns and stay-at-home restrictions. According to Statistics Canada (2020a), during the week of March 22 to 28, 39.1% of employees were WFH, 38.5% of them were working at locations other than home, and 22.4% were absent from their jobs. A more recent study by Mehdi and Morissette (2021) reports that, at the beginning of 2021, 32% of Canadian employees aged 15 to 69 worked most of their hours from home.
These changes could have implications on the productivity performance of an economy. The impact of the shift to essential production activities on the overall productivity performance of the economy can be estimated by comparing the relative productivity levels of essential activities and non-essential activities. In general, essential production activities (e.g., most manufacturing activities and financial services) are more productive than non-essential activities (e.g., hospitality and personal services). Therefore, ceasing non-essential production activities is expected to lead to an increase in aggregate productivity in the economy.
Shifting to WFH during the pandemic has changed the working lives of Canadians, not only in the way people interact virtually with their teams and with IT systems, but also in how people spend their working days. Data from the Canadian Survey on Business Conditions, conducted from mid-September to late October 2020, suggest that “teleworking and working remotely have become more prevalent since the start of the pandemic. Over one-third (35.3%) of businesses reported that teleworking or working remotely was a possibility for their employees. Of these businesses, over one-quarter (27.2%) reported that all of their workforce was teleworking or working remotely on August 31, 2020. Once the pandemic is over, 14.7% of businesses anticipate that all of their workforce will continue to primarily telework or work remotely” (Statistics Canada 2020b).
This paper finds that the Canadian business sector experienced strong labour productivity growth, the second highest since 1981, and the contribution of structural changes towards industries with a larger share of essential activities is substantial. This paper also shows that labour productivity in 2020 could be viewed as an inverted V shape because of the faster adjustment in hours worked than in output. In addition, industries with large gains in productivity during the lockdown also experienced large losses when the economy reopened. One possible permanent change associated with the pandemic is the widespread adoption of the WFH arrangement. However, no evidence was found that WFH promotes or reduces industry productivity performance. There is little correlation between an industry’s capacity for telework in 2019 and industry labour productivity growth in 2020.
Labour productivity growth in Canada before and during the COVID-19 pandemic
The notion of productivity captures how efficiently the production system transforms inputs into outputs. Output (either real gross domestic product [GDP] or real gross output) per unit of labour input (either number of workers or hours worked), or labour productivity, is the most popular partial measure of productivity.
Chart 1 depicts real GDP, hours worked and labour productivity in the Canadian business sector since the first quarter of 2018. As is shown, all three variables are more volatile in 2020 than in previous years. Both GDP and hours worked declined substantially in the first two quarters of 2020, because of the closure of non-essential businesses and travel restrictionsNote in response to the COVID-19 pandemic. The economy recovered partially in the second half of 2020 as many businesses reopened. Labour productivity moved in the opposite direction of GDP and hours worked, because adjustments in hours worked were much larger than those in GDP. Labour productivity increased by 5.5% in the first quarter of 2020 and by 12.4% in the second quarter, and decreased by 10.6% in the third quarter and by 2.0% in the fourth quarter. Labour productivity increased by 3.8% from the fourth quarter of 2019 to the fourth quarter of 2020, the second-highest increase since 1981.Note

Data table for Chart 1
| Time | Q1 2018 | Q2 2018 | Q3 2018 | Q4 2018 | Q1 2019 | Q2 2019 | Q3 2019 | Q4 2019 | Q1 2020 | Q2 2020 | Q3 2020 | Q4 2020 |
|---|---|---|---|---|---|---|---|---|---|---|---|---|
| index (2012=100) | ||||||||||||
| Real gross domestic product | 112.242 | 112.799 | 113.783 | 113.837 | 113.786 | 115.210 | 115.691 | 115.669 | 112.867 | 97.006 | 107.694 | 110.402 |
| Hours worked | 105.692 | 105.860 | 106.346 | 106.835 | 106.369 | 107.182 | 107.103 | 107.155 | 99.090 | 75.806 | 94.178 | 98.503 |
| Labour productivity | 106.197 | 106.556 | 106.993 | 106.554 | 106.973 | 107.490 | 108.019 | 107.946 | 113.904 | 127.967 | 114.351 | 112.079 |
| Source: Statistics Canada table 36-10-0206. | ||||||||||||
The impact of the pandemic on productivity was quite different across industries, since businesses in different industries acted and reacted differently during the COVID-19 pandemic. Charts 2 and 3 present real GDP growth and growth in hours worked, by industry, for the first and second halves of 2020. As shown in the charts, industries with a large decline in real GDP and hours worked in the first half of 2020 also rebounded substantially in the second half of 2020. These industries are more vulnerable to lockdowns and more affected by reopening policies, as a large share of business activities in these industries is considered non-essential.

Data table for Chart 2
| Industry by NAICS code | First half of 2020 | Second half of 2020 |
|---|---|---|
| percent | ||
| Arts, entertainment (71) | -58.6 | 23.0 |
| Accommodation, food (72) | -55.1 | 42.2 |
| Transportation, warehousing (48–49) | -30.7 | 15.2 |
| Other business services (61, 62, 81) | -26.0 | 25.5 |
| Administrative services (56) | -24.1 | 19.8 |
| Manufacturing (31–33) | -20.3 | 19.6 |
| Retail trade (44–45) | -14.0 | 20.3 |
| Wholesale trade (41) | -13.6 | 19.1 |
| Mining (21) | -12.8 | 5.0 |
| Construction (23) | -11.5 | 10.5 |
| Professional services (54) | -10.0 | 10.3 |
| Real estate (53) | -9.6 | 14.1 |
| Information (51) | -6.7 | 6.0 |
| Utilities (22) | -3.0 | -0.4 |
| Finance and insurance (52, 55) | -0.5 | 3.8 |
| Agriculture (11) | 0.8 | 6.2 |
|
Note: NAICS = North American Industry Classification System. Source: Author's calculations based on Statistics Canada table 36-10-0207. |
||

Data table for Chart 3
| Industry by NAICS code | First half of 2020 | Second half of 2020 |
|---|---|---|
| percent | ||
| Accommodation, food (72) | -60.3 | 70.1 |
| Arts, entertainment (71) | -58.1 | 68.2 |
| Real estate (53) | -37.4 | 41.6 |
| Other business services (61, 62, 81) | -35.2 | 43.0 |
| Construction (23) | -34.0 | 40.8 |
| Administrative services (56) | -29.9 | 28.3 |
| Agriculture (11) | -29.5 | 31.3 |
| Retail trade (44–45) | -26.9 | 30.1 |
| Transportation, warehousing (48–49) | -26.2 | 22.8 |
| Manufacturing (31–33) | -24.6 | 25.3 |
| Wholesale trade (41) | -22.5 | 22.1 |
| Information (51) | -20.6 | 24.5 |
| Professional services (54) | -20.3 | 24.3 |
| Mining (21) | -20.2 | 12.6 |
| Utilities (22) | -12.8 | 9.5 |
| Finance and insurance (52, 55) | -12.2 | 13.4 |
|
Note: NAICS = North American Industry Classification System. Source: Author's calculations based on Statistics Canada table 36-10-0207. |
||
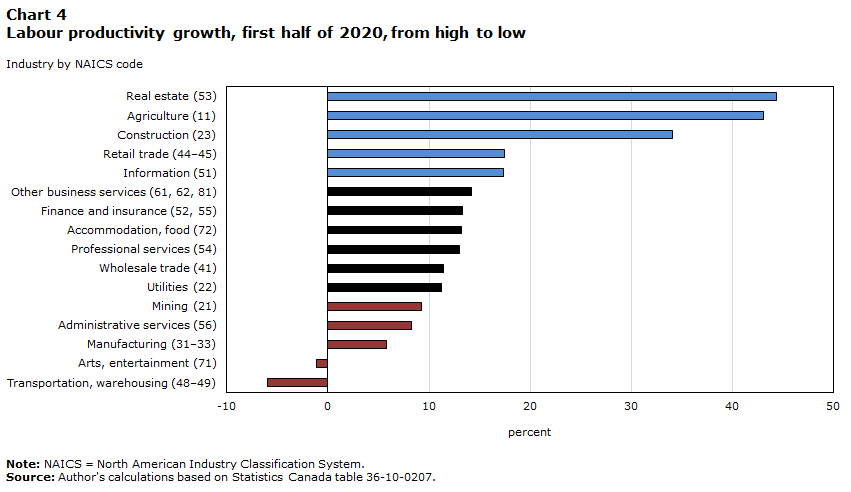
For the business sector, greater adjustments in hours worked than in output in response to lockdowns and reopening policies led to an increase in labour productivity in the first half of 2020 and to a decline in labour productivity in the second half of 2020. Also, significant changes in industry output and hours worked caused an even greater divergence in productivity growth at an industry level. Chart 4 shows that, during the first half of 2020, labour productivity increased in all but two industries. Labour productivity growth over that period ranged from an increase of 44.4% in real estate and rental and leasing (North American Industry Classification System [NAICS] 53) to a decline of 6.0% in transportation and warehousing (NAICS 48–49). In the second half of 2020, labour productivity decreased in all industries (Chart 5). The labour productivity growth over this period ranged from a decline of 2.5% in wholesale trade (NAICS 41) to a decline of 26.9% in arts, entertainment and recreation (NAICS 71). Similar to the rankings for real GDP growth and growth in hours worked, industries that experienced substantial positive labour productivity growth in the first half of 2020 also experienced significant negative labour productivity growth in the second half of 2020, with one exception. Chart 4 also shows that, in terms of labour productivity growth in the first half of 2020, three industries among the top five (in blue) moved to among the bottom five industries in the second half of 2020 (Chart 5). These industries are real estate and rental and leasing (NAICS 53); agriculture, forestry, fishing and hunting (NAICS 11); and construction (NAICS 23). Also, in Chart 4, four of the bottom five industries (in red) in the first half of 2020 moved to among the top five in the second half of 2020 (Chart 5). These industries are manufacturing (NAICS 31–33); transportation and warehousing (NAICS 48–49); administrative and support, waste management and remediation services (NAICS 56); and mining, quarrying, and oil and gas extraction (NAICS 21). The exception is arts, entertainment and recreation (NAICS 71). Its labour productivity growth ranked second last in the first half of 2020 and last in the second half of 2020.
Data table for Chart 4
| Industry by NAICS code | First half of 2020 |
|---|---|
| percent | |
| Real estate (53) | 44.4 |
| Agriculture (11) | 43.1 |
| Construction (23) | 34.1 |
| Retail trade (44–45) | 17.5 |
| Information (51) | 17.4 |
| Other business services (61, 62, 81) | 14.2 |
| Finance and insurance (52, 55) | 13.3 |
| Accommodation, food (72) | 13.2 |
| Professional services (54) | 13.0 |
| Wholesale trade (41) | 11.4 |
| Utilities (22) | 11.2 |
| Mining (21) | 9.3 |
| Administrative services (56) | 8.3 |
| Manufacturing (31–33) | 5.8 |
| Arts, entertainment (71) | -1.1 |
| Transportation, warehousing (48–49) | -6.0 |
|
Note: NAICS = North American Industry Classification System. Source: Author's calculations based on Statistics Canada table 36-10-0207. |
|

Data table for Chart 5
| Industry by NAICS code | Second half of 2020 |
|---|---|
| percent | |
| Arts, entertainment (71) | -26.9 |
| Construction (23) | -21.6 |
| Real estate (53) | -19.4 |
| Agriculture (11) | -19.1 |
| Accommodation, food (72) | -16.4 |
| Information (51) | -14.8 |
| Other business services (61, 62, 81) | -12.2 |
| Professional services (54) | -11.3 |
| Utilities (22) | -9.0 |
| Finance and insurance (52, 55) | -8.5 |
| Retail trade (44, 45) | -7.5 |
| Mining (21) | -6.7 |
| Administrative services (56) | -6.6 |
| Transportation, warehousing (48–49) | -6.2 |
| Manufacturing (31–33) | -4.5 |
| Wholesale trade (41) | -2.5 |
|
Note: NAICS = North American Industry Classification System. Source: Author's calculations based on Statistics Canada table 36-10-0207. |
|
Working from home and productivity performance
WFH may improve or hamper business productivity performance. First, not all industries can accommodate remote work. As discussed by Deng, Morissette and Messacar (2020), telework capacity varies substantially across industries, from 85% of all jobs in finance and insurance, 85% in educational services, and 84% in professional, scientific and technical services, to 6% in accommodation and food services, and 4% in agriculture, forestry, fishing and hunting. Second, for industries with a high telework capacity, there are two main ways in which WFH can affect business productivity (OECD 2020). The first is the potential for an increase or a decrease in worker efficiency. WFH may increase worker efficiency because of better work–life balance, less commuting and fewer distractions, all of which lead to more focused work. WFH may also, however, reduce worker efficiency because of a lack of communication, knowledge flow and managerial oversight. The second way is the potential effect of directly lowering capital and labour costs. WFH reduces company demand for office space and equipment and enlarges the pool of workers firms can choose from, hence reducing hiring costs.Note As a result, the overall impact of WFH on business productivity performance is ambiguous and depends on the relative strength of those potential positive and negative effects.
Empirical evidence in the literature along these lines is limited. Bloom et al. (2015) conducted one important study on the productivity effect of WFH. This study highlights the benefits of learning and selection effects when adopting modern management practices such as WFH. Based on a well-designed control trial of a travel company, WFH led to a significant improvement in the productivity of the company.Note There are also some survey results related to the impact of WFH on productivity during the COVID-19 pandemic. Dahik et al. (2020) show that, despite both the speed and the scale of the shift to remote working, 75% of employees surveyed by the Boston Consulting Group reported having either maintained or improved their perceived productivity on individual tasks (such as analyzing data, writing presentations or executing administrative tasks) during the first few months of the COVID-19 pandemic.Note Based on a survey of 500 IT professionals at companies of at least 1,000 employees in the United States, Canada, Germany, France, Ireland and the United Kingdom, Sectigo (2020) reveals that almost half of IT professionals (49%) saw an increase in employee productivity at their company during widespread remote working, and 35% felt that productivity remained consistent even after the initial set-up. It is also reported that increased productivity is especially common at companies with fewer than 10,000 employees (52%), compared with bigger companies (39%). Reports by Aternity (2020a, 2020b, 2020c) summarize findings from the Global Remote Work Productivity Tracker.Note They show that the shift to remote work has had opposite effects in Canada and in other countries. Overall productivity (as measured by hours of work computing time) in Canada dropped 75% for in-office work but increased 170% for remote work, resulting in a 25% increase in productivity overall. At the same time, the United States saw a 7.2% drop, and Europe saw an 8.2% drop in overall productivity.
However, in a recent interview, Nick Bloom, who previously identified the productivity gains of WFH in Bloom et al. (2015) said that WFH may lead to a decrease in productivity during the COVID-19 pandemic, simply because people are home working alongside their children, in unsuitable spaces, with no choice and no in-office days (Gorlick 2020). The World Economic Forum (2020) reports that the majority of business leaders surveyed (78%) expect some negative impact of WFH on productivity, with 22% expecting a strong negative impact and 15% believing that WFH will have either no impact or a positive impact on productivity. The possible reasons for this scepticism that were identified in the report are similar to what Nick Bloom has pointed out.
Mehdi and Morissette (2021) examined productivity performance of new teleworkers in Canada, based on the Labour Force Survey supplement of January 2021. Their study reports that 32% of new teleworkers are more productive than before, and 58% are as productive as before. The likelihood of being more productive varies across industries, from 45% in health care and social assistance to 31% in goods-producing industries and 25% in educational services. The study also reports that the major barriers of WFH to productivity are lacking interaction with co-workers, caring for children and needing to do more work to get things done.
The aforementioned empirical evidence on the productivity impact of WFH is mostly qualitative and survey-based, either from an employee’s perspective or from an employer’s perspective. When considering the industry-level data in this article, one question that could be asked is whether the cross-industry differences in labour productivity growth in 2020 are related to the cross-industry differences in the prevalence of WFH. A simple correlation between the growth in industry labour productivity in 2020 and industry telework capacity in 2019Note was calculated, and the result shows that there is no correlation between the two series, suggesting that industries with higher telework capacity did not necessarily grow faster in labour productivity in 2020. It may be the case that some of the potential cost savings related to less demand for office space and equipment have not yet been realized as businesses assess their post-pandemic telework policies, or that workers and managers need more time to adjust given the suddenness of the shift to telework. Cross-industry differences in labour productivity growth may be also be dominated by other factors, such as the mix of essential and non-essential activities within the broad industries and industry-specific opportunities to adopt other digital technologies (e.g., online sales platforms) to mitigate the impact of social distancing restrictions.
Impact of the shift towards essential activities
The Canadian business sector has also experienced extensive structural changes in industries in 2020 as a result of the changing restrictions on non-essential business activities. To understand the impact of these industry-level changes on aggregate productivity growth, aggregate labour productivity growth was decomposed into two components: the within-industry effect that is the weighted sum of industry labour productivity growth rates and the structural-change effect that depends on the changes in the contribution of each industry’s share of hours worked in the economy. Each industry contributes to aggregate labour productivity growth through these two components.
| Hours worked | Real gross domestic product | |||
|---|---|---|---|---|
| percentage points | percent | percentage points | percent | |
| Agriculture, forestry, fishing and hunting (11) | 0.02 | 0.60 | 0.35 | 11.80 |
| Mining, quarrying, and oil and gas extraction (21) | -0.05 | -2.30 | -0.46 | -4.40 |
| Utilities (22) | 0.03 | 3.80 | 0.02 | 0.80 |
| Construction (23) | 0.12 | 1.10 | 0.20 | 2.00 |
| Manufacturing (31–33) | 0.33 | 2.70 | -0.06 | -0.40 |
| Wholesale trade (41) | 0.18 | 2.90 | 0.50 | 7.30 |
| Retail trade (44–45) | 0.43 | 3.50 | 0.53 | 7.90 |
| Transportation and warehousing (48–49) | -0.10 | -1.50 | -0.99 | -16.60 |
| Information and cultural industries (51) | 0.18 | 7.50 | 0.14 | 3.20 |
| Finance, insurance, and holding companies (52, 55) | 0.57 | 8.30 | 0.75 | 7.80 |
| Real estate and rental and leasing (53) | -0.09 | -3.50 | 0.47 | 7.70 |
| Professional, scientific and technical services (54) | 0.69 | 7.80 | 0.30 | 3.60 |
| Administrative and support, waste management and remediation services (56) | -0.14 | -2.20 | -0.18 | -5.10 |
| Arts, entertainment and recreation (71) | -0.41 | -23.40 | -0.41 | -46.90 |
| Accommodation and food services (72) | -1.85 | -26.60 | -0.98 | -33.30 |
| Other business-sector services (61, 62, 81) | 0.08 | 0.80 | -0.18 | -3.00 |
| Source: Author’s calculations based on Statistics Canada tables 36-10-0207 and 36-10-0480. | ||||
Table 1 presents changes in industry shares of hours worked and real GDP, from the fourth quarter of 2019 to the fourth quarter of 2020. The top three industries by share of percentage-point gain in hours worked are professional, scientific and technical services (NAICS 54); finance, insurance and holding companies (NAICS 52, 55); and retail trade (NAICS 41). Their share of hours worked increased by 0.69, 0.57 and 0.43 percentage points, respectively, from the fourth quarter of 2019 to the fourth quarter of 2020. During the same period, the share of hours worked dropped by 1.85 percentage points (or 26.6%) in accommodation and food services (NAICS 72), and by 0.41 percentage points (or 23.4%) in arts, entertainment and recreation (NAICS 71). For the real GDP share, the largest declines were in arts, entertainment and recreation (NAICS 71); accommodation and food services (NAICS 72); and transportation and warehousing (NAICS 48–49). Their real GDP share decreased by 46.9%, 33.3% and 16.6%, respectively, from the fourth quarter of 2019 to the fourth quarter of 2020. The large loss of output shares in these industries results from the travel restrictions and the closure of non-essential businesses during the pandemic.
| Within-industry effect | Structural-change effect | Total | |
|---|---|---|---|
| percent | |||
| Agriculture, forestry, fishing and hunting (11) | 11.10 | 0.50 | 11.60 |
| Mining, quarrying, and oil and gas extraction (21) | 4.90 | -5.90 | -1.00 |
| Utilities (22) | 0.80 | 2.50 | 3.30 |
| Construction (23) | 11.90 | 2.60 | 14.50 |
| Manufacturing (31–33) | 3.30 | 8.50 | 11.80 |
| Wholesale trade (41) | 14.20 | 5.20 | 19.40 |
| Retail trade (44–45) | 13.80 | 6.00 | 19.80 |
| Transportation and warehousing (48–49) | -16.70 | -1.80 | -18.60 |
| Information and cultural industries (51) | 0.00 | 7.60 | 7.60 |
| Finance, insurance, and holding companies (52, 55) | 8.60 | 19.80 | 28.30 |
| Real estate and rental and leasing (53) | 23.80 | -5.90 | 17.80 |
| Professional, scientific and technical services (54) | 0.30 | 15.10 | 15.40 |
| Administrative and support, waste management and remediation services (56) | 0.90 | -1.90 | -0.90 |
| Arts, entertainment and recreation (71) | -5.80 | -3.50 | -9.30 |
| Accommodation and food services (72) | -3.70 | -17.50 | -21.20 |
| Other business-sector services (61, 62, 81) | 0.40 | 1.10 | 1.50 |
| Sum | 67.70 | 32.30 | 100.00 |
| Source: Author’s calculations based on CODR tables 36-10-0207 and 36-10-0480. | |||
It is expected that aggregate labour productivity growth would be affected by the structural changes caused by the cessation and resumption of business activities. Table 2 presents the decomposition results of labour productivity growth for the Canadian business sector from the fourth quarter of 2019 to the fourth quarter of 2020, by industry.Note As shown in the table, about two-thirds of the aggregate labour productivity growth can be attributed to the within-industry effect, and about one-third of it can be attributed to the structural-change effect. The overall positive structural-change effect suggests that hours have been reallocated to more productive industries, and non-essential activities are relatively less productive.
| Average share change | |
|---|---|
| percentage points | |
| Agriculture, forestry, fishing and hunting (11) | 0.86 |
| Mining, quarrying, and oil and gas extraction (21) | 2.23 |
| Utilities (22) | 0.17 |
| Construction (23) | 2.46 |
| Manufacturing (31–33) | 0.55 |
| Wholesale trade (41) | 0.49 |
| Retail trade (44–45) | 1.02 |
| Transportation and warehousing (48–49) | 3.99 |
| Information and cultural industries (51) | 0.84 |
| Finance, insurance, and holding companies (52, 55) | 0.76 |
| Real estate and rental and leasing (53) | 0.87 |
| Professional, scientific and technical services (54) | 0.60 |
| Administrative and support, waste management and remediation services (56) | 0.85 |
| Arts, entertainment and recreation (71) | 10.85 |
| Accommodation and food services (72) | 3.46 |
| Other business-sector services (61, 62, 81) | 0.38 |
| Source: Author’s calculations based on Statistics Canada table 36-10-0343. | |
As shown in Table 2, some industries greatly contribute to both the within-industry effect and the structural-change effect, such as construction (NAICS 23); manufacturing (NAICS 31–33); wholesale trade (NAICS 41); retail trade (NAICS 44–45); and finance, insurance, and holding companies (NAICS 52, 55). Business activities in these industries are mostly essential and, hence, they benefit greatly from structural change during the pandemic. In contrast, other industries made a negative contribution to both the within-industry effect and the structural-change effect: transportation and warehousing (NAICS 48–49); arts, entertainment and recreation (NAICS 71); and accommodation and food services (NAICS 72). These three industries were hurt the most by the travel restrictions and lockdown policies. Agriculture, forestry, fishing and hunting (NAICS 11) contributed greatly to the within-industry effect, but minimally to the structural-change effect, while information and cultural industries (NAICS 51) and professional, scientific and technical services (NAICS 54), the two digital-intensive industries, contributed greatly to the structural-change effect, but minimally to the within-industry effect. Finally, mining, quarrying, and oil and gas extraction (NAICS 21) and real estate and rental and leasing (NAICS 53) made substantial negative contributions to the structural-change effect and large positive contributions to the within-industry effect. Transportation and warehousing (NAICS 48–49) made a substantial negative contribution to the productivity-growth effect, but a minimal contribution to the structural-change effect.
It is noteworthy that the industry level for the decomposition in Table 2 is quite aggregate. The structural-change effect would increase if the decomposition were done at a more specific industry level and, at that level, industries with higher productivity expand and industries with lower productivity shrink. In other words, the within-industry effect may partly be a result of within-industry structural changes. For a better understanding of the issue, Table 3 shows structural changes between the sub-industries within an aggregate industry, where the average share change is estimated as the square root of the average squared share change of each sub-industry within an aggregate industry. For example, for manufacturing (NAICS 31–33), the real GDP share of its sub-industries changed by 0.55 percentage points, on average, over the period from December 2019 to December 2020. Overall, the changes in average shares within industries in Table 3 are higher in magnitude than the changes in real GDP shares between industries in Table 1.
As shown in Table 3, the top three industries with the greatest changes in their real GDP share among their sub-industries were arts, entertainment and recreation (NAICS 71); transportation and warehousing (NAICS 48–49); and accommodation and food services (NAICS 72). The real GDP share change of each sub-industry from December 2019 to December 2020 averaged 10.85 percentage points in arts, entertainment and recreation (NAICS 71); 3.99 percentage points in transportation and warehousing (NAICS 48–49); and 3.46 percentage points in accommodation and food services (NAICS 72). These three industries also experienced the highest loss of real GDP share (Table 1). Much of the within-industry changes can result from the opening and closing of firms during the pandemic. This is worth further investigation when data become available.
Concluding remarks
The Canadian business sector experienced strong labour productivity growth during the course of the year 2020, partly because of strong growth in most of the two-digit NAICS industries, and partly because of structural changes during the pandemic towards industries that carry out a large share of essential activities. Structural changes have also taken place at a more detailed industry level. To what extent such structural changes have affected aggregate labour productivity growth during the pandemic is an important question to answer and needs to be examined when the data required become available.
Almost all industries experienced large variations in their output, hours worked and labour productivity in 2020. Industries that had larger declines in output and hours worked in the first half of 2020, as a result of lockdown policies, also experienced larger rebounds in the second half of 2020, when many non-essential businesses were reopened. Also, faster adjustments in hours worked than in output caused labour productivity to increase in the first half of 2020 and to decrease in the second half of 2020. Although many of the shifts between essential and non-essential production activities reversed themselves over the course of 2020, when viewed over the whole year, the shifts accounted for about one-third of the strong labour productivity growth in 2020. It remains to be seen whether the changes are likely to be permanent, especially for the industries that were most affected and that may take longer to recover, such as arts, entertainment and recreation (NAICS 71); transportation and warehousing (48–49); and accommodation and food services (72).
One possible permanent change is the wide adoption of WFH arrangements, which would surely change the way we work. However, it has been shown that there is little correlation between an industry’s capacity for telework in 2019 and industry labour productivity growth in 2020. Some data development is needed to evaluate the impact of WFH on productivity growth, such as separating hours worked into office hours and home hours. This would allow researchers to examine whether productivity growth and the share of home hours are related.
References
Aternity. 2020a. The Remote Work Productivity Tracker: Global Trends in the Shift to Remote Work. Aternity Reports, Volume 1. Available at: https://info.aternity.com/the-covid-19-remote-work-productivity-tracker.html (accessed January 16, 2021).
Aternity. 2020b. The Remote Work Productivity Tracker: The Changing Behavior from Remote Work. Aternity Reports, Volume 2. Available at: https://info.aternity.com/covid-19-remote-work-productivity-tracker-collaboration-app-usage.html (accessed January 16, 2021).
Aternity. 2020c. The Remote Work Productivity Tracker: Application Performance. Aternity Reports, Volume 3. Available at: https://info.aternity.com/covid-19-remote-work-productivity-tracker-application-performance.html (accessed January 16, 2021).
Bloom, N., J. Liang, J. Roberts, and Z. Ying. 2015. “Does working from home work? Evidence from a Chinese experiment.” The Quarterly Journal of Economics 130 (1): 165–218.
Dahik, A., D. Lovich, C. Kreafle, A. Bailey, J. Kilmann, D. Kennedy, P. Roongta, F. Schuler, L. Tomlin, and J. Wenstrup. 2020. What 12,000 Employees Have to Say About the Future of Remote Work. Boston Consulting Group. Available at: https://www.bcg.com/publications/2020/valuable-productivity-gains-covid-19 (accessed January 16, 2021).
Deng, Z., R. Morissette, and D. Messacar. 2020. “Running the economy remotely: Potential for working from home during and after COVID-19.” StatCan COVID-19: Data to Insights for a Better Canada. Statistics Canada Catalogue no. 45-28-0001. Ottawa: Statistics Canada.
Gorlick, A. 2020. “The productivity pitfalls of working from home in the age of COVID-19.” Stanford News. Available at: https://news.stanford.edu/2020/03/30/productivity-pitfalls-working-home-age-covid-19/ (accessed November 16, 2020).
Liu, H. 2020. “The economic impact of travel restrictions on the Canadian economy due to the COVID-19 pandemic.” Economic Insights, no. 125. Statistics Canada Catalogue no. 11-626-X. Ottawa: Statistics Canada.
Mehdi, T., and R. Morissette. 2021. “Working from home: Productivity and preferences.” StatCan COVID‑19: Data to Insights for a Better Canada. Statistics Canada Catalogue no. 45-28-0001. Ottawa: Statistics Canada.
OECD (Organisation for Economic Co-operation and Development). 2020. Productivity Gains from Teleworking in the Post COVID-19 Era: How Can Public Policies Make It Happen? Available at: https://read.oecd-ilibrary.org/view/?ref=135_135250-u15liwp4jd&title=Productivity-gains-from-teleworking-in-the-post-COVID-19-era (accessed October 1, 2020).
Sectigo. 2020. Work-from-Home IT Impact Study. Available at: https://sectigo.com/download-content?target=resource-library/2020-work-from-home-it-impact-study&utm_campaign=wakfield-report-wfh (accessed October 1, 2020).
Stackhouse, J. 2020. 8 Ways COVID Will Transform the Economy and Disrupt Every Business. Available at: https://thoughtleadership.rbc.com/8-ways-covid-will-transform-the-economy-and-disrupt-every-business (accessed January 15, 2021).
Statistics Canada. 2020a. “Canadian Perspectives Survey Series 1: COVID-19 and working from home, 2020.” The Daily. April 17. Statistics Canada. Available at: https://www150.statcan.ca/n1/daily-quotidien/200417/dq200417a-eng.htm (accessed January 15, 2021).
Statistics Canada. 2020b. “Canadian Survey on Business Conditions.” The Daily. November 13. Statistics Canada. Available at: https://www150.statcan.ca/n1/daily-quotidien/201113/dq201113a-eng.htm (accessed January 15, 2021).
Tang, J., and W. Wang, 2004. “Sources of aggregate labour productivity growth in Canada and the United States.” Canadian Journal of Economics 37 (2): 421–444.
Wang, W. 2020. Yukon in COVID-19 Pandemic: Decline in Tourism Activities and the Impact on the Economy. Yukon Bureau of Statistics. Available at: https://yukon.ca/sites/yukon.ca/files/covid-19_impact_yukon_tourism.pdf (accessed January 20, 2021).
World Economic Forum. 2020. Most Leaders Think Remote Working Will Hit Productivity — This Is Why. Available at: https://www.weforum.org/agenda/2020/10/remote-working-productivity-future-of-jobs/ (accessed January 20, 2021).
- Date modified: