
Economic and Social Reports
Changes in employment by businesses during the COVID-19 pandemic: New insights on the experimental series of monthly business openings and closures
DOI: https://doi.org/10.25318/36280001202100300002-eng
Abstract
This article illustrates the extent to which businesses that were active in February 2020 scaled back their employment during the COVID-19 pandemic. It finds that 70% and 82% of employment declines in March and April 2020, respectively, were attributable to continuing businesses, which scaled back their workforce significantly. While this was observed in businesses of all sizes, small firms with fewer than 100 employees contributed the most to employment declines among both continuing businesses and business closures.
Author
Amélie Lafrance-Cooke is with the Economic Analysis Division, Analytical Studies Branch at Statistics Canada.
Introduction
The COVID-19 pandemic had a significant impact on businesses, leading to the closure of about 100,000Note of them in April 2020 (Lafrance-Cooke, Macdonald and Willox 2020). These closures, coupled with restrictions on economic activity, led to a significant decrease in employment. Results from the Labour Force Survey showed that employment fell by more than 1 million in March and nearly 2 million in April. According to the May 2020 Canadian Survey on Business Conditions, about 17% of businesses that participated in the survey laid off between 50% and 100% of their workforce as a result of COVID-19.
Across Canada in the spring, provincial and territorial governments prepared plans to reopen the economy and loosen restrictions. Most began easing restrictions on economic activity in May 2020, allowing some businesses to reopen, albeit in a limited capacity to comply with safety protocols.
Using the newly developed experimental series on monthly business openings and closures, this article examines the impacts of the COVID-19 pandemic on employment in the Canadian business sector and—in particular—the extent to which businesses that were active in February 2020 increased or decreased their employment since February. It also examines these impacts by business size. It finds that 70% and 82% of employment declines in March and April 2020, respectively, were attributable to continuing businesses, which scaled back their workforce significantly. While this was observed in businesses of all sizes, small firms with fewer than 100 employees contributed the most to employment declines in both continuing businesses and business closures.
Recent patterns in the scaling effects of employment by businesses
Employment declines in March and April 2020 were largely the result of employment changes in continuing businesses
Employment statistics from the Labour Force Survey and the Survey of Employment, Payrolls and Hours illustrate the extent to which employment declined because of the pandemic. An examination of month-to-month changes in employment by businesses that were active in February 2020 reveals how much of these declines were the result of business closures and continuing businesses. Moreover, it is possible to identify reopening businesses and their associated employment.
The results show that the majority of aggregate employment declines in March and April in the business sector were the result of employment declines in continuing businesses (Chart 1). Continuing businesses accounted for 70% and 82% of the employment declines from the previous month in March and April 2020, respectively. The impact was particularly significant in April 2020, when employment in continuing businesses declined by about 1.3 million. While the employment decline attributed to business closures represented a smaller share of the overall decline, it represented a loss of over 200,000 employees in both months.
From April to May 2020, the net employment change in continuing businesses remained negative, but larger declines in employment were observed from business closures. Since May 2020, the business sector has recorded positive net employment changes. While employment declines attributable to business closures continued to be observed, they have diminished consistently since their peak in April 2020. Continuing businesses contributed the most to employment growth from June to August 2020—businesses that reopenedNote contributed to 18% of employment in June and July and to 32% in August.Note
It is important to note that the increases in employment observed from May to August 2020 from continuing and reopening businesses did not fully offset the losses caused by the COVID-19 pandemic. This provides some evidence that some continuing businesses have not rehired their full workforce.

Data table for Chart 1
| Employment change | March 2020 | April 2020 | May 2020 | June 2020 | July 2020 | August 2020 |
|---|---|---|---|---|---|---|
| number | ||||||
| Reopening businesses | Note ...: not applicable | 52,529 | 76,104 | 153,018 | 100,920 | 65,668 |
| Continuing businesses | -591,926 | -1,322,487 | -82,406 | 687,661 | 497,142 | 139,346 |
| Closing businesses | -252,876 | -282,453 | -168,969 | -124,181 | -94,291 | -53,092 |
|
... not applicable Source: Statistics Canada, author's calculations. |
||||||
A large proportion of continuing businesses scaled back their workforce significantly at the onset of the COVID-19 pandemic
As demonstrated, for businesses that were active in February 2020, employment decreased significantly in March and April 2020, largely as a result of decreased employment in continuing businesses. The monthly net employment changes of continuing businesses can be decomposed into gross employment creation and gross employment destruction. This will provide a more comprehensive picture of the degree to which employment in continuing firms declined.
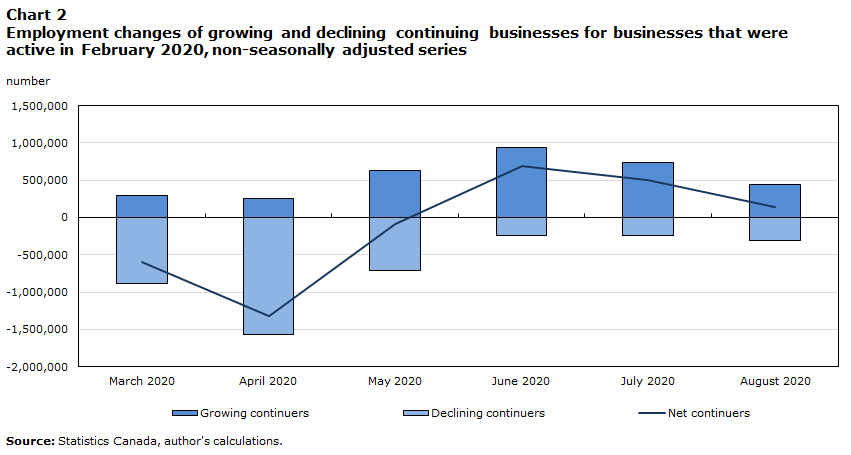
Typically, continuing firms that are expanding are responsible for more employment creation than entrants, and continuing firms that are declining are responsible for more employment destruction than exits—even during recessions (Rollin 2012). In March and April 2020, the majority of the employment declines in continuing businesses was attributable to significant employment destruction in businesses that reduced their workforce and did not close (Chart 2). Employment in these declining businesses decreased by nearly 900,000 in March and by more than 1.5 million in April.
Growing businesses played a greater role from May to August 2020 and contributed more substantially to net employment growth, particularly in June and July.
Data table for Chart 2
| Employment change | March 2020 | April 2020 | May 2020 | June 2020 | July 2020 | August 2020 |
|---|---|---|---|---|---|---|
| number | ||||||
| Net continuers | -591,926 | -1,322,487 | -82,406 | 687,661 | 497,142 | 139,346 |
| Growing continuers | 292,741 | 253,564 | 623,396 | 933,102 | 730,443 | 447,868 |
| Declining continuers | -884,666 | -1,576,051 | -705,802 | -245,441 | -241,158 | -308,522 |
| Source: Statistics Canada, author's calculations. | ||||||
To what extent did these declining continuing businesses scale back their workforce? To put it in perspective, before the COVID-19 pandemic, the majority of businesses fell into the middle of the employment growth distributionNote (Table 1). In February 2020, 52.9% of businesses had positive employment growth of between 0% and 33% since January 2020, while 39.5% had negative employment growth of between 0% and -33%.
In April 2020, the majority of businesses remained in the middle bins (or employment growth distribution), but there were more businesses in the declining bins (bins 4, 5 and 6)—68.7% in April 2020 versus 42.7% in February 2020. Moreover, from February 2020 to April 2020, the share of businesses in Bin 5 (decline in employment of between -33% and -66%) increased by more than 10 percentage points, and the share in Bin 6 (decline of more than -66%) increased by 4 percentage points,Note i.e., nearly 20% of businesses decreased their employment by more than 33%. This provides further evidence that the COVID-19 pandemic led businesses to reduce their workforce on an unprecedented scale.
| Bin | Monthly growth or decline in employment | February 2020 | March 2020 | April 2020 | May 2020 | June 2020 | July 2020 | August 2020 |
|---|---|---|---|---|---|---|---|---|
| 1 | Greater than 66% | 2.1 | 2.6 | 1.9 | 7.3 | 8.3 | 4.8 | 3.1 |
| 2 | Between 33% and 66% | 2.2 | 2.5 | 1.8 | 5.0 | 6.6 | 4.8 | 3.4 |
| 3 | Between 0% and 33% | 52.9 | 38.0 | 27.5 | 38.1 | 48.8 | 51.6 | 51.2 |
| 4 | Between 0% and -33% | 39.5 | 48.0 | 50.5 | 43.6 | 32.2 | 35.8 | 39.7 |
| 5 | Between -33% and -66% | 2.7 | 7.2 | 13.5 | 4.7 | 3.3 | 2.4 | 2.3 |
| 6 | Greater than -66% | 0.5 | 1.7 | 4.7 | 1.3 | 0.9 | 0.6 | 0.4 |
| Source: Statistics Canada, author's compilation. | ||||||||
In May and June 2020, there was a reversal in these trends, i.e., there was a decrease in the share of businesses in the lowest growth categories (bins 5 and 6) and an increase in the share of businesses in the highest growth categories (bins 1 and 2) compared with the previous month (Table 1). For example, in June 2020, 8.3% of businesses increased their workforce by more than 66%. Since June 2020, the distribution of businesses has been greater in the positive growth bins and similar to the distribution observed before the onset of the pandemic.
While employment declines were greater for small businesses at the onset of the pandemic, medium and large businesses scaled back their workforce to a larger extent
There is great interest in whether the COVID-19 pandemic impacted both small and large businesses in a similar way. This can be examined using the size of the business in February 2020: small businesses are defined as businesses with fewer than 100 employees, and medium and large businesses are defined as businesses with 100 employees or more.
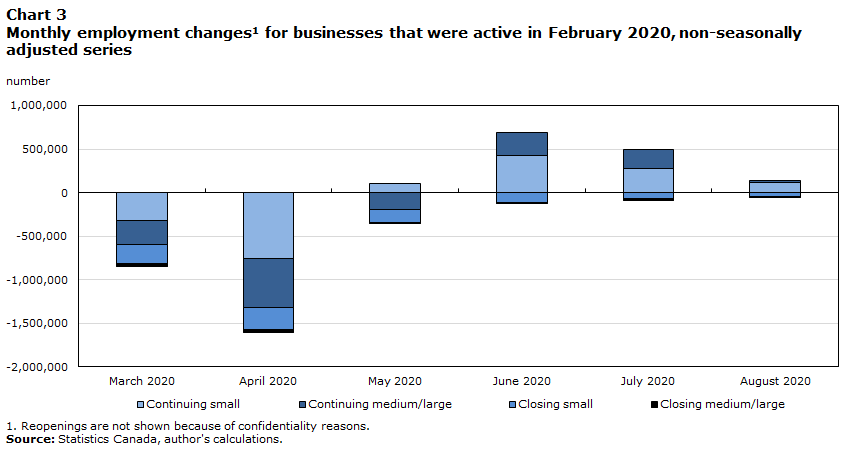
For continuing businesses, larger employment declines were observed in small firms than in medium and large firms in March and April 2020, although medium and larger firms also experienced significant declines in employment (Chart 3). From March to April 2020, when declines in employment reached their peak, employment in continuing businesses declined by about 752,000 (15.9%) in small firms and by 570,000 (9.5%) in medium and large firms. The majority of employment destruction attributable to closing businesses was in small firms.
In May 2020, employment gains of about 100,000 were observed in small continuing firms, while losses continued to be observed in medium and large firms (nearly 200,000). Small firms seem to have recovered some of their employment more quickly than medium and large firms. Since May 2020, employment increased in all size classes, with particularly significant employment gains in small businesses in June 2020.
Data table for Chart 3
| Employment change | March 2020 | April 2020 | May 2020 | June 2020 | July 2020 | August 2020 |
|---|---|---|---|---|---|---|
| number | ||||||
| Continuing small | -323,855 | -756,057 | 106,866 | 422,721 | 280,068 | 112,940 |
| Continuing medium/large | -268,071 | -566,429 | -189,272 | 264,939 | 209,217 | 26,406 |
| Closing small | -225,705 | -247,344 | -155,546 | -113,413 | -70,411 | -49,288 |
| Closing medium/large | -27,172 | -35,108 | -13,423 | -10,768 | -18,825 | -3,804 |
|
Note: Reopenings are not shown because of confidentiality reasons. Source: Statistics Canada, author's calculations. |
||||||
In terms of the distribution of continuing businesses across employment change bins, prior to the pandemic, the distribution was fairly similar across size classes, with over 90% of businesses falling into the middle of the employment growth–decline bins (Table 2). In April 2020, the distribution of businesses shifted toward the negative scale bins for all size classes, and more so for the medium and large size class. Three-quarters of medium and large businesses decreased their employment from March to April 2020, compared with about two-thirds of small firms. In medium and large businesses, 7.6% decreased their employment by over 66%, compared with 4.6% of small businesses.
Following the peak employment decline of April 2020, the distribution of businesses shifted back to a greater share of businesses with positive monthly employment growth in all size classes. This shift occurred in May 2020 for small businesses and in June 2020 for larger businesses. This provides further evidence that, as some businesses reopened in May, small businesses appear to have rehired their workforce or hired new employees relatively more quickly than larger firms. Possible reasons for this include the ability of small businesses to hire or rehire more efficiently because of their size and a potential greater risk of closing permanently. Lastly, in August 2020, the distribution of businesses was very similar for both size classes and similar to the pre-pandemic levels observed in February 2020.
| Size class | Bin | Monthly growth or decline in employment | February 2020 | March 2020 | April 2020 | May 2020 | June 2020 | July 2020 | August 2020 |
|---|---|---|---|---|---|---|---|---|---|
| Small businesses | 1 | Greater than 66% | 2.1 | 2.7 | 1.9 | 7.4 | 8.3 | 4.7 | 3.1 |
| 2 | Between 33% and 66% | 2.2 | 2.5 | 1.9 | 5.0 | 6.6 | 4.8 | 3.4 | |
| 3 | Between 0% and 33% | 53.0 | 38.0 | 27.6 | 38.2 | 48.6 | 54.3 | 51.1 | |
| 4 | Between 0% and -33% | 39.4 | 47.8 | 50.4 | 43.5 | 32.3 | 33.2 | 39.7 | |
| 5 | Between -33% and -66% | 2.8 | 7.3 | 13.6 | 4.7 | 3.3 | 2.4 | 2.3 | |
| 6 | Greater than -66% | 0.5 | 1.7 | 4.6 | 1.3 | 0.9 | 0.6 | 0.4 | |
| Medium and large businesses | 1 | Greater than 66% | 1.8 | 0.3 | 0.7 | 5.0 | 7.3 | 4.3 | 1.9 |
| 2 | Between 33% and 66% | 1.8 | 0.7 | 1.5 | 3.5 | 5.5 | 3.9 | 2.7 | |
| 3 | Between 0% and 33% | 50.6 | 34.8 | 22.0 | 33.2 | 57.2 | 60.4 | 53.8 | |
| 4 | Between 0% and -33% | 45.0 | 57.9 | 56.0 | 49.2 | 28.3 | 30.1 | 39.8 | |
| 5 | Between -33% and -66% | Note x: suppressed to meet the confidentiality requirements of the Statistics Act | 5.7 | 12.3 | 6.0 | 1.4 | 1.0 | 1.4 | |
| 6 | Greater than -66% | Note x: suppressed to meet the confidentiality requirements of the Statistics Act | 0.7 | 7.6 | 3.2 | 0.4 | 0.2 | 0.4 | |
|
x suppressed to meet the confidentiality requirements of the Statistics Act Source: Statistics Canada, author's compilation. |
|||||||||
Methodology: Measuring scale changes in employment for continuing businesses
Because the experimental series on monthly business openings and closures is derived from the Canada Revenue Agency’s PD7 payroll deduction files (which provide the number of employees for each employer in Canada that submits a PD7), it is possible to observe monthly changes in employment for continuing businesses, i.e., those that had positive employment in the current and previous months. These monthly changes in employment can—in turn—be used to examine employment growth and decline and, specifically, the extent to which businesses may have scaled back their workforce at the onset of the pandemic.
The article focuses on businesses that were active in February 2020 to highlight changes in their employment following the onset of the COVID-19 pandemic.
There are various ways to examine short-term changes in employment. For the purposes of this article, changes in employment will be illustrated largely using growth distributions. The monthly employment growth or decline of a continuing business in percentage terms can fall into one of the following six categories: greater than 66%, between 33% and 66%, between 0% and 33%, between 0% and -33%, between -33% and -66%, and less than -66%. For example, a business with 100 employees in March and 58 employees in April would fall into the fifth bin (between -33% and -66%), as its employment fell by 42%.
Openings are defined as businesses with employment in the current month and no employment in the previous month, while closures are defined as businesses that had employment in the previous month, but no employment in the current month. Continuing businesses are those that have employees in both months. Reopenings are openings of businesses that were also active in a previous month (i.e., they closed in a given month and had positive employment in a subsequent month).
Conclusion
This paper presents new results from the experimental series on monthly business openings and closures. Specifically, it illustrates the employment losses of businesses that were active in February 2020 and the extent to which these businesses scaled back their workforce because of the COVID-19 pandemic. It also highlights the employment destruction of closing businesses and the employment creation of reopening businesses.
This article provides new evidence that the majority of employment declines observed in the Canadian business sector in March and April 2020 were the result of losses experienced by continuing businesses. Employment in continuing businesses decreased by nearly 2 million in March and April 2020 combined, more than three times the employment declines resulting from business closures. Continuing businesses scaled back their employment significantly in April 2020, with almost 20% decreasing their employment by more than 33%.
The largest employment declines were observed in small businesses. However, a greater share of medium and large businesses scaled back their workforce.
As provinces and territories eased restrictions from May to August 2020, the results show that continuing businesses began rehiring some of their workforce or hiring new employees. As a result, in terms of employment growth distributions, there was a major shift in employment from negative to positive employment growth. There is also evidence that small businesses may have scaled up their workforce relatively more quickly than larger firms.
As a response to the pandemic, the Government of Canada launched emergency programs to support businesses, such as the Canadian Emergency Wage Subsidy program. In addition to examining the impact of the second wave of the pandemic, future work will examine the impact of such programs on business and employment dynamics.
References
Lafrance-Cooke, A., R. Macdonald, and M. Willox. 2020. Monthly Business Openings and Closures: Experimental Series for Canada, the Provinces and Territories, and Census Metropolitan Areas. Economic Insights, no. 116. Statistics Canada Catalogue no. 11-626-X. Ottawa: Statistics Canada.
Rollin, A.-M. 2012. Firm Dynamics: Employment Dynamics Arising from Firm Growth and Contraction in Canada, 2001 to 2009. The Canadian Economy in Transition, no. 24. Statistics Canada Catalogue no. 11-622-M. Ottawa: Statistics Canada.
- Date modified: