
Economic and Social Reports
Measuring digital intensity in the Canadian economy
DOI: https://doi.org/10.25318/36280001202100200003-eng
Abstract
The objective of this paper is to develop a composite index to characterize the intensity of digitalization in Canadian industries. Because of the ubiquitous presence of digitalization and businesses’ and individuals’ increasing reliance on digital products and services, it is important to measure digitalization to better understand its impact on the Canadian economy. This paper first adopts multidimensional metrics to measure the extent to which firms use digital inputs to produce goods and services, using data on information and communications technology (ICT) capital, the use of intermediate ICT goods and services, the digital workforce, and robot adoption. A composite index is then constructed from these multidimensional metrics through a principal component analysis. The final index shows that digital intensity in production improved continuously from 2000 to 2015 in the Canadian economy. While almost all industries have become more digitally intensive over time, digitalization tends to be uneven across Canadian industries. The information services; telecommunications; professional, scientific and technical services; and machinery, computer, electronic product and transportation equipment manufacturing industries are among the leaders in digital intensity. Their intensities were high at the beginning of the sample period and increased significantly over time. Conversely, agriculture, mining, construction, and most manufacturing and transportation industries are among the least digitally intensive sectors, starting out low and increasing slightly over time.
Acknowledgements
The authors would like to thank André Binette of the Bank of Canada; Danny Leung and Mark Uhrbach from Statistics Canada; and Vincent Dore, Hankook Kim and Jianmin Tang from Innovation, Science and Economic Development Canada for their valuable comments and suggestions.
Authors
Huju Liu is with the Economic Analysis
Division, Analytical Studies Branch at Statistics Canada.
Julien
McDonald-Guimond is with the Bank of Canada
Introduction
Over the past two decades, Canadians have embraced digital technologies at an unprecedented pace and breadth. In 2018, 91% of Canadians were Internet users and 84% of Internet users shopped online to order digital goods and services and physical goods and other services—spending $57.4 billion, up from $18.9 billion in 2012 (Statistics Canada 2019a). Moreover, the percentage of businesses in the Canadian private sector that used the Internet for their activities was 89.1% in 2013 and almost 100% among large businesses (Statistics Canada n.d.a). Adoption of cloud computing has also increased rapidly, particularly among larger businesses. For example, 54% of larger Canadian businesses used cloud services in 2012, compared with 28% of businesses with fewer than 50 employees (OECD 2014).
The objective of this study is to develop statistical indexes to measure the intensity of digitalization in Canadian industries. Because of the ubiquitous presence of digitalization and businesses’ and individuals’ increasing reliance on digital products and services, it is essential to measure the digitalization in the Canadian economy to better understand its impact so that governments, businesses and other stakeholders can make informed decisions. It has been shown that digitalization has significant impacts on employment and jobs (Acemoglu and Restrepo 2020; Dixon, Hong and Wu 2020; Nedelkoska and Quintini 2018,), firm productivity (Gal et al. 2019), business dynamics (Calvino and Criscuolo 2019), firm mark-up (Calligaris, Criscuolo and Marcolin 2018), the on-demand production process (Spiezia 2017), and gig economy platforms and workers (Hardill and Green 2003; Schwellnus, Geva, Pak and Veiel 2019).
However, measuring digitalization poses several challenges, primarily because digitalization is not a single phenomenon, but rather a complex process and multifaceted phenomenon. It can include the automation of tasks by robots, the use of big data and artificial intelligence technologies, and the dematerialization of resources—sometimes referred to as digitization.Note According to van Ark (2016), the digital transformation is driven by “a combination of mobile technologies; ubiquitous access to the Internet; and the shift toward storage, analysis and development of new applications in the cloud.”
In particular, this paper aims to measure the digital intensity in production among Canadian industries using a comprehensive approach. Building on previous work, this paper capitalizes on multidimensional indicators to characterize the digital intensity in Canadian industries using various data sources.Note These multidimensional indicators were built from data on information and communications technology (ICT) capital stock and investment, the use of intermediate ICT goods and services, digital-related occupations, and robot use. These indicators capture the extent to which Canadian industries have undergone a digital transformation and integrated digital technologies into their production processes.
To measure digital intensity, this study started by constructing multidimensional metrics at the industry level, allowing for cross-industry and cross-time comparisons. Next, the metrics were aggregated into a single composite index for each industry based on weights derived from a principal component analysis (PCA). Lastly, a national index of digital intensity was constructed to measure the overall national progression of digitalization.
It should be emphasized that the objective of this paper is to measure the extent to which firms use digital technologies to produce goods and services—both digital and non-digital. This is different from measuring firms’ digital outputs or the size of the digital economy (Barefoot et al. 2018; Statistics Canada 2019b). For example, the agriculture industry produces hardly any digital products and services, which should not be included as part of the digital economy based on the output measure. However, it may still use many digital technologies and undergo digital transformation in production, such as using big data analytics, spraying and weeding robots, and drone and crop monitoring (Bloomberg 2018).
This characterization of digital intensity contributes to the literature on several aspects. First, it is the first multidimensional measure of digital intensity that focuses on Canada specifically. Other studies that analyzed digitalization either drew their attention to a specific aspect, e.g., automation and robots (Oschinski and Wyonch 2017; Dixon, Hong and Wu 2020), or did not provide results for Canada (Manyika et al. 2015). Second, the present study provides a set of metrics that has been available annually for 50 industries since 2000, and these metrics can be updated easily and combined with new information. This feature is crucial for understanding the dynamics of digital intensity (its growth and breadth) and is often absent from the literature. One notable exception is an OECD report by Calvino, Criscuolo, Marcolin and Squicciarini (2018), which adopted a similar multidimensional taxonomy of digital sectors with multiple years of observations. Although many OECD countries were covered in their analysis of digitalization, Canada was excluded because of data limitations. The report found many variations across OECD countries, which may provide weak guidance for measuring digitalization in Canada in particular. Third, unlike Calvino, Criscuolo, Marcolin and Squicciarini (2018), who built an industrial summary index based on ranks and equal weights, the present paper builds a composite index using z-score normalization and weights derived from a PCA. The resulting composite index not only captures most of the variation in the underlying sub-metrics, but also allows for a better comparison of digital intensity across both industry and time. Lastly, although the analysis is done at the industry level, this study leverages firm-level data to increase the granularity at which the metrics can be developed.
The final composite index suggests that digital intensity in the Canadian economy has improved continuously from 2000 to 2015, as illustrated in Chart 7 in Section 4.4. Almost all industries have increased their digital intensity over time. The information services; broadcasting and telecommunications; professional, scientific and technical services; and machinery, computer and electronic products and transportation equipment manufacturing industries are among the leaders in digital transformation, while agriculture, mining, construction and most other manufacturing and transportation industries have the lowest digital intensity. While the ranking of digital intensity across industries is largely consistent with what was found in Calvino, Criscuolo, Marcolin and Squicciarini (2018), the final composite index does a better job at measuring the magnitudes of underlying differences in digital intensity between industries and over time.
Measuring digitalization
Like previous technological innovations, such as the steam engine, electricity and the internal combustion engine, digital technologies are also general-purpose technologies (Carlsson 2004; Jovanovic and Rousseau 2005; Cardona, Kretschmer and Strobel 2013; Brynjolfsson and McAfee 2018).Note As such, they can give rise to a variety of innovations and applications. Moreover, the different facets of digitalization can be highly complementary.
In the face of such a complex phenomenon, it is important to draw as comprehensive a picture of digitalization as possible. For this reason, this study considers several metrics related to different aspects where digital technologies are likely to be integrated into the production process. Following the economic framework of firm production, these metrics cover the main inputs of production—capital, labour and intermediate input. More specifically, the variables considered are 1) ICT capital, 2) digital-related occupations, 3) the use of intermediate ICT goods and services, and 4) robot adoption.Note
An important assumption made in this study and across the literature is that the use of ICT products and services is a reasonable proxy for digitalization. ICT products and services provide the foundation and basic infrastructure with which digital technologies can operate. For example, computers, telecommunications equipment, software and related services are often categorized as digital-enabling infrastructure (Barefoot et al. 2018; Statistics Canada 2019b). Firms that use ICT inputs are deemed more likely to engage with more sophisticated—or new—digital technologies. However, this approach has its limitations. For example, a computer store purchases many computers and related equipment for resale and provides repair services for used computers, which has little to do with digitalization. Furthermore, firms can access digital technologies without transacting on the market, for example, through free software.
The original data sources underlying the metrics are available at different levels of industrial aggregation. Therefore, a common level of industry disaggregation was adopted to facilitate comparisons across industries.Note A set of 50 industries was selected to maintain a balance between stronger assumptions and relevance. While a high level of aggregation is easier to achieve, it cannot account for within-sector heterogeneity. Although a more granular level of disaggregation is desirable, it requires stronger assumptions on the interlinkages between an industry and its subindustries, which requires the metric of a “parent” industry to be applied to all of its “children” industries.
While the multidimensional metrics are useful for capturing different facets of digitalization, they are not practical for comparing the overall digital intensity across industries. Some sectors may be more digitally intensive than others in terms of ICT capital, but less so in terms of ICT services use. Moreover, some indicators may correlate strongly with each other, for example, ICT capital and the digital workforce. Therefore, a single composite index that can summarize the multidimensional indicators for each sector is required. PCAs are a particularly useful tool for data reduction when faced with high-dimensional and correlated variables (James, Witten, Hastie and Tibshirani 2014). PCAs can find a few principal components that preserve a high amount of total variance of the original data.
Therefore, this study used a PCA to aggregate the multidimensional indicators. The final index was constructed as a linear combination of the original multidimensional indicators using weights derived from the first two principal components and explains more than 80% of total variance. This exercise also allows for the subsequent computation of an economy-wide index of digitalization—a useful tool for tracking the progression of this phenomenon in Canada. More details on the PCA and the development of the composite index are described in Section 4.
All nominal variables were converted to real dollars before the indicators were developed. Examining nominal values can be informative, as these values reflect an industry’s actual expenditures on digital inputs when it makes its production decisions. However, as has been reported extensively in the literature, decreases in the price of ICT equipment have been substantial since the 1990s compared with other types of products (Byrne and Corrado 2017; van Ark 2016). As a result, nominal metrics may suggest that the use of digital inputs has stagnated—or even declined—since 2000. Yet, there could still be relatively more digital inputs involved in the production process than before.Note
Multidimensional metrics of digitalization
This section presents multidimensional metrics for the aspects of digitalization considered. For each metric, its relevance to digitalization, the way it was constructed and data sources are discussed first. Stylized facts are then presented to examine the digital intensity across industries and over time. For the comparison over time, three-year averages were computed to account for volatility.
Information and communications technology capital stock
ICT assets provide the foundation and basic infrastructure with which digital technologies can operate. The stock of ICT capital captures a sequence of purchases of assets, the disposition of old assets, and the depreciation of existing assets over time. Therefore, it provides a complete picture of available ICT capital for production purpose and provides a good indication of the technological readiness by a firm for digital adoption.
Data on ICT capital were sourced from two datasets, each providing a slightly different perspective. The first data source was the National Accounts Longitudinal Microdata File (NALMF), which contains firm-level data on all incorporated and some unincorporated firms (those with employees) in Canada. Information from one of the corporate tax schedules—capital cost allowance (CCA)—was used to compute the value of the ICT capital stock.Note
The second source used was Statistics Canada’s capital, labour, energy, material and service (KLEMS) database, which provides estimates of capital services for 41 industries. Capital services measure the inputs derived from the stock of fixed assets used in production over a given period. This concept is quite useful, as it measures the actual stock of capital used in the production process, complementing the measure of capital stock. It is calculated as a weighted sum of the stock of capital using the user’s costs of capital as weights across different types of assets, accounting for the fact that different types of assets have different useful lives (Jorgenson, Ho and Stiroh 2005). This dataset was used together with the NALMF to build the ICT capital metric.
The ICT capital metric was built as
Where is a capital metric, is the volume of digital capital and is the volume of productivity-enhancing capital, all for industry at time . The term “productivity-enhancing” is sometimes used in the literature to denote assets related to research and development activities, but is defined here as the sum of assets in machinery and equipment (M&E) and intellectual property products.Note
This denominator was chosen to account for the fact that some industries might own significant structural capital simply because of the nature of their activities. For example, a manufacturing firm will almost certainly need to invest in a factory, whereas a consultancy firm might simply need to rent a small office to operate. Therefore, using non-residential capital stock (which includes both structural and M&E assets) as the denominator could lead to a downward bias for manufacturing industries simply because there is a larger share of structural capital. An alternative metric that used total non-residential capital stock as a denominator instead of productivity-enhancing assets was also constructed, and the results show a very high rank correlation between the two versions.Note However, one limitation is that assets in KLEMS are divided into only three categories: total capital services, ICT capital services and non-ICT capital services. Therefore, total capital services were used as the denominator to derive the metric using KLEMS.
The capital stock from NALMF was deflated using sector-specific and asset-specific implicit deflators built from Statistics Canada’s data on flows and stocks of fixed non-residential capital (Statistics Canada n.d.b). Volume indexes are already available in KLEMS. The capital metrics from the two data sources were combined based on a PCA (specifically, the first principal component), which in this case is equivalent to a simple average. The main advantage of combining the firm-level NALMF data with KLEMS is that it brings more granularity and within-sector heterogeneity to the capital metric.Note
As shown in Chart 1, the ICT capital intensity was higher in most service sectors than in goods sectors (hereafter, this includes the agriculture, oil and mining, utilities, construction and manufacturing industries) on average over the two time periods. The simple average of ICT capital intensity across industries in the service sector was 0.11 and 0.19 for the two periods, respectively, compared with 0.03 and 0.08 in the goods sector for the two periods, respectively. The change in ICT capital intensity over the two periods was also higher in service sectors on average than in goods sectors—0.08 versus 0.05. In particular, information services, motion pictures, broadcasting and telecommunications, and computer design and engineering services were among the leaders in ICT capital intensity. Increases were particularly strong in the professional service industries, where ICT capital intensities rose by more than 100% in each of its industries.Note Industries in the information and culture sector—while initially leaders—saw more modest increases in intensity over the sample period.Note
Several goods-producing industries also became substantially more intensive in their use of ICT capital. The oil and gas sector increased its intensity more than 24-fold—a remarkable progression given its very low initial intensity. Clothing manufacturing and the printing industries also became relatively more intensive in their use of ICT capital. The retail trade industry, which underwent significant transformations over the last two decades, more than doubled its ICT capital intensity. Lastly, the health sector—an important adopter of cutting-edge technology and innovations—and the education sector—where information technologies have become noticeably more present (e.g., computer labs, digital white boards)—have increased their digital capital intensity significantly.
All in all, the story that this metric paints is one in which professional services have been adopting digital capital massively over the past decades, while the previous leaders (the information services and computer and electronic product manufacturing sectors) have slowed down their adoption. Moreover, the intensification in the stock of ICT capital seems pervasive, with every industry experiencing some increase in its intensity. The ICT capital intensities for most services sectors are above the median in each of the two periods, while some sectors—agriculture, mining, and most manufacturing (except clothing, computers, electronic products and electric equipment) and transportation industries—still lagged behind.Note
Appendix C presents the results for an alternative metric based on ICT investment rather than on capital stock. While the latter better reflects overall technological readiness, it can be interesting to look at patterns of investment to get a sense of more recent digital technology adoption. A robustness check in the final composite index that uses investment instead of capital stock offers very similar results.

Data table for Chart 1
| Industry | 2000 to 2002 | 2013 to 2015 |
|---|---|---|
| ICT capital intensity (number) | ||
| Panel A - Goods sectors | ||
| Agriculture, forestry, fishing and hunting | 0.010 | 0.029 |
| Oil and gas extraction | 0.004 | 0.097 |
| Mining and quarrying (except oil and gas) | 0.013 | 0.045 |
| Support activities for mining, and oil and gas extraction | 0.015 | 0.062 |
| Utilities | 0.039 | 0.077 |
| Construction | 0.019 | 0.066 |
| Food manufacturing | 0.028 | 0.060 |
| Beverage and tobacco product manufacturing | 0.041 | 0.075 |
| Textile mills and textile product mills | 0.027 | 0.076 |
| Clothing manufacturing, and leather and allied product manufacturing | 0.032 | 0.185 |
| Wood product manufacturing | 0.019 | 0.052 |
| Paper manufacturing | 0.036 | 0.052 |
| Printing and related support activities | 0.049 | 0.150 |
| Petroleum and coal products manufacturing | 0.007 | 0.016 |
| Chemical manufacturing | 0.025 | 0.097 |
| Plastics and rubber products manufacturing | 0.032 | 0.053 |
| Non-metallic mineral product manufacturing | 0.025 | 0.031 |
| Primary metal manufacturing | 0.017 | 0.021 |
| Fabricated metal product manufacturing | 0.023 | 0.073 |
| Machinery manufacturing | 0.026 | 0.092 |
| Computer and electronic product manufacturing | 0.163 | 0.222 |
| Electrical equipment, appliance and component manufacturing | 0.027 | 0.170 |
| Transportation equipment manufacturing | 0.032 | 0.052 |
| Furniture and related product manufacturing | 0.027 | 0.097 |
| Miscellaneous manufacturing | 0.030 | 0.108 |
| Panel B - Service sectors | ||
| Wholesale trade | 0.065 | 0.118 |
| Retail trade | 0.055 | 0.165 |
| Air transportation | 0.026 | 0.043 |
| Rail transportation | 0.034 | 0.078 |
| Water transportation | 0.027 | 0.042 |
| Truck transportation | 0.027 | 0.044 |
| Pipeline transportation | 0.030 | 0.049 |
| Other transportation activities | 0.028 | 0.052 |
| Warehousing and storage, postal service, and courriers and messengers | 0.034 | 0.076 |
| Publishing industries, information services and data processing services | 0.282 | 0.340 |
| Motion picture and sound recording industries | 0.266 | 0.314 |
| Broadcasting (except Internet) and telecommunications | 0.323 | 0.403 |
| Finance and insurance | 0.049 | 0.120 |
| Real estate and rental and leasing | 0.052 | 0.070 |
| Architectural, legal, accounting, engineering and related services | 0.192 | 0.413 |
| Advertising, public relations and related services | 0.183 | 0.478 |
| Design, computer systems, management, technical, scientific and other professional services | 0.214 | 0.462 |
| Administrative and support services | 0.189 | 0.272 |
| Waste management and remediation services | 0.182 | 0.225 |
| Educational services | 0.096 | 0.222 |
| Health care and social assistance | 0.051 | 0.241 |
| Arts, entertainment and recreation | 0.099 | 0.166 |
| Accommodation and food services | 0.039 | 0.090 |
| Other services (except public administration) | 0.149 | 0.191 |
| Public administration | 0.114 | 0.160 |
|
Notes: Industries are abbreviated due to space limitations. Refer to Table A.1. for the full name and classification of abbreviated industries. ICT: Information and communications technology. Sources: Statistics Canada, National Accounts Longitudinal Microdata File; Capital, labour, energy, materials and service (KLEMS) database; and authors' calculations. |
||
Use of intermediate information and communications technology goods and services
Intermediate inputs are goods and services that are used in the production process to produce other goods and services. Increasingly, firms have shifted from investing in ICT assets to purchasing ICT services to reduce costs and risks, as well as to increase business flexibility (van Ark 2016). Therefore, using data on the intermediate use of ICT goods and services can complement ICT capital data that—alone—are likely to understate the extent to which firms actually adopt digital technologies.
Data on the intermediate use of digital inputs are based on Statistics Canada’s input–output tables for 2000 to 2008 (Statistics Canada n.d.c) and supply and use tables (SUTs) for 2009 to 2015 (Statistics Canada n.d.d). Digital inputs were divided into goods and services. While intermediate digital goods are used primarily by ICT-producing industries, intermediate digital services can—presumably—enter the production process of a wider array of industries. The list of digital products and services used was selected based on the literature (van Ark 2016; Barefoot et al. 2018) and to avoid significant breaks between the input – output tables and SUTs.Note
The metrics were built as
Where is the digital services metric, is the digital goods metric, and are the volume of digital services and goods, respectively, and and are the total intermediate services and intermediate goods, respectively, all for industry at time . Digital services and digital goods were deflated using the output deflators of information and cultural industries (NAICS 51) and computer and electronic product manufacturing (NAICS 334), respectively, which were both drawn from the KLEMS database. Industry-specific deflators for services and non-services inputs (material and energy) were taken from KLEMS to deflate the denominators.
Because the SUTs allow for a finer product disaggregation than that of capital data, services or goods that are related to non-Internet telecommunications in particular (e.g., telephone services, radio and television broadcasting, communications cables) were excluded to focus on information- and computer-related inputs, which are deemed to be more closely linked to digitalization and also more widely used across industries. Alternative metrics that included non-Internet telecommunications products and services were also constructed and showed high rank correlations with those, excluding non-Internet telecommunications goods and services. The largest difference was observed in the broadcasting (except Internet) and telecommunications, and motion picture and sound recording industries, which tend to be more digital when all telecommunications-related inputs are included.

Data table for Chart 2
| Industry | 2000 to 2002 | 2013 to 2015 |
|---|---|---|
| Use intensity of intermediate ICT services (number) | ||
| Panel A - Goods sectors | ||
| Agriculture, forestry, fishing and hunting | 0.001 | 0.001 |
| Oil and gas extraction | 0.049 | 0.040 |
| Mining and quarrying (except oil and gas) | 0.021 | 0.024 |
| Support activities for mining, and oil and gas extraction | 0.001 | 0.004 |
| Utilities | 0.093 | 0.086 |
| Construction | 0.002 | 0.007 |
| Food manufacturing | 0.009 | 0.002 |
| Beverage and tobacco product manufacturing | 0.015 | 0.003 |
| Textile mills and textile product mills | 0.014 | 0.002 |
| Clothing manufacturing, and leather and allied product manufacturing | 0.013 | 0.008 |
| Wood product manufacturing | 0.010 | 0.002 |
| Paper manufacturing | 0.007 | 0.001 |
| Printing and related support activities | 0.021 | 0.006 |
| Petroleum and coal products manufacturing | 0.022 | 0.005 |
| Chemical manufacturing | 0.010 | 0.007 |
| Plastics and rubber products manufacturing | 0.016 | 0.005 |
| Non-metallic mineral product manufacturing | 0.017 | 0.006 |
| Primary metal manufacturing | 0.009 | 0.002 |
| Fabricated metal product manufacturing | 0.017 | 0.005 |
| Machinery manufacturing | 0.014 | 0.008 |
| Computer and electronic product manufacturing | 0.029 | 0.015 |
| Electrical equipment, appliance and component manufacturing | 0.020 | 0.017 |
| Transportation equipment manufacturing | 0.016 | 0.008 |
| Furniture and related product manufacturing | 0.014 | 0.004 |
| Miscellaneous manufacturing | 0.025 | 0.015 |
| Panel B - Service sectors | ||
| Wholesale trade | 0.042 | 0.026 |
| Retail trade | 0.031 | 0.024 |
| Air transportation | 0.006 | 0.021 |
| Rail transportation | 0.002 | 0.004 |
| Water transportation | 0.000 | 0.001 |
| Truck transportation | 0.008 | 0.012 |
| Pipeline transportation | 0.082 | 0.109 |
| Other transportation activities | 0.012 | 0.022 |
| Warehousing and storage, postal service, and courriers and messengers | 0.047 | 0.053 |
| Publishing industries, information services and data processing services | 0.145 | 0.174 |
| Motion picture and sound recording industries | 0.002 | 0.003 |
| Broadcasting (except Internet) and telecommunications | 0.046 | 0.091 |
| Finance and insurance | 0.075 | 0.103 |
| Real estate and rental and leasing | 0.014 | 0.011 |
| Architectural, legal, accounting, engineering and related services | 0.084 | 0.131 |
| Advertising, public relations and related services | 0.035 | 0.039 |
| Design, computer systems, management, technical, scientific and other professional services | 0.191 | 0.248 |
| Administrative and support services | 0.031 | 0.043 |
| Waste management and remediation services | 0.041 | 0.055 |
| Educational services | 0.015 | 0.029 |
| Health care and social assistance | 0.010 | 0.017 |
| Arts, entertainment and recreation | 0.012 | 0.017 |
| Accommodation and food services | 0.009 | 0.012 |
| Other services (except public administration) | 0.012 | 0.018 |
| Public administration | 0.032 | 0.040 |
|
Notes: Industries are abbreviated due to space limitations. Refer to Table A.1. for the full name and classification of abbreviated industries. ICT: Information and communications technology. Sources: Statistics Canada, tables 36-10-0424-01 and 36-10-0478-01. Authors' calculations. |
||
The results for the intensity of use of ICT services show that both the levels and changes in use of ICT services were split clearly between two groups of industries (Chart 2). First, the manufacturing, construction, and agriculture and forestry sectors, as well as most of the transportation sector, had a relatively low use of ICT services. Moreover, most of them decreased their intensity of use over time.Note Second, most service sectors, such as information services, broadcasting and telecommunications, financial services, and professional and technical services, showed a high intensity of ICT services use.Note The changes observed were also much more positive, with all of these sectors progressing over the sample period. The use of ICT services in the pipeline transportation industry was quite intensive compared with the rest of the transportation sector, the intensity of which was even higher than that of the finance and insurance and telecommunications industries from 2013 to 2015.
With regard to ICT goods (excluding non-Internet telecommunications products, Appendix E), their use was concentrated in a very narrow subset of industries and computer and electronic products manufacturing clearly dominated the ranking. However, this high intensity of use of ICT goods may simply reflect the fact that many computer and electronic components are purchased and assembled into final products that are subsequently sold to consumers. In so doing, firms may not necessarily use ICT goods to replace or complement ICT investments for the purpose of digitalization. Broadcasting and telecommunications services, as well as information services and health care to a lesser extent, also demonstrated relatively higher intensities. Most industries did not experience much change over the two periods, with the exception of broadcasting and telecommunications and information services.
In the end, because it was concentrated primarily in a narrow subset of industries, the metric on intermediate ICT goods use was excluded from the final composite index.
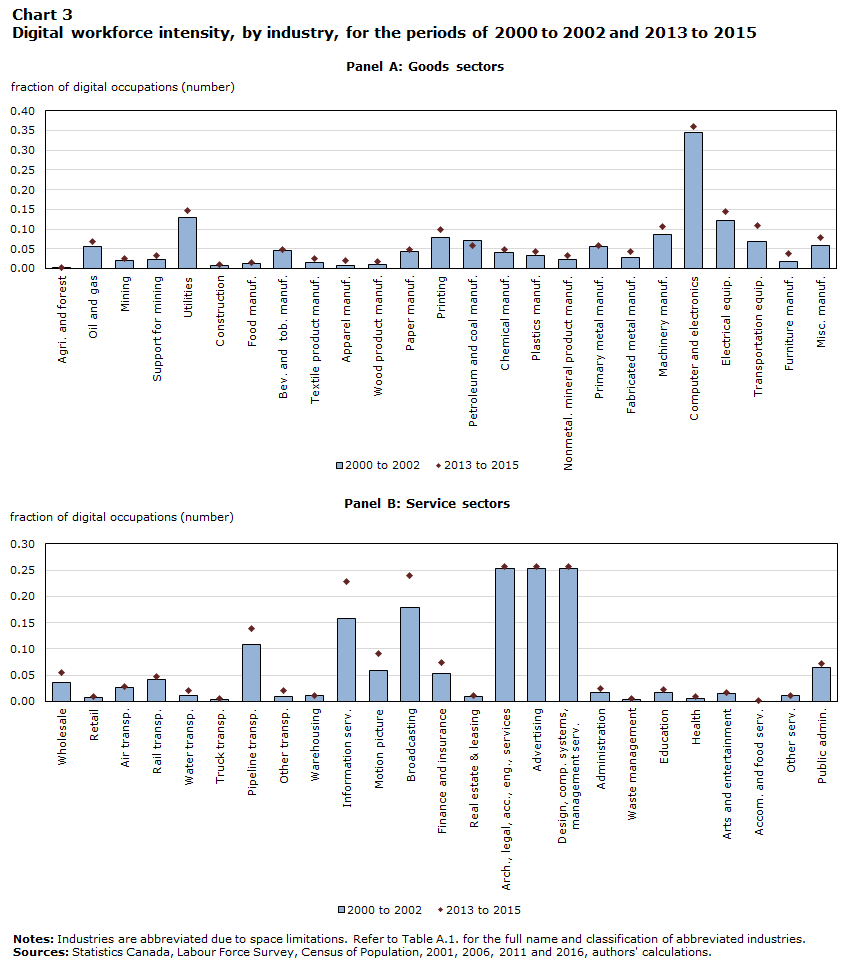
Digital workforce
Having a digital workforce, i.e., one with a high level of digital and computer literacy, can be of the utmost importance for a firm looking to take full advantage of the benefits of digitalization. As the technological architecture becomes more complex and sophisticated, the need for on-site employees capable of maintaining and monitoring the different systems may become greater. It has been shown that a lack of ICT skills is an impediment to digital technology adoption and diffusion (Andrews et al. 2018).
The occupation data from Statistics Canada’s census (2001, 2006, 2011 and 2016) and Labour Force Survey (LFS) (2001 to 2016) were used to measure the intensity of the digital workforce. First, a list of digital occupations was selected based on the examination of similar studies that characterized the digital workforce (Calvino, Criscuolo, Marcolin and Squicciarini 2018; Manyika et al. 2015; Lamb and Seddon 2016).Note Compared with Calvino, Criscuolo, Marcolin and Squicciarini (2018), the digital occupations selected for this study were noticeably broader, including not only occupations related to computers, information systems, databases and software, but also occupations in electronic, industrial and aerospace engineering, as well as graphic design. However, these occupations are narrower than those used in Manyika et al. (2015) and Lamb and Seddon (2016), as they excluded office support workers, data entry clerks, chemists, physicists, university professors, telecommunications cable workers and certain technicians (e.g., industrial and aircraft instrument and cable TV service technicians). Certain other occupations were also included, such as statistical research officers, industrial and manufacturing engineers and technologists, and electrical and electronic technologists, which were not used in previous studies.
Second, data on digital occupations and total employment for each industry were drawn from the census and LFS and used to compute the following metric:
Where is the digital workforce metric, is the sum of workers employed in the digital occupations defined in this study and is the sum of all workers, all for industry at time .
For the purposes of this study, a worker is defined as an individual who was recorded as being employed in a particular industry and under a particular occupation for the reference period. Therefore, it does not control for intra-year changes in employment or employment status (e.g., part time, full time, permanent, temporary). It may also exclude workers who are employed in non-digital occupations but who might perform some digital tasks.
While the LFS is conducted every month, the census is conducted only every five years. Therefore, the monthly LFS data were aggregated to annual frequency and used to infer the employment dynamics between two adjacent censuses.Note
Results from this metric show that the computer and electronics manufacturing industry was the clear leader in terms of digital workforce (Chart 3, Panel A), as their digital workforce accounted for about 34% of its total workforce in the first period studied. A relatively high proportion of the workforce of professional services industries (e.g., architecture, engineering, computer design) was part of the digital workforce—about 25% over the first period. However, data limitations prevented a more granular view of this sector from being obtained, masking some potential heterogeneity. Information, culture and telecommunications were the third-highest industries in terms of digital workforce. The motion pictures and sound recording industries appeared to employ a digital workforce the size of those in many manufacturing industries. It is also important to note that the pipeline transportation industry employs a relatively higher share of the digital workforce and its share has also increased over time. Although this contrasts with its ICT capital and investment intensities, it is consistent with its higher intensity of intermediate ICT services use, as seen in the previous section. Lastly, information, culture and telecommunications experienced the largest increase in digital workforce intensity over the two time periods—between 6 and 7 percentage points. Transportation equipment manufacturing also recorded a relatively high increase over time, which likely reflects advances in this industry, with cars becoming more digitalized and robotization becoming more prevalent (more on this in the next section).
Data table for Chart 3
| Industry | 2000 to 2002 | 2013 to 2015 |
|---|---|---|
| Fraction of digital occupations (number) | ||
| Panel A - Goods sectors | ||
| Agriculture, forestry, fishing and hunting | 0.002 | 0.002 |
| Oil and gas extraction | 0.057 | 0.068 |
| Mining and quarrying (except oil and gas) | 0.020 | 0.026 |
| Support activities for mining, and oil and gas extraction | 0.023 | 0.032 |
| Utilities | 0.130 | 0.147 |
| Construction | 0.007 | 0.010 |
| Food manufacturing | 0.012 | 0.015 |
| Beverage and tobacco product manufacturing | 0.045 | 0.049 |
| Textile mills and textile product mills | 0.015 | 0.025 |
| Clothing manufacturing, and leather and allied product manufacturing | 0.008 | 0.020 |
| Wood product manufacturing | 0.011 | 0.019 |
| Paper manufacturing | 0.044 | 0.049 |
| Printing and related support activities | 0.079 | 0.100 |
| Petroleum and coal products manufacturing | 0.070 | 0.058 |
| Chemical manufacturing | 0.041 | 0.049 |
| Plastics and rubber products manufacturing | 0.032 | 0.042 |
| Non-metallic mineral product manufacturing | 0.024 | 0.033 |
| Primary metal manufacturing | 0.055 | 0.059 |
| Fabricated metal product manufacturing | 0.029 | 0.042 |
| Machinery manufacturing | 0.087 | 0.106 |
| Computer and electronic product manufacturing | 0.345 | 0.359 |
| Electrical equipment, appliance and component manufacturing | 0.121 | 0.144 |
| Transportation equipment manufacturing | 0.068 | 0.110 |
| Furniture and related product manufacturing | 0.019 | 0.037 |
| Miscellaneous manufacturing | 0.059 | 0.079 |
| Panel B - Service sectors | ||
| Wholesale trade | 0.035 | 0.054 |
| Retail trade | 0.008 | 0.010 |
| Air transportation | 0.026 | 0.029 |
| Rail transportation | 0.041 | 0.047 |
| Water transportation | 0.011 | 0.020 |
| Truck transportation | 0.003 | 0.005 |
| Pipeline transportation | 0.108 | 0.138 |
| Other transportation activities | 0.010 | 0.021 |
| Warehousing and storage, postal service, and courriers and messengers | 0.012 | 0.012 |
| Publishing industries, information services and data processing services | 0.158 | 0.228 |
| Motion picture and sound recording industries | 0.058 | 0.091 |
| Broadcasting (except Internet) and telecommunications | 0.178 | 0.239 |
| Finance and insurance | 0.053 | 0.074 |
| Real estate and rental and leasing | 0.009 | 0.012 |
| Architectural, legal, accounting, engineering and related services | 0.252 | 0.257 |
| Advertising, public relations and related services | 0.252 | 0.257 |
| Design, computer systems, management, technical, scientific and other professional services | 0.252 | 0.257 |
| Administrative and support services | 0.016 | 0.025 |
| Waste management and remediation services | 0.004 | 0.005 |
| Educational services | 0.017 | 0.022 |
| Health care and social assistance | 0.006 | 0.009 |
| Arts, entertainment and recreation | 0.014 | 0.016 |
| Accommodation and food services | 0.000 | 0.001 |
| Other services (except public administration) | 0.011 | 0.012 |
| Public administration | 0.065 | 0.072 |
|
Notes: Industries are abbreviated due to space limitations. Refer to Table A.1. for the full name and classification of abbreviated industries. Sources: Statistics Canada, Labour Force Survey, Census of Population, 2001, 2006, 2011 and 2016, authors' calculations. |
||
Robotization
Robot use is one of the key features of the new digital economy. Robots are different from traditional machinery and equipment because of their high degree of automation with little human intervention. According to the International Federation of Robotics (IFR), an industrial robot is “an automatically controlled, re-programmable, multipurpose manipulator programmable in three or more axes, which can be either fixed in place or mobile for use in industrial applications” (IFR 2017). This has had and likely will continue to have significant impacts on production processes by replacing routine skill-performing labour and creating demand for new task-performing labour (Acemoglu and Restrepo 2019; Acemoglu, LeLarge and Restrepo forthcoming; Dixon, Hong and Wu 2020).
Data on robots in Canada were taken from the import data administered by the Canada Border Services Agency, as most robots in the country are purchased from international producers (Dixon 2020). The import data contain detailed commodity codes that can identify robots separately from other machinery and equipment, as well as the value of imports. The total value of robot stock is comparable to the shipment data provided by the IFR and the Robotic Industries Association (Dixon 2020).
To gauge the intensity of robot adoption across industries, a metric was derived by dividing the real value of robot stock by industry-level employment from the LFS. The value of robot stock was calculated using a perpetual inventory method assuming 12 years of useful life.Note
Chart 4 plots the average robot intensity over the 2013-2015 period against that in the 2000-2002 period for major industries, which was measured in millions of chained 2007 dollars per 100 employees.Note Unsurprisingly, robot adoption has taken place primarily in manufacturing industries, particularly in the machinery (NAICS 333), transportation equipment (NAICS 336), computer and electronic product (NAICS 334), primary metal (NAICS 331), and plastics and rubber product (NAICS 326) manufacturing industries. These industries have also increased their adoption of robots relative to employment over time, as illustrated by appearing above the 45-degree line.Note In particular, the machinery manufacturing industry had the highest robot intensity over the two periods examined. The transportation equipment manufacturing (mainly the automobile industry) has experienced the highest increase. The wholesale industry (NAICS 41) has had relatively stable robot adoption, as demonstrated by the fact that it lies almost directly on the 45-degree line. Robot adoption was largely negligible in the other industries.

Data table for Chart 4
| avearge robot intensity, 2000 to 2002 | 2013 to 2015 |
|---|---|
| 0.000 | 0.001 |
| 0.002 | 0.016 |
| 0.003 | 0.008 |
| 0.004 | 0.009 |
| 0.011 | 0.110 |
| 0.012 | 0.075 |
| 0.023 | 0.141 |
| 0.024 | 0.068 |
| 0.025 | 0.023 |
| 0.078 | 0.141 |
|
Notes: NAICS: North American Industry Classification System. NAICS 325 represents chemical manufacturing; NAICS 326 for plastics and rubber product manufacturing; NAICS 331 for primary metal manufacturing; NAICS 332 for fabricated metal product manufacturing; NAICS 333 for machinery manufacturing; NAICS 334 for computer and electronic product manufacturing; NAICS 335 for electrical equipment, appliance and component manufacturing; NAICS 336 for transportation equipment manufacturing; NAICS 41 for wholesale trade; and NAICS 61 for educational services. The three industries that lie in the bottom left corner include NAICS 61, 325 and 335. Sources: Statistics Canada, Dixon (2020), Labor Force Survey, and authors' calculations. |
|
A composite index of digital intensity
Constructing a composite index of digital intensity
Although the multidimensional metrics discussed in the previous sections were able to capture different aspects of digitalization, a single composite index that can capture not only multidimensional information but also make comparisons across sectors and over time more practical is desired. This step is important because none of the individual metrics were designed—nor are they expected to provide—a complete picture of how digital technologies are used in industries’ production processes.
Following the literature on building composite indexes (e.g., OECD 2008; Nicoletti et al. 2000), a PCA was used to compute the weights with which the individual indicators can be aggregated. The implementation of the PCA is described in Appendix H. A PCA is appealing because its dimensionality reduction is based entirely on the underlying data, independent of any priors on relative importance, and the resulting common components are able to capture a large amount of the variation in the underlying data.
Table 1 lists the weights derived from the first two principal components, and they can be used to construct the composite index. Together, the first two principal components (PC-1&2) explain over 80% of the total variance in the underlying data, with the first principal component (PC-1) accounting for 53% and the second (PC-2) accounting for 28%.
| PC-1 | PC-2 | PC-1 and 2 | |
|---|---|---|---|
| percent | |||
| Information and communications technology services (no telecommunications) | 33 | 3 | 23 |
| Digital labour | 34 | 10 | 23 |
| Information and communications technology services capital | 33 | 1 | 23 |
| Robots | 0 | 86 | 31 |
|
Notes: ICT: Information and communications technology. PC-1 refers to the first principal component, PC-2 refers to the second principal component, and PC-1&2 refers to the first and second principal components. Source: Statistics Canada, authors' calculations. |
|||
Weights based on different principal components revealed some interesting patterns related to digitalization across industries. PC-1 implies equal weights among the underlying metrics, except the use of robots, to which a weight of zero was assigned. Therefore, digitalization was manifested by an equal use of conventional digital inputs (e.g., capital, labour and intermediate services) in the production process. By contrast, digitalization concerns primarily the use of robots, based on PC-2. The orthogonality between principal components suggests distinct patterns of digitalization across industries. This difference may reflect the fact that robots tend to differ from other conventional digital inputs in the following ways: a) robots are different from conventional machinery and equipment because of their high degree of automation, and b) robots replace labour-performing routine tasks while increasing demand for higher-skilled workers.
As a result, the choice of principal components has different implications on the final composite indexes. A final index based on the weights from PC-1 tended to disregard the role of robot adoption in digitalization, which does not favour the manufacturing industries, particularly machinery and transportation equipment manufacturing. However, if the final index was based on PC-2 alone, it would focus only on the use of robots, granting significant importance to manufacturing industries.
This study adopted the weights from PC-1&2 to construct the final composite index through a linear aggregation.Note This made it possible to balance different digital inputs and make the cross-industry comparisons more consistent.Note Note The following sections present the final index of digital intensity. First, digital intensity by detailed industry and over time is presented, followed by a ranking of industry based on the index of digital intensity. Lastly, a national index of digital intensity was built to illustrate the economy-wide progression of digitalization.
A composite index of digital intensity by industry
Digital intensity in goods sectors was lower than that in service sectors on average for both time periods (Chart 5).Note The average digital intensity in goods sectors was 0.12 from 2000 to 2002, compared with 0.2 in the service sectors. Although the average digital intensity increased to 0.23 from 2013 to 2015 in the goods sectors, it was still lower than that in the service sectors (0.29).
While most goods sectors (e.g., agriculture, mining, construction and most manufacturing industries) have low digital intensities in general, there are some with relatively high levels, such as utilities, machinery manufacturing, computer and electronic products manufacturing, and transportation equipment manufacturing. In particular, machinery manufacturing, computer and electronic products manufacturing, and transportation equipment manufacturing all experienced a significant increase in digital intensity over time, which is attributable to their more intensive use of robots.
Among the service sectors, information services; broadcasting and telecommunications; and design, computer systems, management, technical, scientific, engineering and other professional services had the highest digital intensity from 2000 to 2015. These industries also experienced large increases in intensity over time—from 27% in the publishing, data processing, hosting and other information services industries to 53% in the advertising, public relations and related services industries.
Over time, only petroleum and coal products manufacturing, and nonmetallic mineral product manufacturing recorded a decrease in digital intensity.
Another way to look at the progression of digital intensity is to compare initial levels with changes over time (Chart 6). When this is done, it appears that the industries are grouped around two main clusters—one on the top right and the other on the bottom left. The industries in the top right cluster include computer and electronic products manufacturing (334); machinery manufacturing (333); publishing and data processing services (511, 518); broadcasting and telecommunications (515, 517); and professional, scientific and technical services (541). These industries are leaders in the use of digital inputs, starting out high and experiencing large increases. In contrast, agriculture, mining, construction, and most of manufacturing and transportation lie in the bottom left cluster, most of which started out low and experienced small increases. Transportation equipment manufacturing (336), primary metal manufacturing (331), plastic manufacturing (326), clothing manufacturing (315), and education and health services (61, 62) were among the catch-ups, meaning they started low but experienced significant increases.
This stylized fact suggests that there is a positive relationship between the initial levels of digital intensity and subsequent changes.Note In other words, industries with greater digital input use at the beginning of the sample period were more likely to experience a larger increase in digitalization in the future.Note This points to the presence of polarized digitalization in Canadian industries, as there are some industries at the forefront and that continually invest in digitalization, and there are others that lag behind and do not improve much over time. The low adoption and diffusion of digitalization among some of these industries may be attributable to the nature of their own sectors. Low managerial quality, a lack of ICT skills and poor matching of workers to jobs may also play a role in curbing digitalization (Andrews et al. 2018).

Data table for Chart 5
| Industry | 2000 to 2002 | 2013 to 2015 |
|---|---|---|
| Index of digital intensity (number) | ||
| Panel A - Goods sectors | ||
| Agriculture, forestry, fishing and hunting | 0.001 | 0.014 |
| Oil and gas extraction | 0.127 | 0.187 |
| Mining and quarrying (except oil and gas) | 0.053 | 0.088 |
| Support activities for mining, and oil and gas extraction | 0.024 | 0.075 |
| Utilities | 0.297 | 0.344 |
| Construction | 0.014 | 0.060 |
| Food manufacturing | 0.037 | 0.064 |
| Beverage and tobacco product manufacturing | 0.087 | 0.103 |
| Textile mills and textile product mills | 0.108 | 0.188 |
| Clothing manufacturing, and leather and allied product manufacturing | 0.042 | 0.157 |
| Wood product manufacturing | 0.033 | 0.051 |
| Paper manufacturing | 0.069 | 0.092 |
| Printing and related support activities | 0.132 | 0.224 |
| Petroleum and coal products manufacturing | 0.095 | 0.075 |
| Chemical manufacturing | 0.074 | 0.148 |
| Plastics and rubber products manufacturing | 0.159 | 0.331 |
| Non-metallic mineral product manufacturing | 0.072 | 0.066 |
| Primary metal manufacturing | 0.112 | 0.343 |
| Fabricated metal product manufacturing | 0.067 | 0.150 |
| Machinery manufacturing | 0.406 | 0.697 |
| Computer and electronic product manufacturing | 0.514 | 0.919 |
| Electrical equipment, appliance and component manufacturing | 0.170 | 0.307 |
| Transportation equipment manufacturing | 0.186 | 0.672 |
| Furniture and related product manufacturing | 0.057 | 0.130 |
| Miscellaneous manufacturing | 0.111 | 0.191 |
| Panel B - Service sectors | ||
| Wholesale trade | 0.232 | 0.254 |
| Retail trade | 0.087 | 0.157 |
| Air transportation | 0.043 | 0.083 |
| Rail transportation | 0.056 | 0.095 |
| Water transportation | 0.020 | 0.046 |
| Truck transportation | 0.025 | 0.046 |
| Pipeline transportation | 0.247 | 0.332 |
| Other transportation activities | 0.041 | 0.088 |
| Warehousing and storage, postal service, and courriers and messengers | 0.102 | 0.144 |
| Publishing industries, information services and data processing services | 0.576 | 0.730 |
| Motion picture and sound recording industries | 0.237 | 0.304 |
| Broadcasting (except Internet) and telecommunications | 0.462 | 0.650 |
| Finance and insurance | 0.197 | 0.314 |
| Real estate and rental and leasing | 0.058 | 0.071 |
| Architectural, legal, accounting, engineering and related services | 0.509 | 0.750 |
| Advertising, public relations and related services | 0.422 | 0.646 |
| Design, computer systems, management, technical, scientific and other professional services | 0.700 | 0.977 |
| Administrative and support services | 0.192 | 0.280 |
| Waste management and remediation services | 0.193 | 0.251 |
| Educational services | 0.100 | 0.220 |
| Health care and social assistance | 0.049 | 0.200 |
| Arts, entertainment and recreation | 0.094 | 0.153 |
| Accommodation and food services | 0.033 | 0.075 |
| Other services (except public administration) | 0.127 | 0.169 |
| Public administration | 0.185 | 0.240 |
|
Notes: Industries are abbreviated due to space limitations. Refer to Table A.1. for the full name and classification of abbreviated industries. Source: Statistics Canada, authors' calculations. |
||

Data table for Chart 6
| Digital intensity (number), 2000 to 2002 | Change in digital intensity, from 2000 -2002 to 2013 - 2015 |
|---|---|
| 0.001 | 0.013 |
| 0.127 | 0.061 |
| 0.053 | 0.035 |
| 0.024 | 0.052 |
| 0.297 | 0.047 |
| 0.014 | 0.045 |
| 0.037 | 0.027 |
| 0.087 | 0.017 |
| 0.108 | 0.079 |
| 0.042 | 0.115 |
| 0.033 | 0.018 |
| 0.069 | 0.023 |
| 0.132 | 0.092 |
| 0.095 | -0.020 |
| 0.074 | 0.074 |
| 0.159 | 0.173 |
| 0.072 | -0.005 |
| 0.112 | 0.231 |
| 0.067 | 0.083 |
| 0.406 | 0.291 |
| 0.514 | 0.405 |
| 0.170 | 0.137 |
| 0.186 | 0.485 |
| 0.057 | 0.073 |
| 0.111 | 0.080 |
| 0.232 | 0.022 |
| 0.087 | 0.070 |
| 0.043 | 0.040 |
| 0.056 | 0.039 |
| 0.020 | 0.026 |
| 0.025 | 0.021 |
| 0.247 | 0.085 |
| 0.041 | 0.047 |
| 0.102 | 0.042 |
| 0.576 | 0.155 |
| 0.237 | 0.067 |
| 0.462 | 0.188 |
| 0.197 | 0.117 |
| 0.058 | 0.012 |
| 0.509 | 0.241 |
| 0.422 | 0.223 |
| 0.700 | 0.277 |
| 0.192 | 0.089 |
| 0.193 | 0.058 |
| 0.100 | 0.120 |
| 0.049 | 0.151 |
| 0.094 | 0.058 |
| 0.033 | 0.043 |
| 0.127 | 0.041 |
| 0.185 | 0.055 |
|
Note: NAICS: North American Industry Classification System. Source: Statistics Canada, authors' calculations. |
|
Ranking of digital intensity across industries
Based on the final composite index, sectors can be ranked into four quartiles based on their digital intensities. A digitally intensive sector can be defined as having an intensity in the top quartile. Table 2 illustrates these rankings for the two time periods (columns A and B). For example, from 2013 to 2015, the digitally intensive sectors (labelled “high”) included utilities; plastics and rubber product manufacturing; primary metal manufacturing; machinery manufacturing; computer and electronic product manufacturing; transportation equipment manufacturing; pipeline transportation; publishing and data processing; broadcasting and telecommunications; and professional, scientific and technical services. These industries were also in the high or medium-to-high quartiles in the earlier period. In contrast, agriculture, construction, food product manufacturing, and accommodation and food services were among the industries with the lowest digital intensities over the two periods.
Although this ranking of digital intensity was useful for making between-industry comparisons, it cannot determine the magnitude of underlying differences between industries or of changes within industries. For example, while the agriculture industry is ranked among those with the lowest digital intensity over the two periods of study, the ranking cannot account for the fact that its digital intensity increased tenfold over that time.Note
The characterization of digitally intensive sectors in this study is broader than that used in Calvino, Criscuolo, Marcolin and Squicciarini (2018)—hereafter referred to as CCMS—where only transportation equipment manufacturing; publishing and data processing; broadcasting and telecommunications; and professional, scientific and technical services were characterized as digitally intensive sectors for the later period.Note While some service sectors, including finance and insurance, and administrative and support services, are also characterized as digitally intensive sectors in the CCMS, their digital intensities were characterized as medium to high in this study.
One of the main ways in which this study differs from the CCMS is that the latter used ranks to normalize each individual metric and applied equal weights to aggregation, while this study used z-scores and PCA weights. To determine whether the results were sensitive to different normalization methods and weights, an alternative index was constructed in the same way as in the CCMS, i.e., an industry j was first ranked for each individual metric considered and scaled by the total number of industries (dividing by the total number of industries), then the final index for industry j was the simple average of its scaled ranks across metrics. Each industry was then ranked into quartiles based on the CCMS’ final indexes, shown in Column C of Table 2. The two indexes exhibited a high correlation—above 0.8 for both time periods. The ranks based on the two indexes were largely consistent. Utilities; machinery manufacturing; computer and electronic products manufacturing; information services; broadcasting and telecommunications; and professional, scientific and technical services were ranked in the highest quartile by both indexes. Moreover, agriculture, construction, some manufacturing industries (e.g., food and wood manufacturing), and accommodation and food services were ranked in the lowest quartile by both indexes. Nonetheless, there were some differences between the two indexes. For example, the index based on the CCMS tended to rank some industries (e.g., petroleum, chemical products, electrical equipment and furniture manufacturing, as well as wholesale trade industries) higher, while ranking others (e.g., pipeline transportation, plastic products manufacturing, motion pictures and health services) lower.
| Industry | Rankings based on the final composite index (quartiles of digital intensity) | Ranking based on the CCMS methodology | |
|---|---|---|---|
| Column A | Column B | Column C | |
| 2000 to 2002 | 2013 to 2015 | 2013 to 2015 | |
| Utilities | high | high | high |
| Plastics and rubber products manufacturing | medium-high | high | medium-high |
| Primary metal manufacturing | medium-high | high | medium-low |
| Machinery manufacturing | high | high | high |
| Computer and electronic product manufacturing | high | high | high |
| Transportation equipment manufacturing | medium-high | high | medium-high |
| Pipeline transportation | high | high | medium-high |
| Publishing industries (except Internet), data processing, hosting, and related services, and other information services | high | high | high |
| Broadcasting (except internet) and Telecommunications | high | high | high |
| Architectural, engineering and related services, accounting, tax preparation, bookkeeping and payroll services, and legal services | high | high | high |
| Advertising, public relations and related services | high | high | high |
| Computer systems design and related services, management, scientific and technical consulting services, scientific research and development services, specialized design services, other professional, scientific and technical services | high | high | high |
| Oil and gas extraction | medium-high | medium-high | medium-high |
| Textile mills and textile product mills | medium-high | medium-high | medium-low |
| Printing and related support activities | medium-high | medium-high | medium-high |
| Electrical equipment, appliance and component manufacturing | medium-high | medium-high | high |
| Miscellaneous manufacturing | medium-high | medium-high | high |
| Wholesale trade | high | medium-high | high |
| Motion picture and sound recording industries | high | medium-high | medium-low |
| Finance and insurance | high | medium-high | medium-high |
| Administrative and support services | medium-high | medium-high | medium-high |
| Waste management and remediation services | medium-high | medium-high | medium-high |
| Educational services | medium-low | medium-high | medium-high |
| Health care and social assistance | low | medium-high | medium-low |
| Public administration | medium-high | medium-high | high |
| Mining and quarrying (except oil and gas) | medium-low | medium-low | medium-low |
| Beverage and tobacco product manufacturing | medium-low | medium-low | medium-low |
| Clothing, leather and allied product manufacturing | low | medium-low | medium-low |
| Paper manufacturing | medium-low | medium-low | low |
| Chemical manufacturing | medium-low | medium-low | medium-high |
| Fabricated metal product manufacturing | medium-low | medium-low | medium-high |
| Furniture and related product manufacturing | medium-low | medium-low | medium-high |
| Retail trade | medium-low | medium-low | medium-low |
| Rail transportation | medium-low | medium-low | low |
| Transit and ground passenger transportation,scenic and sightseeing transportation, and support activities for transportation | low | medium-low | medium-low |
| Postal service, couriers and messengers, and warehousing and storage | medium-high | medium-low | medium-low |
| Arts, entertainment and recreation | medium-low | medium-low | medium-low |
| Other services (except public administration) | medium-high | medium-low | medium-high |
| Agriculture, forestry, fishing and hunting | low | low | low |
| Support activities for mining, and oil and gas extraction | low | low | low |
| Construction | low | low | low |
| Food manufacturing | low | low | low |
| Wood product manufacturing | low | low | low |
| Petroleum and coal product manufacturing | medium-low | low | medium-low |
| Non-metallic mineral product manufacturing | medium-low | low | medium-low |
| Air transportation | low | low | low |
| Water transportation | low | low | low |
| Truck transportation | low | low | low |
| Real estate and rental and leasing | medium-low | low | low |
| Accommodation and food services | low | low | low |
|
Note: CCMS: Calvino, Criscuolo, Marcolin and Squicciarini (2018). Source: Statistics Canada, authors' calculations. |
|||
An index of digital intensity for Canada
As a final step, an economy-wide index of digital intensity for Canada was created by weighting industry-level composite indexes by each industry’s nominal share of gross domestic product (GDP).
The national index is presented as the difference from its level in 2000 (Chart 7). It shows that the Canadian economy became more digitalized over this period, from the perspective of how digital inputs are used in the production process. This increase in digital intensity may be attributable to the fact that almost all industries have increased their digital intensity over time, as shown previously. It may also be the result of a shift in the Canadian economy toward some sectors with increased importance and significant growth in digital intensity at the same time, for example, finance and insurance; professional, scientific and technical services; and education and health care services.Note Digital intensity has increased continuously since 2000, with only one decline between 2009 and 2010.

Data table for Chart 7
| Nationl index of digital intensity (number) | |
|---|---|
| 2000 | 0.000 |
| 2001 | 0.005 |
| 2002 | 0.020 |
| 2003 | 0.051 |
| 2004 | 0.068 |
| 2005 | 0.108 |
| 2006 | 0.132 |
| 2007 | 0.168 |
| 2008 | 0.185 |
| 2009 | 0.199 |
| 2010 | 0.184 |
| 2011 | 0.217 |
| 2012 | 0.249 |
| 2013 | 0.267 |
| 2014 | 0.290 |
| 2015 | 0.305 |
| Source: Statistics Canada, authors' calculations. | |
Concluding remarks
Digitalization in Canada has been ubiquitous. However, measuring digitalization is challenging because of its multifaceted nature. This study presents multidimensional metrics based on multiple data sources to capture the versatility of digital technologies and inputs used in the production process. These multidimensional metrics were aggregated into a composite index using weights from a PCA. The resulting composite index implied a ranking of digital intensity across industries comparable to that of other existing indexes. Moreover, it can better measure the magnitudes of sectoral and temporal variations in digitalization.
The final composite index suggests that Canada’s economy-wide digital intensity improved continually from 2000 to 2015. Almost all industries became more digitally intensive over that time. Information services; telecommunications; and professional, scientific and technical services, as well as the machinery, computer and electronic products, and transportation equipment manufacturing industries were among the leaders in digital intensity. Their intensities were high at the beginning of the sample period and experienced a large increase over time. Agriculture, mining, construction, and most manufacturing and transportation industries were among the least digitally intensive sectors, as they started out low and experienced a small increase over the period. This suggests an uneven digitalization across Canadian industries, as some industries have been at the forefront of digital technology adoption, and others have lagged behind and have not improved much relative to others over time. It is important to understand why industries differ in their adoption and diffusion of digital technologies. Factors that could explain a low rate of adoption and diffusion include low managerial quality, a lack of ICT skills and poor matching of workers to jobs (Andrews et al. 2018).
This index of digital intensity serves as a practical tool to better assess the extent to which digital technologies are embraced in the Canadian economy, from the point of view of the use of digital inputs in production processes. This index does not capture the full extent of digitalization in the Canadian economy and society. However, it is flexible enough to incorporate new information on digitalization as it becomes available, such as more detailed and updated information on e-commerce, databases and data analytics, and digital-related research and development activities.
Measuring digital intensity is just the first step in better understanding the impacts of digitalization on the Canadian economy. The characterization of digitally intensive sectors can provide a useful tool for future research on understanding the relationships between digital technologies and competition, innovation, business dynamism and productivity growth.
Appendix A – Industry classification
| Industry label | Industry code | Industry name |
|---|---|---|
| Agri. and forest | 11 | Agriculture, forestry, fishing and hunting |
| Oil and gas | 211 | Oil and gas extraction |
| Mining | 212 | Mining and quarrying (except oil and gas) |
| Support for mining | 213 | Support activities for mining, and oil and gas extraction |
| Utilities | 22 | Utilities |
| Construction | 23 | Construction |
| Food manuf. | 311 | Food manufacturing |
| Bev. and tob. manuf | 312 | Beverage and tobacco product manufacturing |
| Textile product manuf. | 313, 314 | Textile mills and textile product mills |
| Apparel manuf. | 315, 316 | Clothing, leather and allied product manufacturing |
| Wood product manuf. | 321 | Wood product manufacturing |
| Paper manuf. | 322 | Paper manufacturing |
| Printing | 323 | Printing and related support activities |
| Petroleum and coal manuf. | 324 | Petroleum and coal product manufacturing |
| Chemical manuf. | 325 | Chemical manufacturing |
| Plastics manuf. | 326 | Plastics and rubber products manufacturing |
| Nonmetallic mineral product manuf. | 327 | Non-metallic mineral product manufacturing |
| Primary metal manuf. | 331 | Primary metal manufacturing |
| Fabricated metal manuf. | 332 | Fabricated metal product manufacturing |
| Machinery manuf. | 333 | Machinery manufacturing |
| Computer and electronics | 334 | Computer and electronic product manufacturing |
| Electrical equip. | 335 | Electrical equipment, appliance and component manufacturing |
| Transportation equip. | 336 | Transportation equipment manufacturing |
| Furniture manuf. | 337 | Furniture and related product manufacturing |
| Misc. manuf. | 339 | Miscellaneous manufacturing |
| Wholesale | 41 | Wholesale trade |
| Retail | 44, 45 | Retail trade |
| Air transp. | 481 | Air transportation |
| Rail transp. | 482 | Rail transportation |
| Water transp. | 483 | Water transportation |
| Truck transp. | 484 | Truck transportation |
| Pipeline transp. | 486 | Pipeline transportation |
| Other transp. | 485, 487, 488 | Transit and ground passenger transportation Scenic and sightseeing transportation Support activities for transportation |
| Warehousing | 491, 492, 493 | Postal service Couriers and messengers Warehousing and storage |
| Information serv. | 511, 518, 519 | Publishing industries (except Internet) Data processing, hosting, and related services Other information services |
| Motion picture | 512 | Motion picture and sound recording industries |
| Broadcasting | 515, 517 | Broadcasting (except internet) Telecommunications |
| Finance and insurance | 52 | Finance and insurance |
| Real estate and leasing | 53 | Real estate and rental and leasing |
| Arch., legal, acc., eng., services | 5411, 5412, 5413, | Legal services Accounting, tax preparation, bookkeeping and payroll services Architectural, engineering and related services |
| Advertising | 5418 | Advertising, public relations and related services |
| Design, comp. systems, management serv. | 5414, 5415, 5416, 5417, 5419 | Specialized design services Computer systems design and related services Management, scientific and technical consulting services Scientific research and development services Other professional, scientific and technical services |
| Administration | 561 | Administrative and support services |
| Waste management | 562 | Waste management and remediation services |
| Education | 61 | Educational services |
| Health | 62 | Health care and social assistance |
| Arts and entertainment | 71 | Arts, entertainment and recreation |
| Accom. and food serv. | 72 | Accommodation and food services |
| Other serv. | 81 | Other services (except public administration) |
| Public admin. | 91 | Public administration |
|
Note: NAICS: North American Industry Classification System. Source: Statistics Canada, authors' compilation. |
||
Appendix B – Asset classification
For the metrics relying on the National Accounts Longitudinal Microdata File (NALMF) microdata (information and communications technology [ICT] capital and investment), a classification of ICT and productivity-enhancing assets was created using capital cost allowance (CCA) codes provided in Schedule II of the Income Tax Regulations (Table B.1). A CCA asset class is considered to be ICT if most assets falling under it are unequivocally ICT-related.
| CCA code | Description | Category |
|---|---|---|
| 46 | Data network infrastructure equipment, and systems software for that equipment | ICT |
| 45 | General-purpose electronic data processing equipment and systems software for that equipment, including ancillary data processing equipment | ICT |
| 50 | General-purpose electronic data processing equipment and systems software for that equipment, including ancillary data processing equipment | ICT |
| 52 | General-purpose electronic data processing equipment and systems software for that equipment, including ancillary data processing equipment | ICT |
| 9 | Electrical generating, radar, radio transmission, radio receiving and aircraft equipment | M&E |
| 15 | Wood processing equipment | M&E |
| 16 | Motor vehicle, aircraft, truck or tractor, and coin-operated video game | M&E |
| 17 | Telephone system or data communication equipment, excluding radio communication equipment and property that is principally electronic equipment or systems software | M&E |
| 22 | Power-operated movable equipment designed for the purpose of excavating, moving, placing or compacting earth, rock, concrete or asphalt | M&E |
| 29 | Property used primarily in the manufacturing of goods for sale or lease | M&E |
| 30 | Telecommunication spacecraft or television receivers and decoders | M&E |
| 34 | Electrical, heating, and steam generating equipment | M&E |
| 35 | Railway car or rail suspension devices | M&E |
| 38 | Power-operated movable equipment designed for the purpose of excavating, moving, placing or compacting earth, rock, concrete or asphalt | M&E |
| 39 | Property used primarily in the manufacturing of goods for sale or lease | M&E |
| 40 | Powered industrial lift truck | M&E |
| 43 | Property used primarily in the manufacturing of goods for sale or lease | M&E |
| 43.1 | Energy-generating equipment | M&E |
| 43.2 | Energy-generating equipment | M&E |
| 48 | Combustion turbine | M&E |
| 14 | Patent, franchise, concession or licence | IPP |
| 44 | Property that is a patent, or a right to use patented information for a limited or unlimited period | IPP |
|
Notes: M&E: Machinery and equipment; IPP: Intellectual property product; CCA: Capital cost allowances; ICT: Information and communications technology Source: Statistics Canada, authors' compilation. |
||
Appendix C – Information and communications technology investment
The information and communications technology (ICT) investment metric was derived from two data sources. The first was Statistics Canada’s final demand tables, which contain data on investment in ICT equipment and software for 41 distinct industries.Note The second was the National Accounts Longitudinal Microdata File (NALMF) data on the acquisition costs of ICT assets during the year.Note
The metric was constructed for each of the two data sources as
Where is an investment metric, is the volume of digital investment, and is the volume of productivity-enhancing investment, all for industry at time . Alternative metrics using total non-residential investment as the denominator (including both structures and machinery and equipment) instead of productivity-enhancing assets were also constructed and, again, the results showed a very high rank correlation between the two metrics.
The final demand and NALMF data were deflated using sector- and asset-specific implicit deflators (Statistics Canada n.d.b.). The denominator values were approximated using a Törnqvist aggregation. When deflators were not available for a particular industry, deflators from its parent industry were used instead. Once again, the metrics from the two sources were aggregated into one using a principal component analysis (again in this case, a simple average), which was labelled the ICT Investment metric.Note
This ICT investment metric showed patterns similar to those of the ICT capital metric (Chart 1). The service sectors have higher ICT investment intensity than the goods sectors on average (Chart C.1). Some industries that have experienced a large increase in ICT intensity over time include oil and gas, clothing manufacturing, electrical equipment manufacturing, and finance and insurance. The advertising industry also shifted its investments drastically toward digital assets, possibly reflecting the shift away from paper-based advertising to Internet-based advertising observed in recent years. Industries in the information and culture sector still rank among the top digital industries, but have experienced much more modest progressions, with the motion picture and sound recording industry even declining slightly in terms of intensity.
Some new patterns also emerged from this perspective on digitalization. While intensification in the stock of ICT capital for the finance and insurance sector has been moderate, the rise in ICT investment intensity for this sector has been remarkable over the sample period, increasing almost threefold. This duality—of relatively low capital stock intensity but high investment intensity—could mean that this sector has begun a significant shift toward digital technologies and is gradually building its stock of ICT capital. Also noteworthy is the decline in intensity in the computer and electronic product manufacturing industry. This is likely attributable in part to the shakeup or decline of this industry after the dot-com bubble in the early 2000s. One well-known example is the collapse of Nortel Networks, which was one of the world’s largest telecommunications equipment makers at the time.

Data table for Chart C.1
| Industry | 2000 to 2002 | 2013 to 2015 |
|---|---|---|
| ICT investment intensity (number) | ||
| Panel A - Goods sectors | ||
| Agriculture, forestry, fishing and hunting | 0.015 | 0.031 |
| Oil and gas extraction | 0.018 | 0.152 |
| Mining and quarrying (except oil and gas) | 0.041 | 0.072 |
| Support activities for mining, and oil and gas extraction | 0.019 | 0.050 |
| Utilities | 0.214 | 0.191 |
| Construction | 0.027 | 0.095 |
| Food manufacturing | 0.057 | 0.101 |
| Beverage and tobacco product manufacturing | 0.110 | 0.149 |
| Textile mills and textile product mills | 0.048 | 0.158 |
| Clothing manufacturing, and leather and allied product manufacturing | 0.104 | 0.384 |
| Wood product manufacturing | 0.041 | 0.081 |
| Paper manufacturing | 0.047 | 0.090 |
| Printing and related support activities | 0.104 | 0.230 |
| Petroleum and coal products manufacturing | 0.036 | 0.038 |
| Chemical manufacturing | 0.046 | 0.167 |
| Plastics and rubber products manufacturing | 0.052 | 0.081 |
| Non-metallic mineral product manufacturing | 0.054 | 0.071 |
| Primary metal manufacturing | 0.055 | 0.056 |
| Fabricated metal product manufacturing | 0.045 | 0.135 |
| Machinery manufacturing | 0.056 | 0.156 |
| Computer and electronic product manufacturing | 0.362 | 0.222 |
| Electrical equipment, appliance and component manufacturing | 0.047 | 0.259 |
| Transportation equipment manufacturing | 0.060 | 0.085 |
| Furniture and related product manufacturing | 0.071 | 0.262 |
| Miscellaneous manufacturing | 0.061 | 0.174 |
| Panel B - Service sectors | ||
| Wholesale trade | 0.226 | 0.268 |
| Retail trade | 0.191 | 0.331 |
| Air transportation | 0.077 | 0.112 |
| Rail transportation | 0.109 | 0.182 |
| Water transportation | 0.078 | 0.108 |
| Truck transportation | 0.078 | 0.111 |
| Pipeline transportation | 0.094 | 0.123 |
| Other transportation activities | 0.086 | 0.136 |
| Warehousing and storage, postal service, and courriers and messengers | 0.099 | 0.174 |
| Publishing industries, information services and data processing services | 0.568 | 0.593 |
| Motion picture and sound recording industries | 0.443 | 0.429 |
| Broadcasting (except Internet) and telecommunications | 0.575 | 0.580 |
| Finance and insurance | 0.106 | 0.402 |
| Real estate and rental and leasing | 0.120 | 0.092 |
| Architectural, legal, accounting, engineering and related services | 0.230 | 0.492 |
| Advertising, public relations and related services | 0.201 | 0.542 |
| Design, computer systems, management, technical, scientific and other professional services | 0.293 | 0.585 |
| Administrative and support services | 0.393 | 0.345 |
| Waste management and remediation services | 0.358 | 0.292 |
| Educational services | 0.348 | 0.495 |
| Health care and social assistance | 0.181 | 0.455 |
| Arts, entertainment and recreation | 0.241 | 0.303 |
| Accommodation and food services | 0.113 | 0.215 |
| Other services (except public administration) | 0.221 | 0.246 |
| Public administration | 0.177 | 0.239 |
|
Notes: Industries are abbreviated due to space limitations. Refer to Table A.1. for the full name and classification of abbreviated industries. ICT: Information and communications technology. Sources: Statistics Canada, table 36-10-0478-01, National Accounts Longitudinal Micordata File, authors' calculations. |
||
Appendix D – Intermediate inputs classification
| Product | Years | Category |
|---|---|---|
| Computer and related services | 2000 to 2008 | ICT services |
| Data processing, hosting and related services | 2009 to 2015 | ICT services |
| Computer systems design and related services (except software development) | 2009 to 2015 | ICT services |
| Computer equipment rental and leasing services | 2009 to 2015 | ICT services |
| Subscriptions for online content | 2010 to 2015 | ICT services |
| Subscriptions to Internet sites and contents | 2009 | ICT services |
| General purpose software | 2009 to 2015 | ICT services |
| Internet access services | 2009 | ICT services |
| Fixed Internet access services | 2010 to 2015 | ICT services |
| Other information services | 2009 to 2015 | ICT services |
| Movie, television program and video production, post-production and editing services | 2010 to 2015 | ICT servicesTable D.1 Note † |
| Fees for the distribution of television and radio program channels (affiliation payments) | 2010 to 2015 | ICT servicesTable D.1 Note † |
| Fixed telecommunications services (except Internet access) | 2010 to 2015 | ICT servicesTable D.1 Note † |
| Mobile telecommunications services | 2010 to 2015 | ICT servicesTable D.1 Note † |
| Cable, satellite and other program distribution services | 2009 to 2015 | ICT servicesTable D.1 Note † |
| Radio and television broadcasting, including cable | 2000 to 2008 | ICT servicesTable D.1 Note † |
| Telephone and other telecommunications services | 2000 to 2008 | ICT servicesTable D.1 Note † |
| Movies, television programs and videos | 2009 | ICT servicesTable D.1 Note † |
| Motion picture and video production and related services | 2009 | ICT servicesTable D.1 Note † |
| Fees for the distribution of television and radio program channels | 2009 | ICT servicesTable D.1 Note † |
| Wired telephone services | 2009 | ICT servicesTable D.1 Note † |
| Wireless telephone services | 2009 | ICT servicesTable D.1 Note † |
| Parts of computer and computer peripheral (except printed circuit assemblies) | 2009 to 2012 | ICT goods |
| Computers, computer peripheral equipment | 2009 to 2012 | ICT goods |
| Computers, computer peripherals and parts | 2013 to 2015 | ICT goods |
| Measuring, medical and controlling devices | 2009 to 2012 | ICT goods |
| Measuring, photo, medical and scientific instruments | 2000 to 2008 | ICT goods |
| Measuring, control and scientific instruments | 2013 to 2015 | ICT goods |
| Medical devices | 2013 to 2015 | ICT goods |
| Printed and integrated circuits, semiconductors and printed circuit assemblies | 2009 to 2015 | ICT goods |
| Electronic equipment components | 2000 to 2008 | ICT goods |
| Electronic alarm and signal systems | 2000 to 2008 | ICT goods |
| Other electronic components | 2009 to 2015 | ICT goods |
| Telephone apparatus | 2009 to 2015 | ICT goodsTable D.1 Note † |
| Communication and energy wire and cable | 2009 | ICT goodsTable D.1 Note † |
| Wiring devices | 2009 to 2015 | ICT goodsTable D.1 Note † |
| Telephone and related equipment, including fax machines | 2000 to 2008 | ICT goodsTable D.1 Note † |
| Broadcasting and radio communications equipment | 2000 to 2008 | ICT goodsTable D.1 Note † |
| Aluminum wire and cable | 2000 to 2008 | ICT goodsTable D.1 Note † |
| Wiring materials and electrical meters | 2000 to 2008 | ICT goodsTable D.1 Note † |
| Computers and office equipment, excluding photocopy and fax machines | 2000 to 2008 | ICT goodsTable D.1 Note † |
Source: Statistics Canada, authors' compilations. |
||
Appendix E – Use of intermediate ICT goods

Data table for Chart E.1
| Industry | 2000 to 2002 | 2013 to 2015 |
|---|---|---|
| Use intensity of intermediate ICT goods (number) | ||
| Panel A - Goods sectors | ||
| Agriculture, forestry, fishing and hunting | 0.007 | 0.001 |
| Oil and gas extraction | 0.024 | 0.032 |
| Mining and quarrying (except oil and gas) | 0.007 | 0.004 |
| Support activities for mining, and oil and gas extraction | 0.035 | 0.072 |
| Utilities | 0.006 | 0.008 |
| Construction | 0.018 | 0.048 |
| Food manufacturing | 0.002 | 0.000 |
| Beverage and tobacco product manufacturing | 0.004 | 0.002 |
| Textile mills and textile product mills | 0.003 | 0.001 |
| Clothing manufacturing, and leather and allied product manufacturing | 0.002 | 0.001 |
| Wood product manufacturing | 0.004 | 0.001 |
| Paper manufacturing | 0.010 | 0.000 |
| Printing and related support activities | 0.006 | 0.025 |
| Petroleum and coal products manufacturing | 0.000 | 0.000 |
| Chemical manufacturing | 0.004 | 0.000 |
| Plastics and rubber products manufacturing | 0.005 | 0.001 |
| Non-metallic mineral product manufacturing | 0.007 | 0.000 |
| Primary metal manufacturing | 0.003 | 0.000 |
| Fabricated metal product manufacturing | 0.005 | 0.003 |
| Machinery manufacturing | 0.023 | 0.049 |
| Computer and electronic product manufacturing | 0.437 | 0.399 |
| Electrical equipment, appliance and component manufacturing | 0.028 | 0.132 |
| Transportation equipment manufacturing | 0.002 | 0.012 |
| Furniture and related product manufacturing | 0.003 | 0.001 |
| Miscellaneous manufacturing | 0.061 | 0.011 |
| Panel B - Service sectors | ||
| Wholesale trade | 0.009 | 0.006 |
| Retail trade | 0.002 | 0.004 |
| Air transportation | 0.001 | 0.000 |
| Rail transportation | 0.000 | 0.000 |
| Water transportation | 0.002 | 0.004 |
| Truck transportation | 0.001 | 0.002 |
| Pipeline transportation | 0.016 | 0.018 |
| Other transportation activities | 0.016 | 0.008 |
| Warehousing and storage, postal service, and courriers and messengers | 0.014 | 0.004 |
| Publishing industries, information services and data processing services | 0.020 | 0.176 |
| Motion picture and sound recording industries | 0.050 | 0.053 |
| Broadcasting (except Internet) and telecommunications | 0.053 | 0.299 |
| Finance and insurance | 0.008 | 0.008 |
| Real estate and rental and leasing | 0.007 | 0.004 |
| Architectural, legal, accounting, engineering and related services | 0.082 | 0.067 |
| Advertising, public relations and related services | 0.027 | 0.004 |
| Design, computer systems, management, technical, scientific and other professional services | 0.061 | 0.108 |
| Administrative and support services | 0.038 | 0.032 |
| Waste management and remediation services | 0.023 | 0.023 |
| Educational services | 0.058 | 0.058 |
| Health care and social assistance | 0.231 | 0.099 |
| Arts, entertainment and recreation | 0.025 | 0.012 |
| Accommodation and food services | 0.001 | 0.001 |
| Other services (except public administration) | 0.019 | 0.010 |
| Public administration | 0.059 | 0.023 |
|
Notes: Industries are abbreviated due to space limitations. Refer to Table A.1. for the full name and classification of abbreviated industries. ICT: Information and communications technology. Sources: Statistics Canada, tables 36-10-0424-01 and 36-10-0478-01, authors' calculations. |
||
Appendix F – Digital occupation classification
| Digital occupations selected in this study | Included in | |||
|---|---|---|---|---|
| NOC code | OECD (Calvino et al. 2018) | McKinsey (Manyika et al. 2015) | Brookfield (Lamb and Seddon 2016) | |
| Telecommunication carriers managers | 131 | Yes | Yes | Yes |
| Engineering managers | 211 | No | No | Yes |
| Computer and information systems managers | 213 | Yes | Yes | Yes |
| Statistical officers and related research support | 1254 | No | No | No |
| Mechanical engineers | 2132 | No | No | Yes |
| Electrical and electronic engineers | 2133 | Yes | Yes | No |
| Industrial and manufacturing engineers | 2141 | No | No | No |
| Metallurgical and materials engineers | 2142 | No | No | Yes |
| Aerospace engineers | 2146 | No | No | Yes |
| Computer engineers | 2147 | Yes | Yes | Yes |
| Mathematicians, statisticians, actuaries | 2161 | No | No | Yes |
| Information systems analysts and consultants | 2171 | Yes | Yes | Yes |
| Database analysts and data administrators | 2172 | Yes | Yes | Yes |
| Software engineers and designers | 2173 | Yes | Yes | Yes |
| Computer programmers and interactive media developers | 2174 | Yes | Yes | Yes |
| Web designers and developers | 2175 | Yes | Yes | Yes |
| Industrial and manufacturing technologists | 2233 | No | No | No |
| Electrical and electronic technologists | 2241 | No | No | No |
| Technical occupations in geomatics and meteorology | 2255 | No | No | No |
| Computer network technicians | 2281 | Yes | Yes | No |
| User support technicians | 2282 | Yes | Yes | No |
| Information systems testing technicians | 2283 | Yes | Yes | No |
| Graphic art technicians | 5223 | No | No | Yes |
| Graphic designers and illustrators | 5241 | No | No | Yes |
| Supervisors, electronics manufacturing | 9222 | No | No | No |
|
Notes: NOC: National Occupational Classification; OECD: Organisation for Economic Co-operation and Development. Sources: Calvino et al. 2018, Manyika et al. 2015, Lamb and Seddon 2016, authors' compilations. |
||||
Appendix G – E-commerce
Although not directly involved in the production process, electronic commerce (or e-commerce) is still a major manifestation of digital technology adoption. It can connect businesses with potential customers without impediment from time and space. Real-time e-commerce activities allow businesses to respond quickly to changes in demand by updating their production plans and, as a result, indirectly affecting the production process.
Data on e-commerce activities come from a variety of surveys conducted by Statistics Canada through the Integrated Business Statistics Program. These surveys cover only a subset of Canadian sectors, namely logging and agriculture, manufacturing, and retail and wholesale trade, as well as some services sectors. In addition, the surveys exclude firms with no brick-and-mortar presence in Canada, as well as online sales made through any third party with no physical presence. Because of data limitations and confidentiality requirements, the e-commerce metric is currently available only for the year 2016, and the industries are ranked and grouped by quartile of e-commerce intensity.Note As such, this metric can be used only for cross-sectional analyses and was not used to construct the final composite index.
The e-commerce metric was constructed as
Where is the e-commerce metric, is the nominal value of sales made online, is the nominal value of overall sales, all for industry in 2016.Note The deflation was performed implicitly under the assumption that the products sold online share a common price component with overall sales.
The results for the e-commerce intensity show that the agricultural and forestry industry (approximated by the logging industry), as well as most manufacturing industries, remained at the bottom of the digital distribution (Chart G.1). The information and data services, electrical and electronic product manufacturing, and food and beverage manufacturing industries ranked the highest. This is generally consistent with the findings in Calvino, Criscuolo, Marcolin and Squicciarini (2018), which suggests that these industries have embraced this dimension of digitalization. One notable difference is that the transportation equipment manufacturing industry had a very high online sales intensity in Calvino, Criscuolo, Marcolin and Squicciarini, but ranked in the second-lowest quartile in the present study.
The arts, entertainment and recreation industry ranked in the first quartile, as expected, since online ticket sales make up a significant proportion of this industry’s revenues. One notable surprise comes from the professional services industries, which ranked in the bottom half of the distribution. This seems to indicate that advertising, legal, engineering and many other professional services are still delivered in a non-digital form or that payment is still made in a non-digital form, even if the services are delivered digitally. The retail trade sector also ranked relatively low in e-commerce intensity. Overall, e-commerce accounted for only about 2.3% of total sales in the retail trade sector in 2016 (Statistics Canada n.d.d). However, online sales accounted for 42.7% of total sales by non-store retailers—the latter accounting for almost 66% of all online sales in the retail trade sector. This paints a two-sided story for the retail trade sector, as e-commerce has been important for non-store retailers, but non-digital sales still dominate among traditional retailers.

Data table for Chart G.1
| Industry | Quartile | Missing |
|---|---|---|
| Agriculture, forestry, fishing and hunting | 1 | 0 |
| Oil and gas extraction | 0 | 1 |
| Mining and quarrying (except oil and gas) | 0 | 1 |
| Support activities for mining, and oil and gas extraction | 0 | 1 |
| Utilities | 0 | 1 |
| Construction | 0 | 1 |
| Food manufacturing | 4 | 0 |
| Beverage and tobacco product manufacturing | 4 | 0 |
| Textile mills and textile product mills | 2 | 0 |
| Clothing manufacturing, and leather and allied product manufacturing | 3 | 0 |
| Wood product manufacturing | 1 | 0 |
| Paper manufacturing | 1 | 0 |
| Printing and related support activities | 3 | 0 |
| Petroleum and coal products manufacturing | 0 | 1 |
| Chemical manufacturing | 2 | 0 |
| Plastics and rubber products manufacturing | 1 | 0 |
| Non-metallic mineral product manufacturing | 1 | 0 |
| Primary metal manufacturing | 1 | 0 |
| Fabricated metal product manufacturing | 2 | 0 |
| Machinery manufacturing | 3 | 0 |
| Computer and electronic product manufacturing | 3 | 0 |
| Electrical equipment, appliance and component manufacturing | 4 | 0 |
| Transportation equipment manufacturing | 2 | 0 |
| Furniture and related product manufacturing | 3 | 0 |
| Miscellaneous manufacturing | 2 | 0 |
| Wholesale trade | 3 | 0 |
| Retail trade | 2 | 0 |
| Air transportation | 0 | 1 |
| Rail transportation | 0 | 1 |
| Water transportation | 0 | 1 |
| Truck transportation | 0 | 1 |
| Pipeline transportation | 0 | 1 |
| Other transportation activities | 0 | 1 |
| Warehousing and storage, postal service, and courriers and messengers | 0 | 1 |
| Publishing industries, information services and data processing services | 4 | 0 |
| Motion picture and sound recording industries | 4 | 0 |
| Broadcasting (except Internet) and telecommunications | 0 | 1 |
| Finance and insurance | 0 | 1 |
| Real estate and rental and leasing | 2 | 0 |
| Architectural, legal, accounting, engineering and related services | 1 | 0 |
| Advertising, public relations and related services | 2 | 0 |
| Design, computer systems, management, technical, scientific and other professional services | 0 | 1 |
| Administrative and support services | 4 | 0 |
| Waste management and remediation services | 0 | 1 |
| Educational services | 0 | 1 |
| Health care and social assistance | 0 | 1 |
| Arts, entertainment and recreation | 4 | 0 |
| Accommodation and food services | 3 | 0 |
| Other services (except public administration) | 1 | 0 |
| Public administration | 0 | 1 |
|
Notes: Quartiles 1 to 4 represent the 4 quartiles of e-commerce intensity across industries, with 1 being the lowest and 4 the highest. Quartile 0 or missing =1 refer to those industries with missing information on e-commerce. NAICS: North Americian Industry Classification System. Sources: Statistics Canada, Integrated Business Survey Program (IBSP), authors' calculations. |
||
Appendix H – Weight construction using principal component analysis
This appendix describes detailed steps for implementing a principal component analysis (PCA) to derive the weights used to construct the composite index.
Before a PCA is implemented, a significant correlation among the underlying data is required. Otherwise, it is unlikely that they would share common components. Table H.1 reports the correlation among the selected individual metrics. The results show that almost all of the metrics selected were positively and statistically significantly correlated with each other. ICT capital was positively correlated with the use of intermediate ICT services, which reflects a possible complementarity between both forms of input. The digital workforce metric shows a positive and significant correlation with all of the other metrics, underscoring the complementarity between digital skills and other inputs. Lastly, robot adoption does not seem to be significantly correlated with the other metrics, except for digital workforce.Note This might be because robot adoption is concentrated in manufacturing industries, where ICT capital and service intensities are relatively low.
Overall, these correlations further motivate the need to adopt a multidimensional approach to measure digital intensity and justify the use of PCA in aggregation.
| ICT capital | Intermediate ICT services (no telecommunications) | Digital workforce | Robot adoption | |
|---|---|---|---|---|
| number | ||||
| Information and communications technology capital | 1 | Note ...: not applicable | Note ...: not applicable | Note ...: not applicable |
| Intermediate information and communications technology services (no telecommications) | 0.394Table H.1 Note † |
1 | Note ...: not applicable | Note ...: not applicable |
| Digital workforce | 0.315Table H.1 Note † |
0.387Table H.1 Note † |
1 | Note ...: not applicable |
| Robot adoption | 0.081 | -0.103 | 0.327Table H.1 Note † |
1 |
... not applicable
Source: Statistics Canada, authors' calculations. |
||||
All individual metrics need to be standardized before implementing a PCA to ensure they are on a comparable scale. As such, each individual metric is standardized by subtracting its mean across industries and by year and dividing it by its standard deviation across industries and by year—a process commonly known as z-scoring.
Several steps are then followed to compute the weights required for the final composite index. First, the relevant principal components are selected based on their contributions to the overall variance. As recommended by Nicoletti et al. (2000), the components selected should have eigenvalues greater than 1, an individual contribution to total variance of more than 10% and a cumulative contribution of more than 60%.
Second, for each principal component selected, the PCA calculates a set of coefficients (loadings) that associate it with the underlying metrics. These loadings measure the correlations between the individual metrics and the latent principal component. The weight for each individual metric is then calculated based on the proportion of its variance that can be explained by the associated principal component (i.e., squared loadings divided by the sum of squared loadings).
Third, if more than one principal component is selected, each principal component is weighted based on its contribution to total variance.
These steps are illustrated in Table H.2 and Table H.3. Two principal components were selected based on their eigenvalues being greater than 1. In addition, their cumulative contribution to total variance in the data amounted to over 80%.
| Principal component 1 | Principal component 2 | |
|---|---|---|
| number | ||
| Eigenvalue | 2.11 | 1.11 |
| percent | ||
| Contribution to total variance | 52.72 | 27.70 |
|
Note: ICT: Information and communications technology. Source: Statistics Canada, authors' calculations. |
||
| Principal component 1 | Principal component 2 | |||
|---|---|---|---|---|
| Factor loadings (Column A) | Weights of individual indictors (Column B) | Factor loadings (Column C) | Weights of individual indictors (Column D) | |
| numbers | ||||
| ICT services (no telecommunications) | 0.83 | 0.33 | -0.17 | 0.03 |
| Digital labour | 0.85 | 0.34 | 0.33 | 0.10 |
| ICT capital | 0.83 | 0.33 | -0.11 | 0.01 |
| Robots | -0.04 | 0.00 | 0.98 | 0.86 |
| Sum | Note ...: not applicable | 1.00 | Note ...: not applicable | 1.00 |
| Weight of selected principal components in final index | Note ...: not applicable | 0.66 | Note ...: not applicable | 0.34 |
|
... not applicable Note: ICT: Information and communications technology. Source: Statistics Canada, authors' calculations. |
||||
References
Acemoglu, D., and P. Restrepo. 2019. “Automation and new tasks: How technology displaces and reinstates labor.” Journal of Economic Perspectives 33 (2): 3–30.
Acemoglu, D., and P. Restrepo. 2020. “Robots and jobs: Evidence from US labor markets.” Journal of Political Economy 128 (6): 2188–2244.
Acemoglu, D., C. Lelarge, and P. Restrepo. 2020. “Competing with robots: Firm-level evidence from France.” American Economic Review Papers and Proceedings 110: 383–388.
Aghion, P., G.-M. Angeletos, A. Banerjee, and K. Manova. 2005. Volatility and Growth: Credit Constraints and Productivity-Enhancing Investment. NBER Working Paper Series, no. 11349. Cambridge, Massachusetts: National Bureau of Economic Research.
Agopsowicz, A., D. Brouillette, J. McDonald-Guimond, B. Gueye, J. Mollins, and Y. Park. 2018. Potential Output in Canada: 2018 Reassessment. Bank of Canada Staff Analytical Note 2018-10.
Andrews, D., G.Nicoletti and C. Timiliotis, 2018. Going digital: What determines technology diffusion among firms? OECD Economics Department Working Papers No. 1466, OECD.
Barefoot, K., D. Curtis, W. Jolliff, J.R. Nicholson, and R. Omohundro. 2018. Defining and Measuring the Digital Economy. BEA Working Paper.
Bloomberg, J. 2018. “Digitization, digitalization and digital transformation: Confuse them at your peril.” Forbes, April 29.
Brynjolfsson, E., and A. McAfee. 2018. The Business of Artificial Intelligence. Harvard Business Review, Available at https://hbr.org/2017/07/the-business-of-artificial-intelligence.
Byrne, D., and C. Corrado. 2017. ICT Asset Prices: Marshaling Evidence into New Measures. FEDS Working Paper, no. 2017-016.
Calvino, F. and C. Criscuolo.2019. Business dynamics and digitalization, OECD Science, Technology and Innovation policy papers, No. 62, OECD.
Calvino, F., C. Criscuolo, L. Marcolin, and M. Squicciarini. 2018. A Taxonomy of Digital Intensive Sectors. OECD Science, Technology and Industry Working Papers.
Cardona, M., T. Kretschmer, and T. Strobel. 2013. “ICT and productivity: Conclusions from the empirical literature.” Information Economics and Policy 25 (3): 109–125.
Carlsson, B. 2004. “The digital economy: What is new and what is not?” Structural Change and Economic Dynamics 15 (3): 245-264.
Dixon, J. 2020. How to Build a Robots! Database. Analytical Studies Branch Methods and References Series, no. 454. Statistics Canada Catalogue no. 11-633-X. Ottawa: Statistics Canada.
Dixon, J., B. Hong, and L. Wu. 2020. The Employment Consequences of Robots: Firm-level Evidence. Analytical Studies Branch Research Paper Series, no 454. Statistics Canada Catalogue no. 11F0019M. Ottawa: Statistics Canada.
Gal, P., G. Nicoletti, T. Renault, S. Sorbe, and C. Timiliotis. 2019, Digitalisation and productivity: In search of the holy grail – Firm-level empirical evidence from EU countries,OECD Economics Department Working Papers, No. 1533, OECD Publishing, Paris.
Hardill, I., and A. Green. 2003. “Remote working—altering the spatial contours of work and home in the new economy.” New Technology, Work and Employment 18 (3): 212–222.
International Federation of Robotics (IFR) Statistical Department. 2017. World robotics: Industrial robots 2016.
James, G., D. Witten, T. Hastie, and R. Tibshirani. 2014. An Introduction to Statistical Learning: with Applications in R. Springer.
Jorgenson, D.W., M.S. Ho, and K.J. Stiroh. 2005. “Information technology and the American growth resurgence.” Productivity, Volume 3.
Jovanovic, B., and P.L. Rousseau. 2005. “General purpose technologies.” In Handbook of Economic Growth 1: 1181–1224. Elsevier.
Lamb, C., and M. Seddon. 2016. The State of Canada’s Tech Sector. The Brookfield Institute for Innovation and Entrepreneurship.
Manyika, J., S. Ramaswamy, S. Khanna, H. Sarrazin, G. Pinkus, G. Sethupathy, and A. Yaffe. 2015. Digital America: A Tale of the Haves and Have-Mores. McKinsey Global Institute.
Nedelkoska, L., and G. Quintini. 2018. “Automation, skills use and training.” OECD Social, Employment and Migration Working Papers, no. 202.
Nicoletti, G., S. Scarpetta and O.Boylaud, 2000, Summary indicators of product market regulation with an extension to employment protection legislation, Economics Department Working Papers No. 226, OECD.
OECD. 2008. Handbook on Constucting Composite Indicators. OECD.
OECD 2014. Measuring the Digital Economy: A New Perspective, OECD Publishing. http://dx.doi.org/10.1787/9789264221796-en.
Oschinski, M., and R. Wyonch. 2017. “Future Shock? The Impact of Automation on Canada's Labour Market.” C.D. Howe Institute Commentary, no. 472.
Schwellnus, C., A. Geva, M. Pak, and R. Veiel. 2019. “Gig economy platforms: Boon or bane?” OECD Economics Department Working Papers, no. 1550.
Spiezia, V. 2017. Jobs and skills in the digital economy. OECD Observer. www.oecdobserver.org
Statistics Canada 2019a, Canadian internet use survey, The Daily, release; 2019-10-29.
Statistics Canada. 2019b. Measuring Digital Economic Activities in Canada: Initial Estimates. Latest Developments in the Canadian Economic Accounts. Statistics Canada Catalogue no. 13-605-X. Ottawa: Statistics Canada.
Statistics Canada. n.d.a. Table 22-10-0013-01 Internet use by industry and size of enterprise, inactive.
Statistics Canada. n.d.b. Table 36-10-0097-01 Flows and stocks of fixed non-residential capital, by industry and type of asset.
Statistics Canada. n.d.c. Table 36-10-0424-01 Inputs and outputs, by industry and commodity, L-level aggregation and North American Industry Classification System (NAICS).
Statistics Canada. n.d.d. Table 36-10-0478-01 Supply and use tables, detail level, provincial and territorial (x 1,000).
Statistics Canada. n.d.e. Table 20-10-0065-01 Retail trade, total sales and e-commerce sales.
Thompson, N., and S. Spanuth. 2019. “The decline of computers as a general purpose technology: Why deep learning and the end of Moore’s Law are fragmenting computing. MIT Initiative on the Digital Economy Research Brief, Vol. 1.
van Ark, B. 2016. “The productivity paradox of the new digital economy.” International Productivity Monitor 31 (3).
Whelan, K. 2002. A guide to US chain aggregated NIPA data, Review of Income and Wealth, 48 (2), 217-233.
- Date modified: