
Economic and Social Reports
Economic performance associated with digitalization in Canada over the past two decades
by Huju Liu
DOI: https://doi.org/10.25318/36280001202100200001-eng
Abstract
Using an innovative index that measures the extent to which digital technologies have been adopted in Canadian industries, this article compares the labour productivity performance of industries where digital inputs have been used more intensively in the production process (digitally intensive sector) to that of remaining industries (non-digitally intensive sector) over the past two decades. It also examines the gross domestic product (GDP) and employment growth of these sectors in 2020 during the COVID-19 pandemic. From 2002 to 2019, labour productivity grew 22.1% in the digitally intensive sector, more than 3 times higher than that in the non-digitally intensive sector. The digitally intensive sector also felt a much smaller negative impact from the COVID-19 pandemic than the non-digitally intensive sector.
Author
Huju Liu is with the Economic Analysis Division, Analytical Studies Branch, at Statistics Canada.
Introduction
While Canada has embraced digital technologies rapidly and broadly over the past two decades, there is no doubt that the adoption of digital technologies has been amplified and accelerated as a result of the COVID-19 crisis. A massive number of people have transitioned to remote work. Consumers have had to turn to online platforms to purchase merchandise. Business have had to use online platforms to sell their products and services and serve their customers facing mobility constraints. Wide digital adoption has leaped forward several years in a matter of weeks during the COVID-19 crisis (Baig et al. 2020), and these changes are likely here to stay even after the pandemic (UNCTAD 2020; Bloom 2020).
This article compares the economic performance of sectors where digital inputs have been used more intensively in the production process (digitally intensive sectors) to that of remaining sectors (non-digitally intensive sectors). Measuring digital intensity is challenging because digitalization is a complex process and multifaceted phenomenon. It can include, but not be limited to, the e-commerce between businesses and consumers, the automation of tasks by robots, and the use of big data and artificial intelligence technologies.
This article uses an innovative composite index of digital intensity developed by Liu and McDonald-Guimond (2021) to characterize digital adoption at the industry level. To compute a composite index of digital intensity that captures the multidimensional nature of digitalization, Liu and McDonald-Guimond (2021) first construct industry-level metrics of the use of information and communications technology (ICT) capital, the use of intermediate ICT goods and services, the size of the digital workforce, and robot adoption. These metrics are then aggregated into a single composite index based on weights derived from a principal component analysis (PCA).
An industry is considered to be digitally intensive if its index is consistently high compared to other industries, that is, consistently in the upper quartiles.Note The digitally intensive sector includes utilities; plastics and rubber products; primary metal; machinery; computer and electronic products; transportation equipment manufacturing; pipeline transportation; publishing and data processing; broadcasting and telecommunications; professional, scientific and technical services; and finance and insurance. The non-digitally intensive sector comprises the remaining industries.
Economic performance associated with digitalization
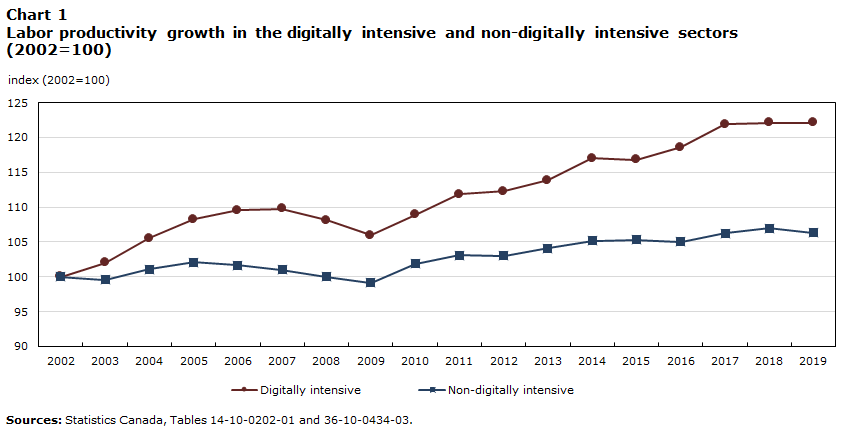
The digitally intensive sector experienced higher growth in labour productivity over the past two decades than the non-digitally intensive sector (Chart 1).Note From 2002 to 2019, labour productivity grew 22.1% cumulatively in the digitally intensive sector, compared to 6.3% in the non-digitally intensive sector. During the first decade up to 2009, labour productivity grew modestly in the digitally intensive sector, by about 6%, while it basically remained flat in the non-digitally intensive sector. While labour productivity had a larger decline due to the 2008 crisis in the digitally intensive sector, the rebound afterward was also stronger in the same sector. Since 2009, labour productivity growth accelerated in the digitally intensive sector, with an annual growth rate of 1.4% compared to 0.7% in the non-digitally intensive sector.
Data table for Chart 1
| Digitally intensive | Non-digitally intensive | |
|---|---|---|
| index (2002=100) | ||
| 2002 | 100.000 | 100.000 |
| 2003 | 101.978 | 99.563 |
| 2004 | 105.508 | 101.100 |
| 2005 | 108.265 | 102.114 |
| 2006 | 109.552 | 101.620 |
| 2007 | 109.749 | 101.018 |
| 2008 | 108.079 | 100.010 |
| 2009 | 105.929 | 99.136 |
| 2010 | 108.938 | 101.880 |
| 2011 | 111.871 | 103.068 |
| 2012 | 112.249 | 102.984 |
| 2013 | 113.856 | 104.100 |
| 2014 | 117.007 | 105.194 |
| 2015 | 116.798 | 105.328 |
| 2016 | 118.615 | 105.059 |
| 2017 | 121.868 | 106.219 |
| 2018 | 122.099 | 106.997 |
| 2019 | 122.123 | 106.299 |
| Sources: Statistics Canada, Tables 14-10-0202-01 and 36-10-0434-03. | ||
Data table for Chart 2
| Month in 2020 | Employment (digitally intensive) | Employment (non-digitally intensive) | Gross domestic product (digitally intensive) | Gross domestic product (non-digitally intensive) |
|---|---|---|---|---|
| percent | ||||
| January | 3.52 | 0.66 | 2.21 | 1.84 |
| February | 3.02 | 1.48 | 2.64 | 2.54 |
| March | -1.08 | -12.90 | -3.58 | -5.91 |
| April | -11.25 | -30.18 | -11.76 | -18.14 |
| May | -9.73 | -25.61 | -10.26 | -13.82 |
| June | -5.17 | -16.87 | -4.26 | -9.26 |
| July | -2.19 | -11.88 | -1.61 | -7.20 |
| August | -1.49 | -9.55 | -0.76 | -6.47 |
| September | 1.13 | -7.82 | -0.93 | -5.35 |
| Sources: Statistics Canada, Labour Force Survey and Table 36-10-0434-01. | ||||
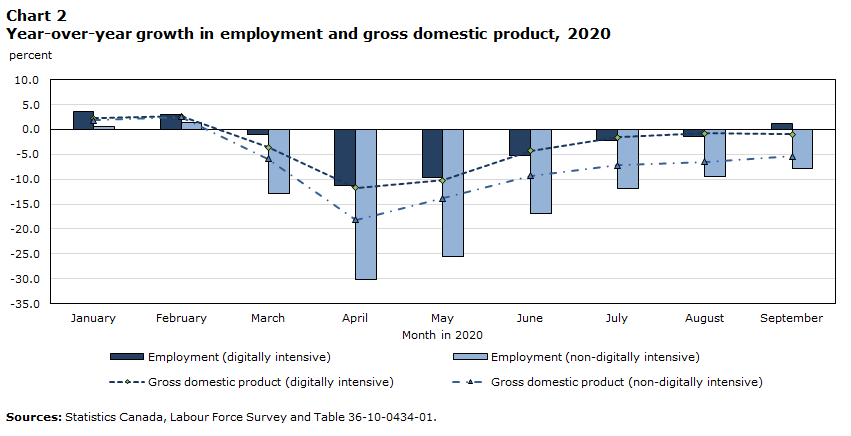
The digitally intensive sector has also been more resilient during the COVID-19 crisis than the non-digitally intensive sector (Chart 2). While the COVID-19 pandemic has had negative impacts on both sectors, the impact on the non-digitally intensive sector has been more severe than that on the digitally intensive sector. For the months of March to May 2020, employment declined on a year-over-year basis by 12.9%, 30.2% and 25.6%, respectively, in the non-digitally intensive sector, compared to 1.1%, 11.3% and 9.7%, respectively, for the digitally intensive sector. Similar patterns have been found for the gross domestic product (GDP) growth. GDP declined on a year-over-year basis by 18.1% and 13.8% in April and May, respectively, in the non-digitally intensive sector, compared to 11.8% and 10.3% in the digitally intensive sector. Both sectors have rebounded since June 2020. By September, employment in the digitally intensive sector returned to its 2019 level while the GDP was only slightly lower. However, the employment in the non-digitally intensive sector was still 7.8% below its level of the same month in 2019 and GDP was 5.3% lower.
Conclusion
Over the past two decades, digitalization in Canada appears to have benefited Canadian industries. While the evidence may not suggest a causal relationship, it does suggest digitalization is associated with a higher labour productivity growth. During the COVID-19 pandemic, the industries that have adopted digitalization more intensively experienced a much smaller negative impact and were more resilient, which likely is a result of the flexibility and adaptability brought by digitalization (e.g., digital infrastructure or platforms already in place, higher telework capacity [Deng, Morissette and Messacar 2020]).
The COVID-19 crisis is likely to have a long-lasting effect on the way we work and do business, and digitalization is likely to become even more important during the recovery and for future growth. It is important to ensure a wider and more even adoption and diffusion of digital technologies among businesses by improving managerial quality, workers’ ICT skills and the quality of worker-to-job matches (Andrews et al. 2018).
References
Andrews, D., G. Nicoletti, and C. Timiliotis. 2018. Going digital: What determines technology diffusion among firms? OECD Economics Department Working Papers, no. 1466. OECD.
Baig, A., B. Hall, P. Jenkins, E. Lamarre, and B. McCarthy. 2020. The Covid-19 recovery will be digital: A plan for the first 90 days.
Bloom, N. 2020. How working from home works out.
Deng, Z., R. Morissette, and D. Messacar. 2020. Running the economy remotely: Potential for working from home during and after COVID-19. Statistics Canada COVID-19: Data to Insights for a better Canada, Statistics Canada.
Liu, H., and J. McDonald-Guimond. 2021. “Measuring digital intensity in the Canadian Economy.” Economic and Social Reports 2 (3). Statistics Canada.
United Nations Conference on Trade and Development (UNCTAD). 2020. COVID-19 has changed online shopping forever, survey shows.
Statistics Canada. n.d.a. Table 14-10-0202-01 Employment by industry, annual.
Statistics Canada. n.d.b. Table 36-10-0434-03 Gross domestic product (GDP) at basic prices, by industry, annual average (x 1,000,000).
Statistics Canada. n.d.c. Table 36-10-0434-01 Gross domestic product (GDP) at basic prices, by industry, monthly (x 1,000,000).
- Date modified: