


|
|
| |
Archived ContentInformation identified as archived is provided for reference, research or recordkeeping purposes. It is not subject to the Government of Canada Web Standards and has not been altered or updated since it was archived. Please "contact us" to request a format other than those available. 31F0027MIE95001
INTRODUCTION During the past decade, the Canadian manufacturing sector has had to overcome major challenges, including globalization, in order to stay competitive on both the Canadian and international markets. How have industries adapted in order to meet these challenges? Competitiveness depends on increased productivity, and this can only be achieved by rationalizing production costs. We will attempt to explain how and to what extent the manufacturing sector has rationalized its production costs. For this purpose we will examine expenditures on the four main inputs - wages, salaries, energy and raw materials - as they have evolved over time. In Section I, we will first look at the evolution of total expenditures on production costs for the sector as a whole and by major industry group. In Section II, we look at the situation of wage and salary expenditures for the industry sector as a whole, by size of establishment and by major group. In Section III we analyse the composition of expenditures on energy and raw materials and how it has changed over time for the entire sector, by type of processing and by industry group. Lastly, in Section IV we summarize the situation and present conclusions.
I OVERALL EVOLUTION OF PRODUCTION COSTS Since 1983, the manufacturing sector had seen its GDP, in constant dollars, increase until 1989 and then fall back during the period 1990-1991; it was not until 1994 that the level of production exceeded the 1989 level, and the upward trend was maintained for 1995 (see Chart 1. Evolution of Gross Output and Production Costs in Constant Dollars (1986=100)). Investments also reached their highest levels in 1989, declined to their lowest levels in 1992 and have been rising since 1993. Furthermore it was in 1991 that the industrial capacity utilization rate reached its lowest level since 1984; it is only since 1994 that it has exceeded the 1989 level. Thus, between 1989 and 1994, the Canadian manufacturing sector faced a difficult economic situation, and as Chart 1. Evolution of Gross Output and Production Costs in Constant Dollars (1986=100) shows, industries adjusted their production costs accordingly. However, during this period, the manufacturing sector as a whole also made adjustments in order to rationalize its costs. Production costs accounted for 80.1% of gross output in 1985, 78.3% in 1989 and only 75.7% in 1995 for the manufacturing sector as a whole, representing a decrease of more than 5% between 1985 and 1995. Production costs are made up of expenditures on wages, salaries, fuel and electricity as well as raw materials. In general, Canadian manufacturing establishments permanently cut their costs as a proportion of gross output between 1985 and 1995, and this process should continue if industries are to remain competitive. By major industry group Because they face different pressures, industry groups have rationalized their production costs to different degrees and in different ways. Table 1. Production costs as a percentage of gross output, 1985 and 1995. shows production costs (expenditures on wages, salaries, electricity and fuel and raw materials) as a percentage of gross output for 1985 and 1995. For example, in 1995, in the Tobacco Products Industries, it cost $0.44 to produce $1 of tobacco product, and for the Refined Petroleum and Coal Products Industries, it cost $0.88 for $1 of output. It is immediately apparent that the differences between the different industry groups are sizable, with costs as a percentage of the value of gross output varying between 44.1% and 88.1% in 1995 and between 62.8% and 92.1% in 1985. Clearly, then, the disparities between the different industries have increased considerably over time. Some major groups have cut costs as a proportion of output, while others have seen their costs increase in relation to output.
II WAGE AND SALARY COMPONENTS Wages refer to gross earnings of production employees and salaries refer to gross earnings of administrative employees and all non-production employees. Wage and salary expenditures as a proportion of output were reduced for the manufacturing sector as a whole between 1985 and 1995. Wage costs as a percentage of output fell from 12.5% in 1985 to 11.0% in 1995. Salary costs also declined over this period, from 6.1% to 5.2% of gross output. This labour productivity improvement seems to be associated with restructuring and an increase in automation. During the period from 1990 to 1993, gross output per employee increased and wage expenditures per employee also rose, despite the drop in output and a reduction of the labour force. This increase in labour productivity and wage expenditures can be explained, in part, by the laying off of "non-qualified" labour during the recession. Establishments tend to keep their "qualified" labour force since it is really difficult to hire. Robillard (1995) notes that even during recession period, the shortage of "qualified" labour exists but shortages of "non-specialized" workers are almost non-existent. For the subsequent period, 1994-1995, there was an increase in employment, and despite this, the gross output per employee still increased. However, a decrease in wage expenditures per employee is observed, probably because of high unemployment rates. Baldwin (1996) also argues that new jobs have been paying increasingly lower wages. By size of establishment It is useful to look at the situation with respect to the manufacturing sector as a whole by size of establishment, since it appears that firms of different sizes have not adjusted in the same way or at the same rate. Establishments may be divided into four groups, on the basis of the volume of their manufacturing shipments:
As shown in Chart 2. Wage and Salary Expenditures in Percentage of Gross Output by Size of Establishment 1984 and 1994, there are major differences between the four groups of establishments. Those with shipments under $1 million devoted 38.7% of the value of their output to wage and salary expenditures in 1994, whereas those with shipments in excess of $25 million spent only 10.6% of the value of their gross output on wages and salaries that year. As may be seen, the gap between small and large establishments widened between 1984 and 1994. The wage component increased for the two groups with the smallest volumes, while it decreased for the group with shipments of $25 million and over. Expenditures on raw materials and energy as a proportion of gross output are similar for establishments of different sizes, but there are major variations in wage costs. As a result, production costs represented 90.1% of the value of gross output for small establishments, as compared to 61.9% for very large establishments in 1994. Yet in 1984, 81.1% of the value of gross output was spent on costs for small establishments, and 79.4% for large establishments. Small establishments did not maintain their relative labour productivity thus the gap between small and very large firms is widening. Baldwin (1996) gives two main explanations for this phenomenon:
By major industry group
As Table 2. Wage and salary costs as a proportion of gross output, and change between 1985 and 1995, by major group shows, apart from Plastic Products, Fabricated Metal Products, Food, Textile Products and Refined Petroleum and Coal Products, all industries reduced their wage expenditures as a percentage of gross output.
For all major groups taken together, output per employee increased more than wage expenditures were reduced. This situation may be explained by the substitution of a large number of unskilled workers by a small number of skilled workers, the use of more advanced equipment and an increase in subcontracting.
A comparison of non-production salary expenditures with production wage expenditures reveals several points worth noting.
III ENERGY AND RAW MATERIAL COMPONENTS As with wage and salary costs, the costs of energy and raw materials as a percentage of gross output declined between 1985 and 1995 for the Canadian manufacturing sector as a whole. Energy expenditures fell from 3.0% to 2.4% of gross output, while expenditures on raw materials declined from 58.5% to 57.1% of output. Energy expenditures: fuel and electricity Energy expenditures bottomed out at 2.5% of gross output in 1988, rose slightly in 1989 and then rose more sharply until 1991 (reaching 2.9% of gross output). Part of this increase may be explained by a decrease in the volume of production, and hence a decrease in returns to scale. In 1994, when production returned to a level greater than in 1989, energy expenditures as a percentage of gross output were still above the 1988 level. However, it cannot automatically be concluded that energy consumption increased between 1988 and 1994. A combination of several phenomena, each acting in different directions, is responsible for this ultimate effect.
Hence there is little evidence that energy consumption increased between 1988 and 1994. As may be seen, between 1985 and 1995, energy expenditures as a percentage of output fell by more than 20%. While prices explain part of this decrease, it seems clear that the manufacturing sector as a whole rationalized its energy costs. Of course, some industry groups were subject to specific circumstances that affected their energy consumption over the period. Overall, when the industries are grouped by type of goods processing, major differences in energy expenditures are observed.
It is useful at the outset to briefly define the three types of goods processing that exist within the manufacturing sector: production of primary goods, production of secondary goods, and production of finished goods.
We organized the manufacturing industries according to this classification of goods produced. Chart 3. Fuel and Electricity Expenditures in Percentage of Gross Output by Type of Transformation - 1985 and 1995 shows energy expenditures as a percentage of gross output for the three classes of industries. As may be seen, it is the industries producing primary goods that have the highest energy costs, representing just over 4% of gross output in 1995. Industries producing finished goods spend the lowest percentage of the value of output on energy, at less than 1%. As a comparison with the 1985 consumption levels shows, this relationship has held over time. In order to reach conclusions about energy consumption, it would be essential to know in what proportions the different types of energy are used. But we would nevertheless argue that it makes sense that industries producing primary goods, which require major processing, would spend more on energy. For a more detailed picture, we can observe the level of energy expenditures by major industry group.
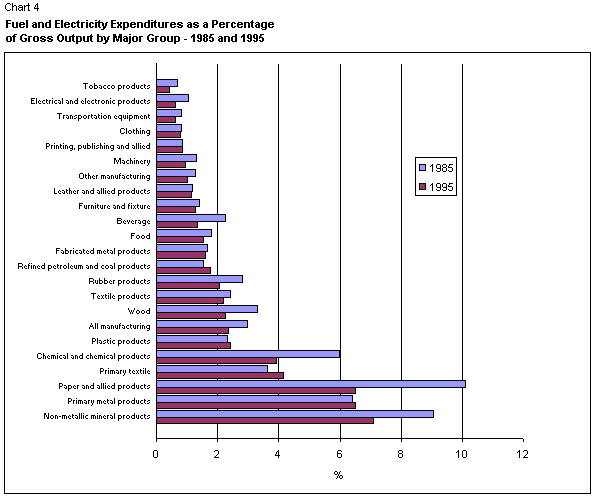
Chart 4. Fuel and Electricity Expenditures in Percentage of Gross Output by Major Group - 1985 and 1995 shows expenditures as a percentage of gross output for 1985 and 1995, organized by industry in descending order of expenditures in 1995. The figure serves to identify the industry groups that spend the most on energy in their production as well as the change in energy costs between 1985 and 1995.
Expenditures on raw materials As in the case of energy, expenditures on raw materials as a percentage of gross output also bottomed out in 1988, reaching 55.8%; they have not returned to that level since. The percentage gradually rose to 57.3% in 1993, then fell slightly during the period 1994-1995. Again as in the case of energy, the price levels of the different raw materials may have had a significant impact on expenditure levels.
IV CONCLUSION On the whole, the manufacturing sector appears to have rationalized its production costs during the past decade. Expenditures on the four main inputs in relation to gross output fell for the entire sector. More specifically, energy expenditures as a percentage of gross output fell by more than 20%, while non-production salary and production wage expenditures declined by 13.7% and 11.7% respectively. Within the sector, some industry groups rationalized their production costs more extensively. The following industry groups sharply cut back their expenditures on production costs between 1985 and 1995.
However, it is important to qualify the above findings, in that some of these changes in production costs could be explained in part by the price levels of inputs and output. In particular, prices in the Paper and Allied Products industries increased between 1993 and 1995, and to a lesser extent prices in the Chemical and Chemical Products and Tobacco Products industries also increased in relation to prices in other industries during this period. But subject to the above qualification, we conclude that the Paper and Allied Products, Chemical and Chemical Products, Tobacco Products and Electrical and Electronic Products industries appear to have greatly rationalized their production costs between 1985 and 1995. This rationalization of production costs tells us that major structural changes occurred in the manufacturing sector between 1985 and 1995. And some of these changes are necessary conditions for productivity growth and the increased competitiveness. Sources Baldwin, John "Job creation, wages and productivity in manufacturing." Canadian Economic Observer (Statistics Canada, Catalogue 11-010-XPB) (November 1996):3.1-3.16. Robillard, Claude "Hiring difficulties in manufacturing." Perspectives on Labour and Income (Statistics Canada, Catalogue 75-001E) 7, no.2 (Summer 1995):37-39. This article was written by Sophie Lefebvre. Sophie is a Statistics Canada economist and is formerly of the Manufacturing, Construction and Energy Division. Further information on Canadian manufacturing can be found in the publication, Manufacturing Industries of Canada: National and Provincial Areas (31-203-XPB). This publication is available annually for $68 per issue in Canada and for U.S. $68 outside Canada. Order this publication by telephone: 1-800-267-6677, by fax: 1-800-889-9734, or by Internet: Order. For more information about manufacturing data or time-series call the Disclosure and Dissemination Unit, Manufacturing, Construction and Energy Division at (613) 951-9497 or by Internet: manufact@statcan.gc.ca.
|
|
|
|


