
Digital Insights
Who are the users of digital government services? Exploring the characteristics of Canadian individuals and businesses using digital government services
by Peter Jiao, Shacong She, Howard Bilodeau, Christopher Collins and Mark Uhrbach
Skip to text
Text begins
Introduction
Government services are undergoing a digital transformation to modernize their delivery and provide individual Canadians and Canadian businesses with digital programs and services that are efficient, secure and
According to the Government of Canada (GC) Service Inventory, which tracks the number of applications made for GC services from all
While measuring the availability of digital government services is often the focus of modernization efforts, the factors affecting demand for these services are also important to consider when evaluating their adoption rates. To better quantify some of these demand-side aspects, this article leverages data from two technology use surveys—the Canadian Internet Use Survey (CIUS), to capture individuals’ perspectives, and the Survey of Digital Technology and Internet Use (SDTIU), to capture business perspectives. It profiles users of digital government services and examines the barriers faced by current and potential users. The primary focus is on individual Canadians, with some comparisons with Canadian businesses’ digital interactions with the federal government, where relevant data are available. The CIUS examines government services broadly, without distinguishing between federal, provincial or local governments, whereas the SDTIU covers only federal government services.
Section 1: Trends in the use of digital government services
According to the GC Service Inventory, online applications for federal services constituted about half (50.4%, or 168 million applications) of all applications made in 2019/2020. However, dramatic growth was observed in the delivery of online services in the years following the onset of the pandemic. In 2023/2024, 267 million applications were completed online, accounting for about two-thirds (65.5%) of all applications
The growing use of digital government services is also reflected in findings from the CIUS and SDTIU. From 2018 to 2022, the percentage of individual Canadians interacting in some way with digital government services increased from 67.5% to 76.3%, with the most rapid period of growth occurring from 2018 to 2020 (+6.6 percentage points).
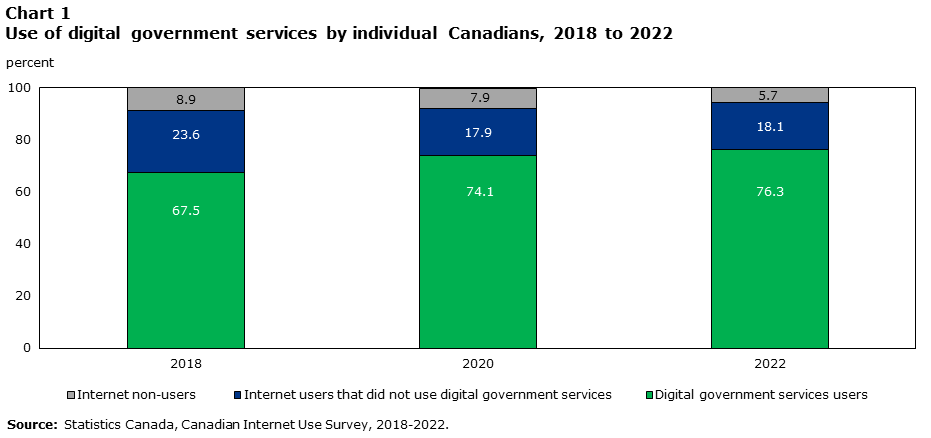
Data table for Chart 1
| Canadians | 2018 | 2020 | 2022 |
|---|---|---|---|
| percent | |||
| Source: Statistics Canada, Canadian Internet Use Survey, 2018-2022. | |||
| Internet non-users | 8.9 | 7.9 | 5.7 |
| Internet users that did not use digital government services | 23.6 | 17.9 | 18.1 |
| Digital government services users | 67.5 | 74.1 | 76.3 |
In 2022, individuals were most likely to report that they researched information using government sources (53.1%); accessed an account for a government program or service (40.6%); or paid a government service fee, tax, fine or ticket (40.0%).
| Activity | Digital government service users |
|---|---|
| percentage of individual Canadians | |
|
|
| Total, all activities | 76.3 Table 1 Note A |
| Researched information | 53.1 Table 1 Note A |
| Accessed an account for a government program or service | 40.6 Table 1 Note A |
| Paid a government service fee, tax, fine or ticket | 40.0 Table 1 Note A |
| Filed your income taxes on your own | 29.4 Table 1 Note A |
| Submitted a form or application for a government program or service online | 25.5 Table 1 Note A |
| Downloaded a government form that was submitted in person | 23.0 Table 1 Note A |
| Communicated with a government organization by email or via social media | 12.9 Table 1 Note A |
| Expressed your opinion or provided feedback during an online government consultation relating to government policies or programs | 8.0 Table 1 Note A |
| Other activities | 5.3 Table 1 Note A |
Interactions with federal digital government services were even higher among Canadian businesses during a similar period (2019 to 2023). Similar to individual Canadians, the percentage of businesses using these services increased from 90.4% in 2019 to 94.3% in 2021. However, use subsequently fell in 2023 to
| Activity | Federal digital government service users |
|---|---|
| percentage of Canadian businesses Table 2 Note 1 | |
|
|
| Total, all activities | 92.8 Table 2 Note A |
| Tax declaration | 76.6 Table 2 Note A |
| Download documents or forms | 70.9 Table 2 Note A |
| Other online payments to government organizations | 35.2 Table 2 Note A |
| Apply for or renew business permits or license | 28.9 Table 2 Note A |
| Apply for grants, subsidies, benefits, or government-provided insurance | 22.0 Table 2 Note A |
| Obtain data | 16.6 Table 2 Note A |
| Register or change a business name, number or tax account | 16.3 Table 2 Note A |
| Check the status of an application or other service request | 13.5 Table 2 Note A |
| Request other services | 7.1 Table 2 Note A |
| Other activities | 6.4 Table 2 Note A |
| Provide feedback on services received | 4.6 Table 2 Note A |
| Submit information related to a government request for proposal | 4.5 Table 2 Note A |
| File a patent or other intellectual property application | 1.0 Table 2 Note A |
Section 2: The profile of government service users
In the digital age, access to digital technologies and the Internet has become crucial for receiving services, finding information, and participating in new economic and social opportunities. However, not everyone enjoys the same level of connectivity or has the digital skills required to fully use what digital technologies have to offer, giving rise to the phenomenon known as the digital
Internet use is a prerequisite for digital government service use, but their digital divides are not identical
Internet use in general and the use of digital government services share many of the same digital divides. For example, in both of these cases, the 2022 CIUS found that the rate of use was highest among individuals aged 25 to 34 and lowest among those aged 65 and older.
These trends can be explained, in part, by the fact that using the Internet is a prerequisite for using digital government services. However, digital divides can also vary by technology. For example, despite having a nearly universal Internet use rate (99.2%), the use of digital government services (71.8%) was much less common among those aged 15 to 24 in 2022, likely because many in this age group have parents, guardians or caregivers capable of interacting with the government on their behalf.
As shown in Table 3, digital divides in the use of digital government services also exist across many other socioeconomic and geographic characteristics. Moreover, these patterns are present across the most reported types of online interactions with the government, as previously discussed (i.e., researching information, accessing accounts and making payments).
| Characteristics | Internet users | Digital government service users |
|---|---|---|
| percentage of individual Canadians | ||
Source: Statistics Canada, Canadian Internet Use Survey, 2022. |
||
| Total, Canadians aged 15 and older | 94.5 Table 3 Note A | 76.3 Table 3 Note A |
| Age group (years) | ||
| 15 to 24 | 99.2 Table 3 Note A | 71.8 Table 3 Note A |
| 25 to 34 | 99.4 Table 3 Note A | 91.3 Table 3 Note A |
| 35 to 44 | 99.0 Table 3 Note A | 89.0 Table 3 Note A |
| 45 to 54 | 98.3 Table 3 Note A | 83.4 Table 3 Note A |
| 55 to 64 | 94.6 Table 3 Note A | 76.0 Table 3 Note A |
| 65 and over | 82.6 Table 3 Note A | 55.4 Table 3 Note A |
| Gender Table 3 Note 1 | ||
| Men+ | 94.8 Table 3 Note A | 78.4 Table 3 Note A |
| Women+ | 94.2 Table 3 Note A | 74.2 Table 3 Note A |
| Highest certificate, diploma or degree completed | ||
| High school or less | 87.9 Table 3 Note A | 58.3 Table 3 Note A |
| Some post-secondary (including university certificate) | 95.5 Table 3 Note A | 78.5 Table 3 Note A |
| University degree | 98.9 Table 3 Note A | 90.1 Table 3 Note A |
| Employment status | ||
| Employed | 98.4 Table 3 Note A | 85.4 Table 3 Note A |
| Not employed | 87.6 Table 3 Note A | 61.5 Table 3 Note A |
| Knowledge of official languages | ||
| English only | 95.7 Table 3 Note A | 77.4 Table 3 Note A |
| French only | 85.5 Table 3 Note A | 60.7 Table 3 Note A |
| Neither English nor French | 91.5 Table 3 Note A | 63.4 Table 3 Note A |
| Both English and French | 97.4 Table 3 Note A | 82.2 Table 3 Note A |
| Household composition | ||
| Multi-person household | 97.5 Table 3 Note A | 80.4 Table 3 Note A |
| Single-person household | 87.1 Table 3 Note A | 66.0 Table 3 Note A |
| Census family income quartile | ||
| Quartile 1 | 85.9 Table 3 Note A | 63.0 Table 3 Note A |
| Quartile 2 | 95.4 Table 3 Note A | 75.4 Table 3 Note A |
| Quartile 3 | 97.9 Table 3 Note A | 81.8 Table 3 Note A |
| Quartile 4 | 98.8 Table 3 Note A | 84.9 Table 3 Note A |
| Racialized group Table 3 Note 2 | ||
| Black | 95.6 Table 3 Note A | 77.0 Table 3 Note A |
| Chinese | 98.2 Table 3 Note A | 87.0 Table 3 Note A |
| Filipino | 96.8 Table 3 Note A | 82.9 Table 3 Note A |
| Arab | 96.1 Table 3 Note A | 83.1 Table 3 Note A |
| Korean | 96.9 Table 3 Note A | 86.8 Table 3 Note A |
| Japanese | 98.2 Table 3 Note A | 80.6 Table 3 Note A |
| Latin American | 97.5 Table 3 Note A | 82.1 Table 3 Note A |
| Southeast Asian | 97.9 Table 3 Note A | 89.7 Table 3 Note A |
| South Asian | 98.6 Table 3 Note A | 80.4 Table 3 Note A |
| West Asian | 97.1 Table 3 Note A | 83.2 Table 3 Note A |
| Other or multiple racialized groups | 94.6 Table 3 Note A | 78.7 Table 3 Note A |
| Non-racialized and non-Indigenous | 93.2 Table 3 Note A | 73.7 Table 3 Note A |
| Immigrant status (since 1952) | ||
| Landed immigrant | 96.7 Table 3 Note A | 82.2 Table 3 Note A |
| Non-landed immigrant Table 3 Note 3 | 94.0 Table 3 Note A | 74.9 Table 3 Note A |
| Disability status | ||
| Person with a disability | 90.4 Table 3 Note A | 67.9 Table 3 Note A |
| Person without a disability | 94.7 Table 3 Note A | 77.1 Table 3 Note A |
| Province | ||
| Newfoundland and Labrador | 91.7 Table 3 Note A | 74.6 Table 3 Note A |
| Prince Edward Island | 92.6 Table 3 Note A | 70.4 Table 3 Note A |
| Nova Scotia | 91.9 Table 3 Note A | 71.1 Table 3 Note A |
| New Brunswick | 90.9 Table 3 Note A | 71.8 Table 3 Note A |
| Quebec | 92.2 Table 3 Note A | 73.7 Table 3 Note A |
| Ontario | 95.5 Table 3 Note A | 77.1 Table 3 Note A |
| Manitoba | 92.6 Table 3 Note A | 71.9 Table 3 Note A |
| Saskatchewan | 93.7 Table 3 Note A | 71.5 Table 3 Note A |
| Alberta | 95.2 Table 3 Note A | 78.2 Table 3 Note A |
| British Columbia | 96.9 Table 3 Note A | 80.6 Table 3 Note A |
| Rural or urban status Table 3 Note 4 | ||
| Rural | 91.9 Table 3 Note A | 70.2 Table 3 Note A |
| Urban | 95.1 Table 3 Note A | 77.6 Table 3 Note A |
Many of the digital divides in the use of digital government services persist when simultaneously controlling for multiple characteristics in a multivariate model (found in Appendix A). This model found that in 2022,
Additionally, the multivariate model found that residents of Prince Edward Island, Nova Scotia, New Brunswick, Ontario, Manitoba, Saskatchewan and Alberta were less likely to use digital government services than residents of British Columbia (the reference
Use of federal digital government services was consistent across most business sizes and industrial sectors
Compared with individuals, Canadian businesses showed fewer digital divides in their use of federal digital government services, by enterprise size and industrial sector, the characteristics available in the SDTIU. This uniformity may be because businesses generally face a greater regulatory burden than individuals, leading to more government interactions and making online services more necessary to reduce administrative
Only businesses in the finance and insurance (87.9%) and management of companies and enterprises (86.2%) sectors had usage rates below 90% in 2023. Lower use of digital government services in these sectors was primarily attributable to a smaller percentage of businesses than average applying for grants, subsidies, benefits or government-provided
| Enterprise size and industrial sector | Federal digital government service users |
|---|---|
| percentage of Canadian businesses Table 4 Note 1 | |
|
|
| Total, private sector businesses | 92.8 Table 4 Note A |
| Enterprise size | |
| Large enterprises Table 4 Note 2 | 97.1 Table 4 Note A |
| Medium enterprises Table 4 Note 3 | 94.8 Table 4 Note A |
| Small enterprises Table 4 Note 4 | 92.3 Table 4 Note A |
| Industrial sector Table 4 Note 5 | |
| Information and cultural industries | 99.3 Table 4 Note A |
| Mining, quarrying, and oil and gas extraction | 96.6 Table 4 Note A |
| Professional, scientific and technical services | 95.5 Table 4 Note A |
| Wholesale Trade | 95.0 Table 4 Note B |
| Arts, entertainment and recreation | 94.9 Table 4 Note A |
| Other services (except public administration) Table 4 Note 6 | 94.3 Table 4 Note B |
| Retail Trade | 93.7 Table 4 Note A |
| Educational services | 93.4 Table 4 Note A |
| Utilities | 93.0 Table 4 Note A |
| Construction Table 4 Note 7 | 92.8 Table 4 Note B |
| Real estate and rental and leasing | 92.8 Table 4 Note B |
| Manufacturing | 91.9 Table 4 Note A |
| Accomodation and food services | 91.8 Table 4 Note B |
| Health care and social assistance | 90.9 Table 4 Note B |
| Administrative and support, waste management and remediation services | 90.5 Table 4 Note B |
| Transportation and warehousing | 90.2 Table 4 Note B |
| Finance and insurance | 87.9 Table 4 Note B |
| Management of companies and enterprises Table 4 Note 8 | 86.2 Table 4 Note B |
Section 3: Problems encountered when accessing digital government services
To better understand the supply-side attributes affecting demand for digital government services, the CIUS and SDTIU asked respondents about the problems they encountered while using these services and the reasons why non-users did not use them.
In 2022, the problems most commonly encountered by individual Canadians accessing digital government services included having difficulty finding the right information on websites (46.0%), difficulty finding customer service assistance (31.6%) and difficulty finding correct websites (29.9%). The percentage of individual digital government service users identifying at least one problem increased from 40.2% in 2018 to 52.0% in 2020 and 65.8% in 2022.
Meanwhile, Canadian businesses that use federal digital government services reported challenges less commonly. Fewer than 1 in 10 businesses (8.1%) that used digital government services reported encountering a problem in 2023, slightly down from 9.7% in 2021, when the use of these services was higher, and up slightly from 6.5% in 2019. These differences compared with individual Canadians may be explained, in part, by businesses requiring more consistent interaction with government organizations than individuals, increasing businesses’ familiarity with online services. Additionally, the broader definition of digital government services used in the CIUS—which included all levels of government—may have captured more situations where users could have encountered challenges, compared with the SDTIU, which examined federal services only.
Among individuals who did not use digital government services in 2022, the most common reason given was a lack of need, interest or time (73.7%). Among businesses that did not use federal digital government services in 2023, a majority (83.9%) reported no specific barrier or obstacle preventing online interaction with the federal government; they just did not want or need to do so.
Conclusion
The digital transformation of government services seeks to improve their availability and efficiency. However, the supply of such services is only one piece of the puzzle. This article used demand-side data to better understand the profile of individual and business users of digital government services.
The profile of individuals who use digital government services largely reflects the broader patterns of the digital divide, with a few exceptions, and few specific barriers are preventing non-users from adopting these services. In contrast, similar proportions of businesses by enterprise size and industrial sector used federal digital government services, likely related to these services being essential in reducing administrative burden. However, this high-level analysis may not fully capture all the digital divides among businesses because of the focus on basic enterprise-level attributes. Future research could examine additional attributes, such as business age and the sociodemographic characteristics of business owners, to further investigate whether businesses experience digital divides similar to those identified among individuals.
Despite few individuals reporting specific barriers to accessing digital government services, some experienced issues when attempting to use these services, primarily related to difficulties finding the information they needed. Businesses were much less likely to report such issues and were more likely to use these services than individuals.
As the number and sophistication of services available online grow over time, the variety of ways to interact with government services online is expected to expand, increasing the need for timely metrics on digital government services.
Methodology
Statistics for individual Canadians are from the 2018 to 2022 iterations of the Canadian Internet Use Survey (CIUS). The CIUS has a target population of individuals aged 15 years and older living in the 10 provinces of Canada, excluding residents of Indigenous reserves.
Statistics for Canadian businesses are from the 2019 to 2023 iterations of the Survey of Digital Technology and Internet Use (SDTIU). The target population used in this article is businesses with five or more employees across most industrial sectors. Respondents for the SDTIU are information technology managers or equivalent.
At the time of publication, the 2022 CIUS and 2023 SDTIU were the most recent iterations of each survey. All estimates presented in this paper were weighted to be representative of their respective target populations.
In this paper, statistics on the use of digital government services from the SDTIU exclude responses of “Don’t know” from the denominator to improve comparability across sizes and sectors and over time. In contrast, the previously published SDTIU table 22-10-0122-01 includes “Don’t know” responses in the denominator.
Acknowledgments
The authors would like to thank several of their Statistics Canada colleagues, including Haig McCarrell, Lydia Couture and Tia Carpino, for their guidance in writing this paper.
Appendix A: Multivariate logistic regression results
| Characteristics | Digital government service users | |
|---|---|---|
| percentage of individual Canadians | odds ratio from logistic regression | |
Source: Statistics Canada, Canadian Internet Use Survey, 2022. |
||
| Total, Canadians aged 15 and older | 76.3 Table A.1 Note A | ... not applicable |
| Age group (years) | ||
| 15 to 24 | 71.8 Table A.1 Note A | 1.7 Table A.1 Note ** |
| 25 to 34 | 91.3 Table A.1 Note A | 4.1 Table A.1 Note ** |
| 35 to 44 | 89.0 Table A.1 Note A | 2.8 Table A.1 Note ** |
| 45 to 54 | 83.4 Table A.1 Note A | 2.1 Table A.1 Note ** |
| 55 to 64 | 76.0 Table A.1 Note A | 1.8 Table A.1 Note ** |
| 65 and over (ref.) | 55.4 Table A.1 Note A | ... not applicable |
| Gender Table A.1 Note 1 | ||
| Men+ | 78.4 Table A.1 Note A | 1.2 Table A.1 Note ** |
| Women+ (ref.) | 74.2 Table A.1 Note A | ... not applicable |
| Highest certificate, diploma or degree completed | ||
| High school or less | 58.3 Table A.1 Note A | 0.2 Table A.1 Note ** |
| Some post-secondary (including university certificate) | 78.5 Table A.1 Note A | 0.5 Table A.1 Note ** |
| University degree (ref.) | 90.1 Table A.1 Note A | ... not applicable |
| Employment status | ||
| Employed | 85.4 Table A.1 Note A | 1.5 Table A.1 Note ** |
| Not employed (ref.) | 61.5 Table A.1 Note A | ... not applicable |
| Knowledge of official languages | ||
| English only | 77.4 Table A.1 Note A | 0.9 |
| French only | 60.7 Table A.1 Note A | 0.6 Table A.1 Note ** |
| Neither English nor French | 63.4 Table A.1 Note A | 0.7 |
| Both English and French (ref.) | 82.2 Table A.1 Note A | ... not applicable |
| Household composition | ||
| Multi-person household | 80.4 Table A.1 Note A | 1.5 Table A.1 Note ** |
| Single-person household (ref.) | 66.0 Table A.1 Note A | ... not applicable |
| Census family income quartile | ||
| Quartile 1 | 63.0 Table A.1 Note A | 0.8 Table A.1 Note ** |
| Quartile 2 | 75.4 Table A.1 Note A | 1.0 |
| Quartile 3 | 81.8 Table A.1 Note A | 1.1 |
| Quartile 4 (ref.) | 84.9 Table A.1 Note A | ... not applicable |
| Racialized group Table A.1 Note 2 | ||
| Black | 77.0 Table A.1 Note A | 0.9 |
| Chinese | 87.0 Table A.1 Note A | 1.5 Table A.1 Note * |
| Filipino | 82.9 Table A.1 Note A | 1.3 |
| Arab | 83.1 Table A.1 Note A | 1.0 |
| Korean | 86.8 Table A.1 Note A | 1.3 |
| Japanese | 80.6 Table A.1 Note A | 0.9 |
| Latin American | 82.1 Table A.1 Note A | 1.1 |
| Southeast Asian | 89.7 Table A.1 Note A | 1.7 |
| South Asian | 80.4 Table A.1 Note A | 0.8 |
| West Asian | 83.2 Table A.1 Note A | 0.8 |
| Other or multiple racialized groups | 78.7 Table A.1 Note A | 1.0 |
| Non-racialized and non-Indigenous (ref.) | 73.7 Table A.1 Note A | ... not applicable |
| Immigrant status (since 1952) | ||
| Landed immigrant | 82.2 Table A.1 Note A | 1.1 |
| Non-landed immigrant Table A.1 Note 3 (ref.) | 74.9 Table A.1 Note A | ... not applicable |
| Disability status | ||
| Person with a disability | 67.9 Table A.1 Note A | 1.0 |
| Person without a disability (ref.) | 77.1 Table A.1 Note A | ... not applicable |
| Province | ||
| Newfoundland and Labrador | 74.6 Table A.1 Note A | 0.9 |
| Prince Edward Island | 70.4 Table A.1 Note A | 0.7 Table A.1 Note * |
| Nova Scotia | 71.1 Table A.1 Note A | 0.7 Table A.1 Note * |
| New Brunswick | 71.8 Table A.1 Note A | 0.8 Table A.1 Note * |
| Quebec | 73.7 Table A.1 Note A | 0.8 |
| Ontario | 77.1 Table A.1 Note A | 0.8 Table A.1 Note * |
| Manitoba | 71.9 Table A.1 Note A | 0.7 Table A.1 Note ** |
| Saskatchewan | 71.5 Table A.1 Note A | 0.7 Table A.1 Note ** |
| Alberta | 78.2 Table A.1 Note A | 0.7 Table A.1 Note ** |
| British Columbia (ref.) | 80.6 Table A.1 Note A | ... not applicable |
| Rural or urban status Table A.1 Note 4 | ||
| Rural | 70.2 Table A.1 Note A | 0.9 |
| Urban (ref.) | 77.6 Table A.1 Note A | ... not applicable |
References
Government of Canada (2025). Canada’s Digital Ambition 2024-25. Retrieved January 7, 2026.
Interac (2023). Control is top of mind for Canadians when it comes to online personal information, according to new Data Privacy Week poll. Retrieved January 7, 2026.
Kwok, T. & Korpela, V. (2024). Improving Canada’s Digital Divide. The Dais at Toronto Metropolitan University. Retrieved January 7, 2026.
Lamb, C., Munro, D., & Vu, V. (2023). Byte-Sized Progress: Assessing Digital Transformation in the Government of Canada. The Dais at Toronto Metropolitan University. Retrieved January 7, 2026.
Martins, J. & Veiga, L. G. (2022). Digital government as a business facilitator. Information Economics and Policy, Volume 60, 2022, 100990.
Office of the Auditor General of Canada (2023). Reports of the Auditor General of Canada to the Parliament of Canada: Modernizing Information Technology Systems. Retrieved January 7, 2026.
Treasury Board of Canada Secretariat (2025). Infographic for Government of Canada. GC InfoBase. Retrieved January 7, 2026.
United Nations (2024). UN E-Government Knowledgebase, Country Data. Retrieved January 7, 2026.
- Date modified: