
Rural and Small Town Canada Analysis Bulletin
The outlook of rural businesses, second quarter of 2023
Skip to text
Text begins
In April 2023, the Consumer Price Index rose by 4.4% year over year,Note remaining higher than the inflation-control target of 2.0% set by the Bank of Canada.Note By contrast, prices of Canadian manufactured products declined by 3.5% from April 2022 and prices for raw materials purchased by manufacturers operating in Canada fell by 10.8% over the same period.Note Hourly wage growth remained high, increasing by 5.2% year over year.Note In rural and small town (RST) Note areas, employment, unadjusted for seasonality, increased by 29,300 (+1.2%) in April, compared with the previous month, while the unemployment rate held steady at 6.1% over this time.Note
Under these conditions, RST businesses expected to face varied obstacles over the short termNote related to high inflation, costs, and supply chains based on results from the Canadian Survey on Business Conditions (CSBC). The CSBC provides detailed information on businesses’Note perceptions of the environment in which they are currently operating and on their expectations, moving forward. This analysis focuses on businesses in RST areas using results from the CSBC, for the second quarter of 2023, conducted from April 3 to May 8, 2023.
Compared with the previous quarter, the pressures faced by RST businesses, to a certain degree, eased in the second quarter of 2023. More than three-quarters (75.9%) of RST businesses were somewhat or very optimistic about their outlook, up 5.6 percentage points since the first quarter of 2023.
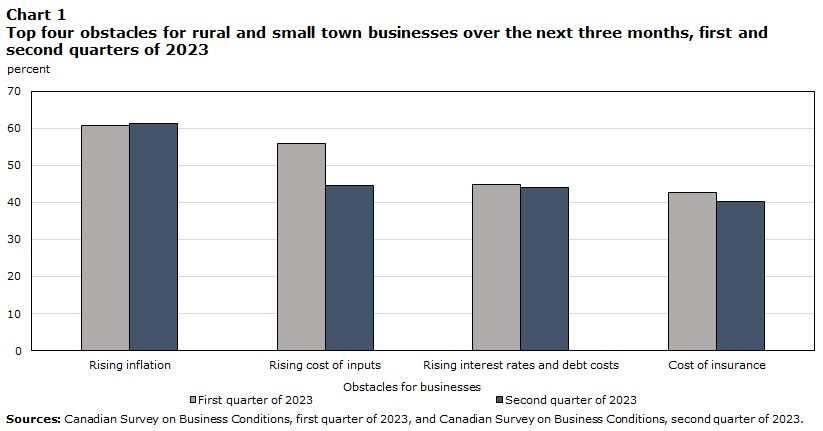
Rising inflation continued to be the most frequently expected short term obstacle reported by RST businesses (61.3%), followed by the rising cost of inputs (e.g., labour, capital, energy and raw materials) (44.6%), rising interest rates and debt costs (44.0%), and the cost of insurance (40.3%). Nearly 3 in 10 RST businesses (29.7%) expected to raise their prices over the next three months; however, the share of businesses expecting to do so declined by 6.4 percentage points compared with the first quarter of 2023.
Of the RST businesses that expected challenges in supply chains or inventory levels, over one-quarter (27.8%) reported that their supply chain challenges had worsened in the last three months, down 12.4 percentage points from the first quarter of 2023. Nearly two-thirds (65.4%) of RST businesses expected supply chain difficulties to remain the same over the next three months, while just under one-fifth (18.6%) of RST businesses expected improvements over that time.
In the second quarter of 2023, the majority of RST businesses (92.3%) and urban businesses (88.4%) reported that they did not export or sell goods or services to markets outside Canada over the last year. However, a small percentage of RST and urban businesses did export to various international markets, including the United States, Europe or the United Kingdom, and China.
Rural and small town businesses continue to expect obstacles related to rising inflation and costs
In the second quarter of 2023, rising inflation continued to be the most frequently expected short term obstacle for RST businesses (61.3%), remaining relatively stable from the previous quarter (60.7%). Rising inflation was also the most frequently anticipated obstacle for urban businesses, declining from 57.6% in the first quarter of 2023 to 54.9% in the second quarter of 2023.
RST businesses in agriculture, forestry, fishing and hunting (73.1%) were the most likely to expect rising inflation to be an obstacle over the next three months, up 5.3 percentage points from the previous quarter. For urban businesses, those in accommodation and food services (69.0%) were the most likely to expect rising inflation to be an obstacle, up 2.5 percentage points from the first quarter of 2023. By contrast, a similar proportion of RST businesses (31.1%) and urban businesses (30.5%) in finance and insurance were the least likely to expect rising inflation to be a challenge in the short term.
Data table for Chart 1
| Obstacles for businesses | Rising inflation | Rising cost of inputs | Rising interest rates and debt costs | Cost of insurance |
|---|---|---|---|---|
| percent | ||||
| First quarter of 2023 | 60.7 | 56.0 | 44.8 | 42.7 |
| Second quarter of 2023 | 61.3 | 44.6 | 44.0 | 40.3 |
| Sources: Canadian Survey on Business Conditions, first quarter of 2023, and Canadian Survey on Business Conditions, second quarter of 2023. | ||||
The rising cost of inputs was the second most commonly cited obstacle, expected by 44.6% of RST businesses, declining 11.4 percentage points since the first quarter of 2023. Although urban businesses also had concerns emanating from the rising cost of inputs, at 39.4%, they were less likely to expect this as an obstacle compared with their RST counterparts.
The next most commonly expected obstacles by RST businesses were rising interest rates and debt costs (44.0%), which held relatively steady from the first quarter of 2023 (44.8%), followed by the cost of insurance (40.3%), which came in at 2.4 percentage points lower than reported over this period. These two anticipated obstacles were also expected less frequently by urban businesses compared with RST businesses, at 37.4% and 30.1%, respectively. For the second quarter of 2023, the cost of insurance surpassed transportation costs as one of the top four expected short term obstacles for RST businesses.
Supply chains continue to be a challenge for rural and small town businesses
Nearly 3 in 10 (27.9%) RST businesses expected challenges in supply chains or inventory levels over the next three months, although this proportion was down 4.4 percentage points from the previous quarter. Among RST businesses that anticipated difficulties in supply chains or inventory levels, over one-quarter (27.8%) reported that supply chain issues had become more severe over the preceding three months, declining 12.4 percentage points from the first quarter of 2023. Looking ahead to the next three months, nearly two-thirds (65.4%) of RST businesses that anticipated supply chain difficulties expected them to remain unchanged, while nearly one-fifth (18.6%) expected improvements over this time.
Of the RST businesses that expected supply chain or inventory level challenges, the top three factors cited to be contributing to worsened supply chain issues in the second quarter of 2023 were supply shortages resulting in fewer inputs, products or supplies (78.3%); increased prices of inputs, products or supplies (70.2%); and delays in deliveries of inputs, products or supplies (63.6%). By contrast, the first quarter of 2023 saw increased prices (84.4%) taking precedence, followed by delays in deliveries (77.0%) and supply shortages (69.8%) of inputs, products or supplies. To deal with supply chain difficulties over the next 12 months, RST businesses reported planning to partner with new suppliers (37.8%), work with suppliers to improve timeliness (33.1%) and substitute for alternate products (28.2%).

Data table for Chart 2
| Supply chain challenges for businesses | Supply shortages resulted in fewer inputs, products or supplies being available | Increased prices of inputs, products or supplies | Increased delays in deliveries of inputs, products or supplies |
|---|---|---|---|
| percent | |||
| First quarter of 2023 | 69.8 | 84.4 | 77.0 |
| Second quarter of 2023 | 78.3 | 70.2 | 63.6 |
| Sources: Canadian Survey on Business Conditions, first quarter of 2023, and Canadian Survey on Business Conditions, second quarter of 2023. | |||
Majority of rural and small town businesses served the Canadian market over the last 12 months
In the second quarter of 2023, the majority of RST businesses (92.3%) and urban businesses (88.4%) reported that they did not export or sell their goods or services to markets outside Canada in the last 12 months. However, a small share of RST and urban businesses did participate in international markets over the last year.
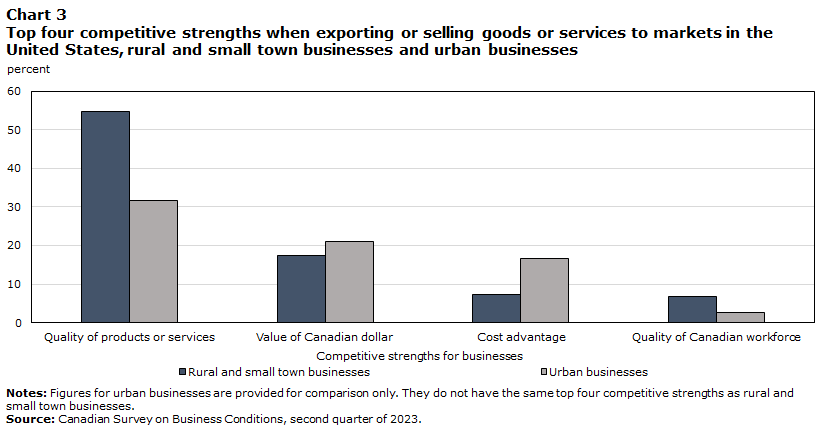
For 6.6% of RST businesses, their goods or services were exported to markets in the United States. Among these RST businesses, over half (54.7%) reported that the quality of their products or services was their most important competitive strength when exporting to this market, while nearly one-fifth (17.3%) of businesses reported that it was the value of the Canadian dollar. Other competitive strengths included cost advantages (7.3%) and the quality of the Canadian workforce (6.8%). Just over 1 in 10 (10.5%) urban businesses exported to markets in the United States, with nearly one-third (31.6%) of these businesses indicating the quality of their products or services as their greatest competitive strength, followed by the value of the Canadian dollar (21.0%), cost advantages (16.5%), and market leading innovation or intellectual property (12.3%). RST businesses (41.5%) were less likely than urban ones (59.4%) to report U.S. businesses as their primary competitors for their products when exporting to markets in the United States.
Data table for Chart 3
| Competitive strengths for businesses | Quality of products or services | Value of Canadian dollar | Cost advantage | Quality of Canadian workforce |
|---|---|---|---|---|
| percent | ||||
| Rural and small town businesses | 54.7 | 17.3 | 7.3 | 6.8 |
| Urban businesses | 31.6 | 21.0 | 16.5 | 2.7 |
|
Notes: Figures for urban businesses are provided for comparison only. They do not have the same top four competitive strengths as rural and small town businesses. Source: Canadian Survey on Business Conditions, second quarter of 2023. |
||||
A smaller proportion (2.7%) of RST businesses exported their goods or services to markets in Europe or the United Kingdom in the last 12 months. A similar proportion of urban businesses (2.9%) did the same. RST businesses (2.1%) were less likely than urban businesses (27.0%) to report that market leading innovation or intellectual property was an important competitive strength for their business when exporting to this market. The percentage of RST businesses (0.7%) that exported to markets in China over the last year was comparable with that of urban businesses (1.1%).
Rural and small town business expectations about the sales of and demand for their goods and services up from the previous quarter
For most RST businesses, the sales of (60.2%) and demand for (62.8%) their goods and services were expected to hold steady in the short term. Just under one-quarter (23.7%) of RST businesses anticipated an increase in the sales of their goods and services, 5.9 percentage points higher than the first quarter of 2023. Similarly, 28.2% of RST businesses expected the demand for their goods and services to increase, 10.1 percentage points higher over this period.
Over half (53.9%) of RST businesses expected operating expenses to increase over the next three months. Nearly 3 in 10 RST businesses (29.6%) and urban businesses (28.6%) were concerned that their profitability would decrease over the same period. However, for RST and urban businesses, such concerns were down 3.1 and 6.4 percentage points, respectively, from the first quarter of 2023. Meanwhile, more than half of RST businesses (52.2%) and urban businesses (54.1%) expected their profitability to remain stable in the short term.
Nearly 3 in 10 (29.7%) RST businesses expected to raise their prices over the next three months, with a similar share of urban businesses (28.0%) expecting to do the same; however, these shares declined 6.4 and 4.2 percentage points, respectively, compared with the previous quarter. The majority (60.1%) of RST businesses expected that the prices of their goods and services would be relatively unchanged over the next three months.
Nearly four-fifths (79.2%) of RST businesses expected the number of employees to stay approximately the same in the next three months. A similar proportion of urban businesses (78.0%) expected the same. This is juxtaposed with 47.3% of RST businesses and 54.1% of urban businesses that were expecting vacant positions to remain relatively unchanged over the same period. A smaller share (7.1%) of RST businesses foresaw an increase in vacant positions, while an even smaller share (4.9%) forecasted a decline.
Just over half (50.7%) of RST businesses planned to increase wages offered to existing employees over the next year, and over one-quarter (26.3%) planned to encourage their employees to participate in on-the-job training. Training expenditures were expected to increase for 14.5% of RST businesses over the next three months, while a smaller proportion (3.7%) anticipated an increase in research and development expenditures.
Most rural and small town businesses do not plan to take on more debt
Most RST businesses (82.8%) reported having the cash or liquid assets required to operate in the second quarter of 2023, up 2.5 percentage points since the previous quarter. A smaller share (6.1%) of RST businesses did not have the cash or liquid assets required to operate, although this was down 2.7 percentage points since the first quarter of 2023.
Data table for Chart 4
| Reasons for businesses to not take on more debt | Interest rates are unfavourable | Cash flow | Lack of confidence or uncertainty in future sales |
|---|---|---|---|
| percent | |||
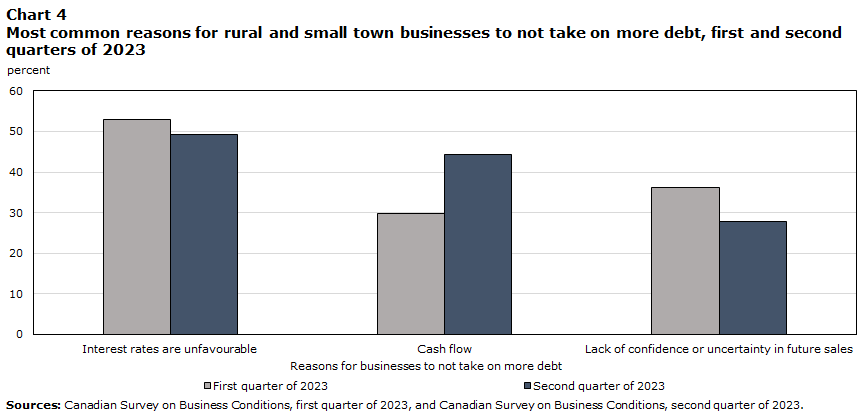
| First quarter of 2023 | 52.9 | 29.7 | 36.1 |
| Second quarter of 2023 | 49.3 | 44.4 | 27.8 |
| Sources: Canadian Survey on Business Conditions, first quarter of 2023, and Canadian Survey on Business Conditions, second quarter of 2023. | |||
In the second quarter of 2023, 78.1% of RST businesses did not plan to take on more debt over the next three months, increasing 2.8 percentages points from the previous quarter. Among these businesses, more than one-fifth (21.8%) did not have the ability to take on more debt; however, this share declined 4.5 percentage points compared with the first quarter of 2023. The top reasons cited for their inability to take on more debt included unfavourable interest rates (49.3%), cash flow (44.4%) and lack of confidence or uncertainty in future sales (27.8%).
Future outlook improves from the previous quarter for rural and small town businesses
In the second quarter of 2023, more than three-quarters (75.9%) of RST businesses were somewhat or very optimistic about their 12-month outlook, increasing 5.6 percentage points from the previous quarter.
RST businesses in construction (85.9%; +24.7 percentage points), other services (except public administration) (85.4%; +15.1 percentage points) and retail trade (82.9%; +9.8 percentage points) were among the most likely to be somewhat or very optimistic about their outlook. To varying extents, each of these industries has been on an upward trajectory from the first quarter of 2023.
By contrast, the industries in which RST businesses were among the least likely to be somewhat or very optimistic about their future outlook were mining, quarrying, and oil and gas extraction (46.7%); transportation and warehousing (61.6%); and accommodation and food services (66.8%).
Methodology
The Canadian Survey on Business Conditions uses a stratified random sample of business establishments with employees. Data are available at the national, provincial, and territorial levels by industrial sector, employment size, type of business and majority ownership. Proportions are estimated using calibrated weights to calculate the population totals in the domains of interest. The most recent iteration of this survey ran from April 3 to May 8, 2023. The total sample size for this iteration of the survey is 30,554 and the results are based on responses from a total of 15,401 businesses or organizations.
References
Statistics Canada. (2023a). The outlook of rural businesses, second quarter of 2023.
Statistics Canada. (2023b). The outlook of rural businesses, first quarter of 2023.
- Date modified: