
Rural and Small Town Canada Analysis Bulletin
The outlook of rural businesses, fourth quarter of 2022
by Anne Munro, Jacqueline Ha and Andrew Balcom
Skip to text
Text begins
In October 2022, consumer prices rose by 0.7%, marking the largest monthly increase since June 2022.Note Prices had risen by 6.9% compared to the same month in 2021, with gasoline prices increasing by 17.8% over the same period.Note Year-over-year hourly wage growth remained high, increasing by over five percent (5.6%) for a fifth consecutive month.Note Increasing costs of materials and input as well as transportation led to continued supply chain issues for Canadian businesses.
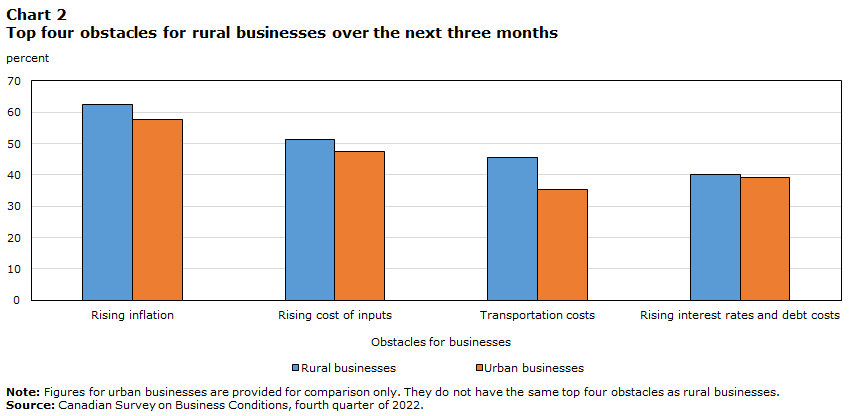
Rising inflation continued to be the most commonly expected short-term obstacle in the fourth quarter of 2022. Over three-fifths (62.4%) of rural businesses reported concern, higher than the 57.6% of urban businesses. The other most common obstacles for rural businesses were the rising cost of inputs (51.4%), transportation costs (45.6%), and rising interest rates and debt costs (40.2%). The majority of rural (64.4%) businesses said they were at least somewhat likely to pass on any increases in their costs to customers over the next 12 months. Despite these challenges, over a quarter (27.6%) of rural businesses reported being very optimistic about the outlook of their business over the next 12 months, slightly higher than the 22.8% seen for urban businesses.
In the fourth quarter of 2022, rural businesses that expected to have future challenges with supply chains or inventory levels were less likely to report that their supply chain challenges had worsened, falling from 64.3% in the third quarter to 51.9%. Those businesses were most likely to plan to adjust by substituting with alternate inputs (33.7%), partnering with new suppliers (27.9%), or working with existing suppliers to improve timeliness (25.6%).
Over half (52.1%) of rural businesses reported that they would be increasing the wages they paid to their staff over the coming year, and a similar number (51.7%) indicated that they considered inflation to a medium or large extent when setting wages or salary amounts. Over a third (34.8%) of rural businesses also expected that they would be increasing the selling price of their goods and services during the same period.
The Canadian Survey on Business Conditions (CSBC) provides detailed information on businesses’ perceptions of the environment in which they are currently operating as well as their expectations moving forward. This analysis focuses on businesses in rural areasNote using results from the CSBC, fourth quarter of 2022, conducted from October 3 to November 7, 2022.
Rural businesses more optimistic about their future compared to early 2022
Compared to earlier in the year, rural businesses in the fourth quarter of 2022 were slightly more likely to say that they were very optimistic about the outlook of their business over the next 12 months (22.5% in the first quarter of the year compared to 27.6%). Rural businesses in the arts, entertainment and recreation sector saw the largest increase as the percentage of businesses reporting that they were very optimistic rose from 15.0% to 42.3% since the first quarter. With this change, the percentage of rural businesses in the arts, entertainment and recreation sector that were somewhat or very optimistic about their future increased to 90.1%, higher than both the 79.1% for urban businesses in this sector, and the 74.6% seen for rural businesses in the first quarter.

Data table for Chart 1
| Rural businesses | Urban businesses | |
|---|---|---|
| percent | ||
| All industries | 75.0 | 69.3 |
| Agriculture, forestry, fishing and hunting | 67.4 | 62.6 |
| Mining, quarrying, and oil and gas extraction | 61.7 | 65.3 |
| Construction | 79.8 | 70.9 |
| Manufacturing | 73.6 | 72.9 |
| Wholesale trade | 84.9 | 76.4 |
| Retail trade | 75.8 | 64.9 |
| Transportation and warehousing | 51.1 | 55.3 |
| Information and cultural industries | 71.0 | 69.0 |
| Finance and insurance | 78.5 | 73.5 |
| Real estate and rental and leasing | 64.7 | 71.0 |
| Professional, scientific and technical services | 83.0 | 68.4 |
| Administrative and support, waste management and remediation services |
83.7 | 73.7 |
| Health care and social assistance | 90.5 | 78.2 |
| Arts, entertainment and recreation | 90.1 | 79.1 |
| Accommodation and food services | 65.3 | 57.7 |
| Other services (except public administration) | 81.2 | 70.4 |
| Source: Canadian Survey on Business Conditions, fourth quarter of 2022. | ||
Urban businesses saw similar trends over the same period, with 22.8% of businesses reporting themselves to be very optimistic about the next 12 months compared to the beginning of the year (20.8%). The health care and social assistance (26.9% to 42.2%), other services (13.9% to 28.0%), and the information and cultural industry (9.4% to 20.2%) sectors showed the largest increase in optimism for urban businesses.
Over three-fifths of rural businesses cite concerns over rising inflation
While optimism has increased among rural businesses, there are still areas of concern. In the fourth quarter of 2022, rising inflation remained the most expected short-term obstacleNote among rural businesses at 62.4%, relatively unchanged from the 62.7% reported in the previous quarter.
Canadian businesses have continued to link the ongoing pressures in the economy to supply chain disruptions, elevated commodity prices (exacerbated by the war in Ukraine), excess demand, and high labour costs as reasons for the sustained inflation faced globally and domestically.Note The Consumer Price Index (6.9%),Note the Industrial Product Price Index (10.1%)Note and the Raw Materials Price Index (9.0%)Note all increased year-over-year in October 2022 suggesting that rising inflation persists across the economy.
The rising cost of inputs (e.g., labour, capital, energy and raw materials) was the second most common obstacle for over half of rural businesses (51.4%), although it was down 4.6 percentage points since the first quarter. This challenge was also the second most common obstacle amongst urban businesses at 47.5%, which saw a decrease of 1.5 percentage points over the same time period. In response, over three-fifths of rural (64.4%) and urban (61.2%) businesses reported they were somewhat or very likely to pass on any increases in their costs to customers over the next 12 months.
Transportation costs were the third most cited obstacle for rural businesses at 45.6%, 10 percentage points higher than reported by urban businesses (35.5%). Gasoline prices increased 17.8% year-over year in October,Note affecting all businesses, but placing additional burden on rural businesses due to their comparative isolation and extended travel times.
In October 2022, the Bank of Canada raised its key interest rate by 0.5 percentage points to 3.75% in an effort to manage elevated inflation and inflation expectations moving forward.Note Rising interest rates and debt costs were the fourth most common obstacle expected by rural businesses in the short-term at 40.2%, a decline of 2.3 percentage point from the third quarter, while urban businesses reported an increase from 35.8% to 39.3% over the same time period.
Data table for Chart 2
| Rising inflation | Rising cost of inputs | Transportation costs | Rising interest rates and debt costs | |
|---|---|---|---|---|
| percent | ||||
| Rural businesses | 62.4 | 51.4 | 45.6 | 40.2 |
| Urban businesses | 57.6 | 47.5 | 35.5 | 39.3 |
|
Note: Figures for urban businesses are provided for comparison only. They do not have the same top four obstacles as rural businesses. Source: Canadian Survey on Business Conditions, fourth quarter of 2022. |
||||
Most rural businesses expect to increase wages
Of the rural businesses that did not plan to take on more debt over the next three months (79.5%), a quarter (25.0%) of these businesses reported that they did not have the ability to take on more debt. A slightly smaller percentage (19.8%) reported that their current debt level was greater than that just prior to the Covid-19 pandemic. Additionally, 9.6% of rural businesses reported that they did not currently have the cash or liquid assets required to operate their business, although only 1.7% indicated they did not expect to be able to acquire them.
In October 2022, the average hourly wages of employees grew by 5.6% compared to the previous year.Note Just over half (52. 1%) of rural businesses expected their average wages to increase over the next 12 months, with 21. 2% expecting them to increase by 10% or more. A similar overall percentage (51.7%) of rural businesses said that they considered inflation to a medium or large extent when they were setting wages or salaries for their organization.
Rural businesses in accommodation and food services (39.9%), manufacturing (35.7%), and retail trade (28.3%) were the most likely to predict that they would be increasing wages by 10% or more. By contrast, urban businesses in arts, entertainment and recreation were three times more likely to expect wage increases of 10% or more than rural ones (25.3% versus 7.7%). On the other hand, urban businesses in manufacturing were less likely to expect the same level of wage increases, compared to their rural equivalents (20.3% versus 35.7%).
With wages and material costs increasing, over a third (34.8%) of rural businesses expected that the selling price of the goods and services they offered would increase over the next three months. Despite these expected price increases, fewer rural businesses expected that their profitability (9.7%) or cash reserves (8.2%) would increase over the same period.

Data table for Chart 3
| Rural businesses | Urban businesses | |
|---|---|---|
| percent | ||
| All industries | 34.8 | 31.9 |
| Agriculture, forestry, fishing and hunting | 26.8 | 24.0 |
| Mining, quarrying, and oil and gas extraction | 31.9 | 21.2 |
| Construction | 31.6 | 36.8 |
| Manufacturing | 54.7 | 42.9 |
| Wholesale trade | 60.2 | 43.7 |
| Retail trade | 69.8 | 47.8 |
| Transportation and warehousing | 23.5 | 22.5 |
| Information and cultural industries | 46.2 | 19.6 |
| Finance and insurance | 19.4 | 20.7 |
| Real estate and rental and leasing | 21.6 | 22.3 |
| Professional, scientific and technical services | 32.7 | 22.7 |
| Administrative and support, waste management and remediation services |
32.1 | 37.2 |
| Health care and social assistance | 12.8 | 16.5 |
| Arts, entertainment and recreation | 23.6 | 31.4 |
| Accommodation and food services | 44.4 | 45.3 |
| Other services (except public administration) | 19.4 | 34.1 |
| Source: Canadian Survey on Business Conditions, fourth quarter of 2022. | ||
Even with the increase in the prices of both Canadian-made products (10.1%) and raw materials (9.0%),Note the share of rural businesses that reported their supply chain challenges had worsened over the previous three months decreased since the third quarter, from 64.3% to 51.9%. Businesses most commonly attributed these difficulties to increased delays in deliveries of inputs, products or supplies (84.1%), increased prices of inputs, products or supplies (76.4%), and supply shortages having resulted in fewer inputs, products or supplies (74.2%).
For those rural businesses that expected to have difficulties with supply chains or inventory levels, they were most likely to plan to compensate by substituting with alternate inputs (33.7%), partnering with new suppliers (27.9%), or working with suppliers to improve timeliness (25.6%). Rural businesses were less likely than urban ones to report that they planned to address those concerns by investing in research and development (5.3% versus 9.4%) or to say that they planned to take no action (17.4% versus 22.7%).

Data table for Chart 4
| Substitute inputs, products or supplies | Partner with new suppliers | Work with suppliers to improve timeliness | Shift to local suppliers | Implement technological improvements | Invest in research and development projects | None | |
|---|---|---|---|---|---|---|---|
| percent | |||||||
| Rural businesses | 33.7 | 27.9 | 25.6 | 14.6 | 12.8 | 5.3 | 17.4 |
| Urban businesses | 33.2 | 33.3 | 31.8 | 18.2 | 12.2 | 9.4 | 22.7 |
| Source: Canadian Survey on Business Conditions, fourth quarter of 2022. | |||||||
Methodology
From October 3 to November 7, 2022, representatives from businesses across Canada were invited to take part in an online questionnaire about business conditions and business expectations moving forward. The Canadian Survey on Business Conditions uses a stratified random sample of business establishments with employees classified by geography, industry sector, and size. An estimation of proportions is done using calibrated weights to calculate the population totals in the domains of interest. The total sample size for this iteration of the survey is 35,914 and results are based on responses from a total of 17,363 businesses or organizations. Businesses were classified as rural or urban based on their geographic location. The 2016 Census Subdivision Boundary File was used to identify all businesses’ census subdivisions (CSD) based on location. Businesses located in CSDs classified as either Census Metropolitan Areas or Census Agglomerations were classified as urban. All businesses in other locations were classified as rural.
References
Statistics Canada. (2022). The outlook of rural businesses, first quarter of 2022.
Statistics Canada. (2022). The outlook of rural businesses, third quarter of 2022.
- Date modified: