
Rural and Small Town Canada Analysis Bulletin
Rural insights from the Canada Emergency Wage Subsidy: January 17, 2021 to May 8, 2021
Skip to text
Text begins
Background
The onset of the COVID-19 pandemic in the spring of 2020 led to temporary closures, reduced hours, and the implementation of various safety measures for rural and urban businesses across Canada. As the pandemic charted its winding course, these responses needed to be adapted on an ongoing basis. The disruptions impacted businesses in rural and urbanNote areas differently due to differences in their economic environments and regional variation in pandemic measures.
The Canada Emergency Wage Subsidy (CEWS) program was implemented in March 2020 to help offset employers’ revenue losses and to reduce job losses as a result of the economic effects of COVID-19.Note
This article analyzes the use of the CEWS program by rural businesses using Statistics Canada’s updated CEWS Regional and Community-level database.Note This update covers the timeframe from January 17 to May 8, 2021, representing the 12th to the 15th four-week CEWS claim periods.Note
At a glance: key rural findings
Over the 16 weeks from January 17 to May 8, 2021, or the 12th to the 15th CEWS claim periods, rural businesses received $1.5 billion in CEWS payments, representing 10.2% of the national total. These rural subsidies supported an average of 420,000 employees per CEWS period. During the same interval, urban businesses received $12.9 billion in CEWS payments, supporting an average of 3.6 million employees.
Across these first 15 CEWS periods, rural businesses’ shares of both CEWS payments and number of supported employees has remained steady at approximately one-tenth of the nationwide totals. On average, slightly more than one in every six (16.9%) rural employees was supported by the CEWS program over the four periods covered, below the one in five (21.3%) for urban employees. This share remained relatively stable, compared to the average levels over the three previous CEWS periods.
In both rural and urban areas, the manufacturing, construction, and accommodation and food services industries received the largest shares of CEWS subsidies. In rural areas, 46.0% of CEWS subsidies and 44.9% of supported employees were in these industries. The combined shares of these three industries in urban areas were comparatively lower at 37.3% of CEWS subsidies and 36.2% of supported employees.
Both subsidies and the number of employees supported declined in rural areas over the time studied
Coinciding with the decline of the pandemic’s second wave in Canada,Note CEWS subsidies to rural areas showed a gradual decline from a four-period high of about $3.8 billion in periods 12 and 13 to $3.3 billion in period 15 (Chart 1). The number of supported employees in rural areas also declined over this timeframe, from 448,000 in period 12 to 379,000 employees by period 15.
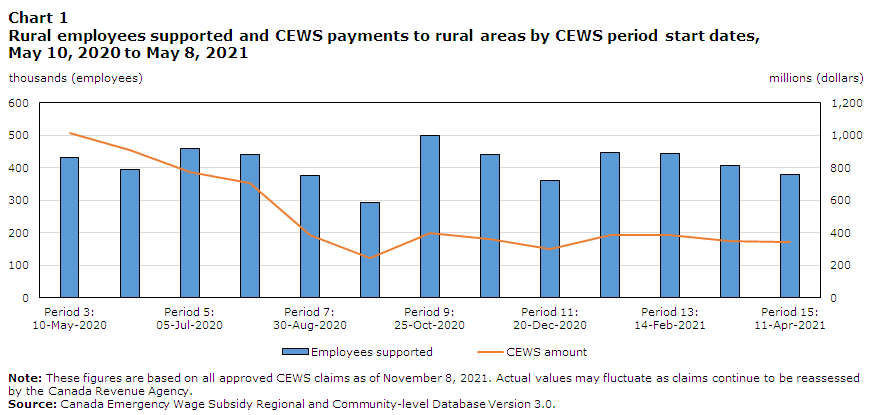
Data table for Chart 1
| Employees supported | CEWS amount | |
|---|---|---|
| employees | dollars | |
| Period 3: 10-May-2020 | 432,676 | 1,016,442,000 |
| Period 4: 07-Jun-2020 | 395,058 | 909,596,000 |
| Period 5: 05-Jul-2020 | 459,041 | 771,149,000 |
| Period 6: 02-Aug-2020 | 442,143 | 704,735,000 |
| Period 7: 30-Aug-2020 | 374,894 | 388,700,000 |
| Period 8: 27-Sep-2020 | 292,564 | 245,767,000 |
| Period 9: 25-Oct-2020 | 499,107 | 400,286,000 |
| Period 10: 22-Nov-2020 | 439,971 | 362,440,000 |
| Period 11: 20-Dec-2020 | 360,064 | 300,000,000 |
| Period 12: 17-Jan-2021 | 448,058 | 384,329,000 |
| Period 13: 14-Feb-2021 | 443,926 | 384,133,000 |
| Period 14: 14-Mar-2021 | 408,499 | 348,349,000 |
| Period 15: 11-Apr-2021 | 378,829 | 343,509,000 |
|
Note: These figures are based on all approved CEWS claims as of November 8, 2021. Actual values may fluctuate as claims continue to be reassessed by the Canada Revenue Agency. Source: Canada Emergency Wage Subsidy Regional and Community-level Database Version 3.0. |
||
One in six rural employees supported by CEWS in periods 12 to 15
The majority of industries had a smaller proportion of employees supported for periods 12 to 15 compared to the periods 9 to 11 (October 25, 2020 to January 16 2021).
On average, CEWS subsidies supported one in six (16.9%) employees in rural areas over periods 12 to 15. Some rural industries continued to request more support than others, with the share of employees receiving support being the highest in accommodation and food services (34.3%), manufacturing (28.0%) and transportation and warehousing (25.9%) (Chart 2).
Compared to the one in six employees supported by CEWS in rural areas, the program helped keep over one in five (21.2%) employees in their jobs in urban areas. Urban employees were more likely to be supported than their rural counterparts in all industries except for transportation and warehousing, agriculture, forestry, fishing and hunting, finance and insurance, and management of companies and enterprises.

Data table for Chart 2
| Periods 9 - 11 (October 25, 2020 - January 16, 2021) | Periods 12 - 15 (January 17, 2021 - May 8, 2021) | |
|---|---|---|
| percent | ||
| Accommodation and food services | 35.7 | 34.3 |
| Manufacturing | 29.4 | 28.0 |
| Transportation and warehousing | 26.0 | 25.9 |
| Arts, entertainment and recreation | 21.9 | 25.6 |
| Management of companies and enterprises | 22.7 | 21.5 |
| Mining, quarrying, and oil and gas extraction | 23.7 | 21.1 |
| Wholesale trade | 24.4 | 20.2 |
| Construction | 20.6 | 19.5 |
| Information and cultural industries | 22.5 | 18.1 |
| Real estate and rental and leasing | 14.7 | 15.4 |
| Agriculture, forestry, fishing and hunting | 15.2 | 15.4 |
| Professional, scientific and technical services | 17.7 | 15.3 |
| Retail trade | 15.3 | 14.8 |
| Administrative and support, waste management and remediation services | 12.0 | 10.7 |
| Other industries | 9.6 | 9.5 |
| Finance and insurance | 5.9 | 7.6 |
| Health care and social assistance | 6.0 | 7.0 |
| Educational services | 2.1 | 2.3 |
| Utilities | 0.9 | 0.8 |
| Source: Canada Emergency Wage Subsidy Regional and Community-level Database Version 3.0. | ||
Manufacturing had the highest share of both CEWS payments and supported employees among rural industries
Over the four CEWS periods covered by this article, manufacturing received the largest share of CEWS subsidies for rural industries, at 16.7% (Chart 3). This share was relatively unchanged from the 16.8% seen for the previous three CEWS periods.Note The next largest shares among rural industries were in construction (16.3%) and accommodation and food services (13.0%). The shares for these two industries were also relatively stable when compared to the previous three periods.
Looking at the shares of a rural industry’s employees supported by CEWS, the largest ones were in manufacturing (17.9%), accommodation and food services (16.2%), and construction (10.8%). Accommodation and food services and manufacturing also had the highest shares of employees supported in an industry in urban areas, at 14.6% and 13.0%, respectively. However, retail trade was the third most prominent industry in this respect in urban areas rather than construction, as was the case for rural areas, with a 12.4% share of supported urban employees.

Data table for Chart 3
| CEWS Amount | Employees supported | |
|---|---|---|
| percent | ||
| Manufacturing | 16.7 | 17.9 |
| Construction | 16.3 | 10.8 |
| Accommodation and food services | 13.0 | 16.2 |
| Agriculture, forestry, fishing and hunting | 7.5 | 6.2 |
| Transportation and warehousing | 7.3 | 7.2 |
| Retail trade | 5.8 | 9.9 |
| Other industries | 5.6 | 5.3 |
| Mining, quarrying, and oil and gas extraction | 5.6 | 3.8 |
| Arts, entertainment and recreation | 3.9 | 3.2 |
| Wholesale trade | 3.5 | 3.7 |
| Professional, scientific and technical services | 3.2 | 2.7 |
| Health care and social assistance | 2.9 | 5.3 |
| Management of companies and enterprises | 2.7 | 1.9 |
| Administrative and support, waste management and remediation services | 2.3 | 2.4 |
| Real estate and rental and leasing | 1.5 | 1.2 |
| Educational services | 0.8 | 0.7 |
| Information and cultural industries | 0.8 | 0.7 |
| Finance and insurance | 0.6 | 1.0 |
| Utilities | 0.1 | 0.0 |
| Source: Canada Emergency Wage Subsidy Regional and Community-level Database Version 3.0. | ||
Rural workers less likely than urban counterparts to be supported by CEWS in all but two provinces and territories
In ten provinces and territories,Note a greater share of employees in urban areas were supported by CEWS than in rural areas (Chart 4). The largest difference was in Northwest Territories, where urban employees were nearly twice as likely to have received CEWS support compared to rural employees, at 14.4% and 7.9%, respectively.
The share of employees supported varied by region. Among rural businesses, the highest shares of employees for whom CEWS helped maintain employment were in Alberta (21.3%), Quebec (20.0%) and Prince Edward Island (18.2%). In urban areas, the highest shares of supported employees were in Alberta (24.6%), Quebec (22.1%) and Ontario (21.5%).

Data table for Chart 4
| Rural businesses | Urban businesses | |
|---|---|---|
| percent | ||
| Canada | 16.9 | 21.3 |
| Newfoundland and Labrador | 12.7 | 18.4 |
| Prince Edward Island | 18.2 | 17.2 |
| Nova Scotia | 14.3 | 14.7 |
| New Brunswick | 17.3 | 17.0 |
| Quebec | 20.0 | 22.1 |
| Ontario | 15.6 | 21.5 |
| Manitoba | 11.9 | 16.9 |
| Saskatchewan | 12.7 | 18.8 |
| Alberta | 21.3 | 24.6 |
| British Columbia | 14.5 | 20.1 |
| Yukon | 8.4 | 13.0 |
| Northwest Territories | 7.9 | 14.4 |
| NunavutData table for Chart 4 Note 1 | 10.1 | Note ...: not applicable |
... not applicable
|
||
Over the four claim periods that are the focus of this article, Quebec, Ontario, and Alberta together received over two-thirds (69.8%) of all CEWS subsidies given to rural areas, at 26.7%, 20.1%, and 23.0%, respectively. The same provinces also contained over two-thirds (69.2%) of all CEWS-supported employees in rural areas over this timeframe, at 30.4% for Quebec, 19.9% for Ontario, and 18.9% for Alberta.
Methodology
Figures in this analysis are based on Canada Revenue Agency microdata files containing all approved CEWS claims up to November 8, 2021. The total amount of CEWS claims and employees supported will fluctuate compared to the microdata files used in this analysis as claims continue to be reassessed by the Canada Revenue Agency.
The Canada Emergency Wage Subsidy Regional and Community-level Database Version 3.0Note was created using Canada Revenue Agency’s Canada Emergency Wage Subsidy (CEWS) microdata and linking these with Statistics Canada’s Business Register.
Using the Standard Geographical Classification 2016 (SGC),Note these data are available at the following geographical levels: Canada, province/territory, census metropolitan area (CMA), census agglomeration (CA), and census subdivision (CSD). A rural and urban breakdown at the Canada and provincial/territorial levels was also created. CSDs outside CMA/CAs were classified as “rural”, while those inside CMA/CAs, as “urban”. The database also contains breakdowns by industry sector (2-digit NAICS) and subsector (3-digit NAICS) levels.Note
See the Canada Emergency Wage Subsidy Regional and Community-level Database Version 3.0 metadata document for more details on the database used in this analysis.Note
- Date modified: