
VISTA on the Agri-food Industry and the Farm Community
Impacts of the drought on crop quality indicators
Text begins
Recent crop reports from Western Canada have described the effects of record-high temperatures and lack of rainfall that have stressed crops. These reports indicate that some crops have matured faster than normal, or stagnated in their development. The longer these conditions persist, the greater the negative impact will be on crop and hay yields, grain quality and ultimately, farm cash receipts.
In mid-July, the Alberta government reported that 36.6% of the crops were in good to excellent condition compared with the five-year average of 74.1%. Saskatchewan Agriculture and Food reported that the majority of the crops were rated in poor to good condition. Manitoba Agriculture-Food and Rural Initiatives reported that topsoil moisture continued to decline, with crop, hay and pasture conditions all deteriorating at the same time. The first cut of hay in Manitoba was completed with little expectation of a second cut in most parts of the province unless significant rains arrive, coupled with cooler temperatures.
Weather and soil moisture conditions vary across Western Canada
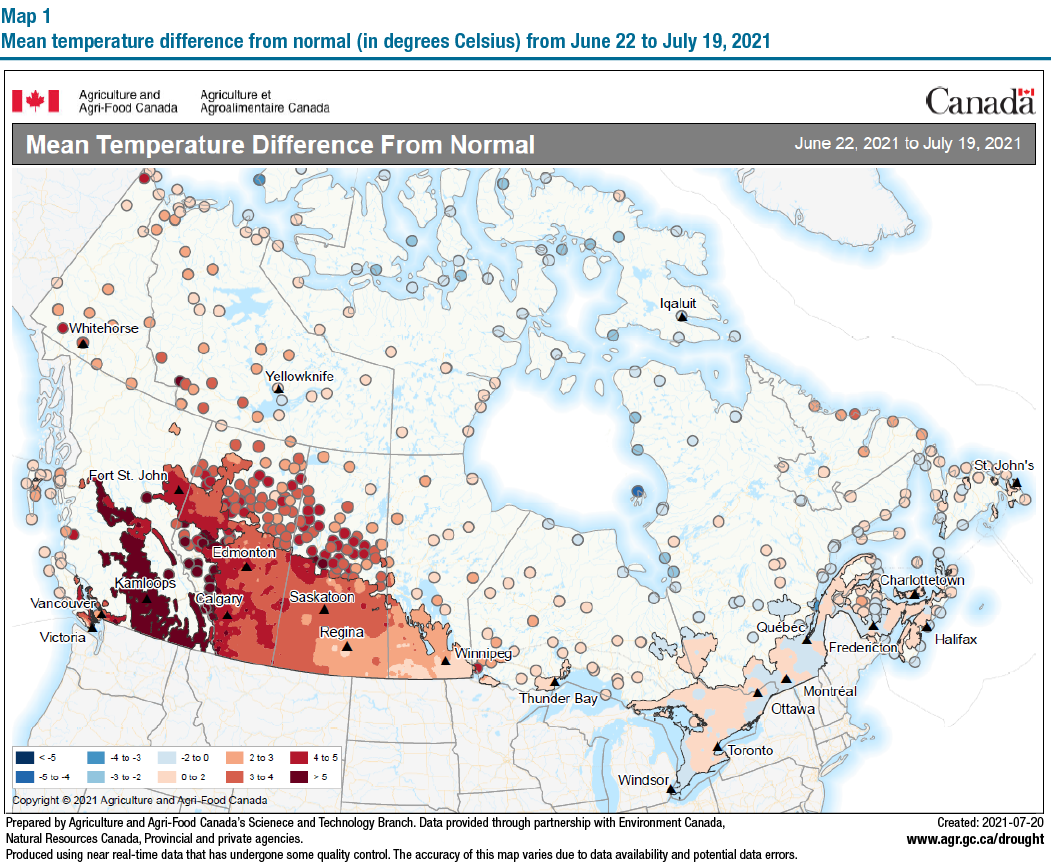
A large proportion of crop production in Canada occurs on the Prairies where farmers have faced challenging weather and soil moisture conditions so far this year. Western Canada experienced above-average temperatures for the last month that progressively intensified from Manitoba through to British Columbia (Map 1).
Description for Map 1
The title of the map is "Mean temperature difference from normal (in degrees Celsius) from June 22 to July 19, 2021."
This map shows temperature difference from the normal that progressively intensified from Manitoba (0 to +2°C) through to British Columbia (more than +5°C) while Eastern Canada experienced temperatures ranging from +/- 2°C from normal.
Prepared by Agriculture and Agri-Food Canada’s Science and Technology Branch. Data provided through partnership with Environment Canada, Natural Resources Canada, and provincial and private agencies. Produced using near real-time data that has undergone some quality control. The accuracy of this map varies due to data availability and potential data errors.
Created 2021-07-21 (www.agr.gc.gc/drought)
Since April 1, most of the Prairies received from 40% to 85% of average precipitation since the beginning of the growing season, while the interior of British Columbia has received less than 40% of average precipitation (Map 2).

Description for Map 2
The title of the map is "Percent of average precipitation from April 1 to July 26, 2021 (during the growing season), by province."
This map shows that precipitation ranged from below 40% to 85% of average for most of Western Canada. In Eastern Canada, precipitation was below average from Ottawa to Quebec.
Prepared by Agriculture and Agri-Food Canada’s Science and Technology Branch. Data provided through partnership with Environment Canada, Natural Resources Canada, and provincial and private agencies. Produced using near real-time data that has undergone some quality control. The accuracy of this map varies due to data availability and potential data errors.
Created 2021-07-21 (www.agr.gc.gc/drought)
The concern expressed by many farm operators is that the current drought conditions have hit at the worst time of crop development. In canola, for example, flowering can become heat stressed beyond 30°C which can lead to smaller or aborted pods, fewer seeds per pod and ultimately lower yields.
How Statistics Canada monitors the impact of the drought on crop development
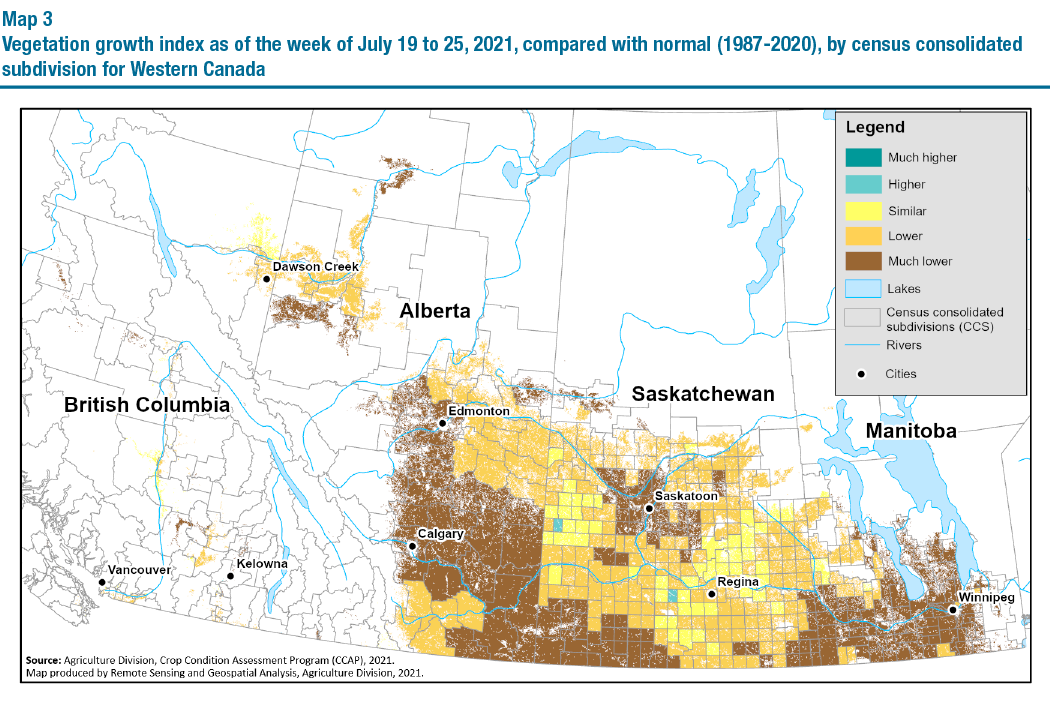
Statistics Canada monitors crop conditions on a weekly basis using coarse resolution satellite imagery as part of the Crop Condition Assessment Program (CCAP), which is funded by Agriculture and Agri-Food Canada. The CCAP uses the Normalized Difference Vegetation Index (NDVI) to monitor changing crop and pasture conditions. Based on the NDVI, for the week of July 19 to 25, 2021, growing conditions are lower to much lower for most of the Prairies and British Columbia compared with normal (Map 3).
Description for Map 3
The title of the map is "Vegetation growth index as of the week of July 19 to 25, 2021 compared with normal (1987-2020), by census consolidated subdivision for Western Canada."
The map shows Crop Condition Assessment Program data as of the week of July 19 to 25, 2021, comparing the Normalized Difference Vegetation Index in Western Canada with normal. Growing conditions are lower to much lower for most of the Prairies and British Columbia compared with normal.
Source: Agriculture Division, Crop Condition Assessment Program (CCAP), 2021. Map produced by Remote Sensing and Geospatial Analysis, Agriculture Division, 2021.
With the CCAP, the geographic extent of crop conditions and the degree of change by region can be compared with the normal for any region of Canada. When the current NDVI value is higher than the average, crops are greener with higher leaf volume, and when the NDVI value is below the average, crops are less green and have lower leaf volume.
For example, crop conditions in the regions south of Calgary are below last year and below the long-term average, indicating that the drought is now having an impact on the quality of crops in that area (Infographic 1). A similar situation can be found for many other regions of Western Canada.

Data table for Chart 1
| Julian week | Normalized Difference Vegetation Index | ||
|---|---|---|---|
| 2020 | 2021 | Normal | |
| 15 | 0.0 | 0.1 | 0.1 |
| 16 | 0.0 | 0.1 | 0.1 |
| 17 | 0.0 | 0.1 | 0.2 |
| 18 | 0.1 | 0.2 | 0.2 |
| 19 | 0.2 | 0.2 | 0.2 |
| 20 | 0.2 | 0.3 | 0.3 |
| 21 | 0.3 | 0.3 | 0.3 |
| 22 | 0.4 | 0.4 | 0.4 |
| 23 | 0.4 | 0.4 | 0.4 |
| 24 | 0.5 | 0.5 | 0.5 |
| 25 | 0.6 | 0.5 | 0.5 |
| 26 | 0.6 | 0.5 | 0.6 |
| 27 | 0.7 | 0.5 | 0.6 |
| 28 | 0.7 | 0.5 | 0.6 |
| 29 | 0.7 | Note ...: not applicable | 0.6 |
| 30 | 0.6 | Note ...: not applicable | 0.6 |
| 31 | 0.6 | Note ...: not applicable | 0.5 |
| 32 | 0.6 | Note ...: not applicable | 0.5 |
| 33 | 0.5 | Note ...: not applicable | 0.5 |
| 34 | 0.4 | Note ...: not applicable | 0.5 |
| 35 | 0.4 | Note ...: not applicable | 0.4 |
| 36 | 0.3 | Note ...: not applicable | 0.4 |
| 37 | 0.3 | Note ...: not applicable | 0.4 |
| 38 | 0.2 | Note ...: not applicable | 0.3 |
| 39 | 0.2 | Note ...: not applicable | 0.3 |
| 40 | 0.1 | Note ...: not applicable | 0.3 |
| 41 | 0.1 | Note ...: not applicable | 0.2 |
|
... not applicable Note: Normalized Difference Vegetation Index for crops and pasture. Graph results for CCS Region Foothills No. 31, (CCS4806001), Alberta. Source: Normalized Difference Vegetation Index. |
|||
However, it is important to note that not every region is experiencing the same impact, and conditions may still change in the coming months.
For some regions, crop conditions in 2021 are similar to those during the 2002 drought
How bad are current crop conditions this year compared with 2002, the last time severe drought conditions affected crops in parts of Western Canada?
According to the NDVI, the crop conditions this year are equivalent to or lower than 2002 in the extreme southwestern part of Saskatchewan and southern Alberta.
In Eastern Canada, NDVI values for 2021 are similar to the normal from Ottawa to Montréal, lower than normal from Trois-Rivières to Québec, but lower to much lower than normal for the Niagara Falls–Port Huron–Owen Sound region of Ontario. The Maritimes are, for the most part, experiencing a normal year based on the NDVI values.
Despite the heat and lack of rain in parts of the country, the situation could still improve if cooler temperatures and rain come in time to mitigate the decline in yields and quality.
On August 30, Statistics Canada will release estimates on the production of principal field crops, which will provide a more comprehensive overview of the impact of the drought on Canadian crops in 2021.
Start of text boxNote to readers
The Crop Condition Assessment Program (CCAP) is updated every week with the latest Normalized Difference Vegetation Index (NDVI) composites and value-added products throughout the growing season.
The scientifically documented methodology used to create the weekly NDVI composites retains the highest measure from the seven days of satellite imagery. In times of declining conditions, the full effect of the decline will be muted, or, delayed until the next weekly composite is processed. The NDVI is an effective tool for monitoring crop conditions, but, it is one of many tools used by everyone who diligently monitors the weather events throughout the growing season, especially when conditions vary regionally. It is important to use the NDVI maps and the NDVI graphs in tandem to properly assess the differences between the comparison years.
On August 30, 2021, Statistics Canada will release modelled yield and production estimates for field crops in Canada based on data up to the end of July. Model-based principal field crop estimates are calculated according to an approach developed by Statistics Canada in close partnership with Agriculture and Agri-Food Canada. These yield estimates are based on a model that incorporates coarse resolution satellite data from Statistics Canada's Crop Condition Assessment Program, data from Statistics Canada's field crop reporting series, and agroclimatic data.
A methodology report describing the yield model used at Statistics Canada is available online. For more information regarding the yield model, please visit An Integrated Crop Yield Model Using Remote Sensing, Agroclimatic Data and Crop Insurance Data.
- Date modified: