
VISTA on the Agri-food Industry and the Farm Community
A Statistical Glance at the Recent History of Farm Income

Archived Content
Information identified as archived is provided for reference, research or recordkeeping purposes. It is not subject to the Government of Canada Web Standards and has not been altered or updated since it was archived. Please "contact us" to request a format other than those available.
by Brian Biggs

Skip to text
Introduction
Canadian agriculture is currently facing several challenges including restricted access for canola and meat exports to China as well as uncertainty surrounding the commercial trade war between the United States and China and its impact on commodity prices. The impacts of events such as these and others will be reflected in farm cash receipt and net farm income figures for 2019Note . To provide context, this article takes a look back at changes in realized net income over the 2008 to 2018 period, emphasizing the time frame starting from 2011, and examines some of the major factors driving these changes.
Over the course of ten years of realized net income changes during the 2008 to 2018 period, there have been ups and downs with a marked decline in 2018 leaving realized net income (in constant dollars) little changed from 2008.Note For much of the period, realized net income was well above these levels benefitting from spells of higher crop and livestock prices, at times buttressed by a lower Canadian dollar, record crop production, historically low interest rates and brief periods of declining energy prices.
Aggregate net farm income statistics measure earnings gained from agricultural production and are one type of indicators used by policymakers in assessing economic conditions in the farm sector. What follows is a brief overview of the movement of one of these measures in Canada across the 2008 to 2018 period. The focus will be on realized net income which adjusts the difference of cash receipts and operating expenses by adding income in kind and subtracting depreciation charges. As such it is a measure of farm business income not farm household income.
Other farm income measures include net cash income and total net income.
This paper breaks down this time frame into three periods: the upturn from 2011 to 2014, a period of steady, higher incomes from 2014 to 2018 and a sharp decline in income in 2018.

Data table for Chart 1
| Year | Realized net farm income |
|---|---|
| constant 2012 dollars |
|
| 2008 | 3.9 |
| 2009 | 3.3 |
| 2010 | 3.7 |
| 2011 | 5.7 |
| 2012 | 6.5 |
| 2013 | 6.1 |
| 2014 | 6.9 |
| 2015 | 7.1 |
| 2016 | 7.1 |
| 2017 | 6.7 |
| 2018 | 3.6 |
| Sources: Statistics Canada Tables: 32-10-0052-01, 36-10-0206-01. | |
2011 – The launching point of elevated incomes
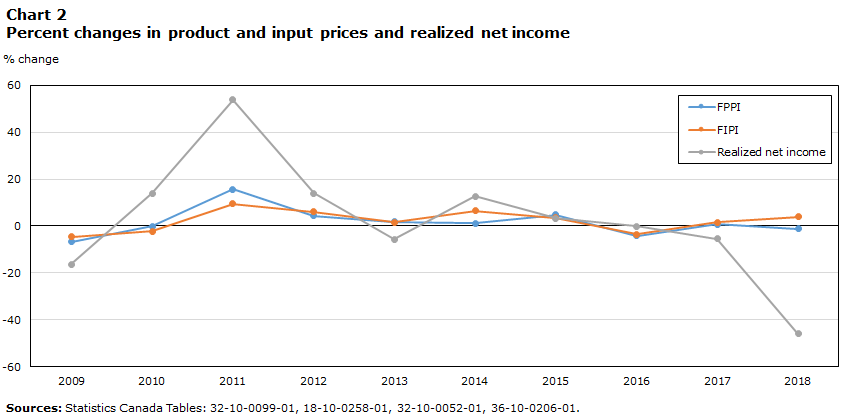
While farm income increased in 2010, the springboard for this period of elevated farm incomes was 2011 as many commodity prices were on the rise, in part, due to increased demand from emerging market countries such as China. This commodity boom affected the prices of both outputs and inputs but had an especially strong positive impact on farm commodity prices which lifted farmers’ cash receipts at a more robust rate than input expenses
This is evident in the movement of the Farm Product Price Index (FPPI) which measures changes in prices received by farmers from the sale of agricultural products. In 2011, the index jumped 15.7% - the largest annual increase since its inception in 1981 – with both crop and livestock indexes posting strong gains (18.8% and 12.2% respectively). On the other side of the ledger, farm input prices as measured by the Farm Input Price Index (FIPI) rose 9.5%. The difference between the two (6.2%) was the highest in the period in question and contributed to the largest annual spike in realized net income (+53.8%) in the 2009 to 2018 time frame.
Data table for Chart 2
| Year | FPPI | FIPI | Realized net income |
|---|---|---|---|
| % change | |||
| 2009 | -6.7 | -4.7 | -16.2 |
| 2010 | -0.2 | -2.4 | 13.9 |
| 2011 | 15.7 | 9.5 | 53.8 |
| 2012 | 4.4 | 6.0 | 13.9 |
| 2013 | 1.7 | 1.6 | -5.6 |
| 2014 | 1.2 | 6.5 | 12.6 |
| 2015 | 4.7 | 3.5 | 3.3 |
| 2016 | -4.1 | -3.6 | -0.2 |
| 2017 | 0.8 | 1.6 | -5.5 |
| 2018 | -1.2 | 3.8 | -46.0 |
| Sources: Statistics Canada Tables: 32-10-0099-01, 18-10-0258-01, 32-10-0052-01, 36-10-0206-01. | |||
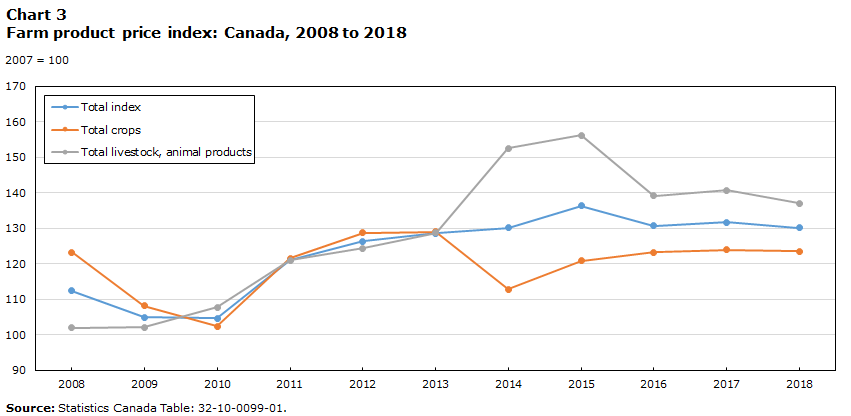
Higher cattle prices support net income growth in 2011 and beyond
While there was stronger growth in grain and oilseed prices in 2011, there was a noteworthy 18.6% jump in the cattle and calf FPPI – at that date the largest increase in that component since the FPPI was first published in 1981.Note Higher feed grain prices and tight supplies contributed to the price hike. The oversupply of market animals resulting from closing of international borders to Canadian live cattle and beef due to the discovery of Bovine Spongiform Encephalopathy (BSE) in an Alberta cow in 2003 had, by 2011, transformed into price-boosting shortages.Note There were also sharp increases in cattle and calf prices in 2014 and 2015 which helped keep receipts and net income on the rise. Cattle and calf prices reached their peak in 2015 but remained at comparatively high levels afterwards.
The number of cattle (excluding dairy cows) by the end of 2018 was 13.2% less than the level at the end of 2008 as the cattle industry adapted to a new normal in part formed by declining domestic consumer demand for beef. Availability of beef for consumption on a per person basis fell 15.5% from 2008 to 2018. Over this same period, cattle and calf receipts rose 38.9% as prices jumped 72.5%.
Data table for Chart 3
| Year | Total index | Total crops | Total livestock, animal products |
|---|---|---|---|
| 2007 = 100 | |||
| 2008 | 112.4 | 123.2 | 102.0 |
| 2009 | 104.9 | 108.2 | 102.1 |
| 2010 | 104.7 | 102.4 | 107.8 |
| 2011 | 121.1 | 121.6 | 121.0 |
| 2012 | 126.4 | 128.7 | 124.4 |
| 2013 | 128.6 | 129.1 | 128.8 |
| 2014 | 130.2 | 112.9 | 152.6 |
| 2015 | 136.3 | 120.8 | 156.2 |
| 2016 | 130.7 | 123.2 | 139.2 |
| 2017 | 131.7 | 123.9 | 140.7 |
| 2018 | 130.1 | 123.6 | 137.1 |
|
Source: Statistics Canada Table: 32-10-0099-01. |
|||
2014-2017: Stable, above average net incomes supported by rising lentil receipts, lower Canadian dollar
The peak in realized net income occurred in 2015 at $7.15 billion (in 2012 dollars) – 25.0% above the 2011 figure but within 7% of the levels recorded from 2014 to 2017. During this period of reasonably stable, above average realized net incomes, product and input price gains had weakened from the 2011 rates – indeed both the FPPI and FIPI recorded decreases in 2016. This stability was evident in small changes in both farm cash receipts and operating expenses with the average annual growth rates for 2014 through 2017 being 2.8% and 2.5% respectively.
One reason for the stability of farm incomes was record field crop production in 2013 which contributed to a boost in marketings in 2014 – a year in which grain and oilseed prices fell by close to 20%. The rise in marketings offset much of the negative impact of lower prices on crop receipts. Production subsequently remained above pre-2013 levels as higher than average yields for most crops continued.
Also supporting crop production levels during the 2008 to 2018 period was the conversion of non-productive farmland (e.g., summerfallow, pasture) into productive cropland. Summerfallow acres fell by just over 70% during this timeframe. Crop receipts were also enhanced by the replacement of hay acres with acres of more highly valued crops.
It was also during this period of constancy in the aggregate figures that saw the rise and fall of the significance of lentils in the national farm cash receipt estimates. Lentils are a pulse crop grown largely in Saskatchewan and are an integral part of the diet of the population of the Indian subcontinent. Poor growing conditions in India boosted demand for Canadian exports, more than doubling receipts in 2015 as prices jumped 58.0% and quantities sold rose 33.2%. This resulted in lentils attaining a 7.0% share of crop receipts in 2015 – a record. (Its average share of crop receipts was 3.5% during the 2008-2018 period.) Lentil receipts were down slightly in 2016 before plunging 46.0% in 2017 and 35.1% in 2018 as export markets severely weakened with a return to better harvests in India and the imposition of import duties by the Indian government in late 2017.
Aside from lentils providing a short-lived boost to receipts, a depreciated Canadian dollar supported the prices received by Canadian agricultural producers over this period of little change in realized net income. World prices are expressed in US dollars meaning the depreciation of the Canadian dollar increases prices paid to producers for exports and for commodities priced in the US futures markets. This was especially evident in 2015 when a weaker dollar aided Canadian agricultural producers to largely avoid the sharp global price declines for grains and oilseeds that US farmers experienced.

Data table for Chart 4
| Year | US dollar in CAN dollars |
|---|---|
| 2008 | 1.1 |
| 2009 | 1.1 |
| 2010 | 1.0 |
| 2011 | 1.0 |
| 2012 | 1.0 |
| 2013 | 1.0 |
| 2014 | 1.1 |
| 2015 | 1.3 |
| 2016 | 1.3 |
| 2017 | 1.3 |
| 2018 | 1.3 |
| Source: Statistics Canada Table: 32-10-0099-01. | |
The downturn of 2018
1) Little change in receipts in 2018 as decreasing canola and hog receipts and program payments largely offset the growth in wheat, cannabis and supply-managed commodity receipts.
This period of stable, above average farm incomes came to an end in 2018 with a 46.0% drop in realized net income (in constant 2012 dollars) – the result of little change in receipts and rising expenses. Prices again played a role as product prices, as measured by the FPPI, decreased 1.2% while input prices climbed 3.8% according to the FIPI.
As was the case throughout the 2008 to 2018 period, canola receipts had a significant impact on farm cash receipts and net income in 2018. The 6.5% drop was only the second decrease recorded during this period and was the largest drag on crop receipt growth in 2018. Prices were steady but marketings or quantities sold in Alberta, the second largest producer, fell sharply as a consequence of rail disruptions, a delayed harvest and lower production.Note
Over the 2008 to 2018 period canola comprised, on average, just over one-quarter of crop receipts (25.5%) – ranging from 21.4% in 2008 to 29.4% in 2011. Canola was the highest selling crop throughout the period as production soared 60.9% in response to robust export and domestic demand. Canola exports (in tonnes) surged 57.4% as exports to China more than tripled (+232.8%). By 2018, China accounted for almost half of canola exports (46.7%), up from 22.1% in 2008. Investment in plant construction more than doubled crush capacity, resulting in similar growth in the amount of canola crushed during this period (120.2 %). Its high oil content and perceived coronary health benefits – low in saturated fats, high in monounsaturated fats - together with it providing a high protein meal for animal feed has aided its popularity.
| 2008 | 2009 | 2010 | 2011 | 2012 | 2013 | 2014 | 2015 | 2016 | 2017 | 2018 | |
|---|---|---|---|---|---|---|---|---|---|---|---|
| percent | |||||||||||
| Wheat (except durum wheat) | 15.5 | 14.1 | 11.2 | 13.7 | 14.3 | 16.8 | 15.8 | 15.5 | 13.1 | 14.6 | 16.2 |
| Canola (including rapeseed) | 21.4 | 22.0 | 24.8 | 29.4 | 27.7 | 23.4 | 24.1 | 24.9 | 27.0 | 28.7 | 26.6 |
| Oats | 2.5 | 1.6 | 1.8 | 2.0 | 1.8 | 1.7 | 1.5 | 1.6 | 1.4 | 1.3 | 1.4 |
| Barley | 3.7 | 3.2 | 2.1 | 2.3 | 2.6 | 3.3 | 2.5 | 2.5 | 2.0 | 2.0 | 2.4 |
| Soybeans | 4.9 | 5.8 | 6.9 | 6.0 | 8.0 | 8.2 | 7.8 | 7.6 | 8.7 | 8.5 | 8.7 |
| Corn for grain | 6.8 | 5.7 | 7.0 | 8.0 | 8.2 | 7.5 | 6.5 | 5.8 | 6.0 | 5.9 | 6.5 |
| Lentils | 2.6 | 3.7 | 3.2 | 2.5 | 1.8 | 2.7 | 3.5 | 7.0 | 5.8 | 3.1 | 2.0 |
| Total fresh vegetables | 8.0 | 8.8 | 9.9 | 9.0 | 8.1 | 8.4 | 9.0 | 8.9 | 8.8 | 9.1 | 9.4 |
| Total fresh fruit | 3.3 | 2.9 | 3.0 | 3.1 | 2.9 | 2.8 | 3.1 | 3.1 | 3.1 | 3.1 | 3.3 |
| Floriculture and nursery products, and sod | 7.2 | 7.4 | 7.9 | 6.8 | 6.0 | 5.8 | 6.1 | 6.0 | 5.2 | 5.1 | 5.2 |
| Other Crop Receipts | 24.2 | 24.8 | 22.2 | 17.1 | 18.5 | 19.5 | 20.0 | 17.1 | 18.8 | 18.4 | 18.4 |
| Sum of above | 100.0 | 100.0 | 100.0 | 100.0 | 100.0 | 100.0 | 100.0 | 100.0 | 100.0 | 100.0 | 100.0 |
| Source: Statistics Canada Table 32-10-0045-01 | |||||||||||
Wheat (excluding durum) was still an important revenue generator throughout the 2008 to 2018 period despite being replaced by canola as the king of crops in terms of seeded area in 2011. In 2018, revenue from wheat (excluding durum) production posted its second consecutive double-digit percentage increase, partially offsetting the drop in canola receipts. Both prices and marketings were up as exports to China almost tripled.Note Over the course of the 2008 to 2018 time frame, wheat (excluding durum) receipts rose 58.5% accounting for 17.4% of the growth in crop receipts.
Soybean receipts accounted for a similar share of crop receipt growth (16.1%) over the 2008 to 2018 period, increasing 171.6% based on a surge in marketings (+154.9%). Area seeded doubled as new varieties better suited to the growing conditions of the Prairies were introduced. In eight of the ten years, increases were recorded for soybean receipts including 2018 (+3.2%).
Receipts of licenced producers of cannabis, introduced in 2016, began to have a notable impact on national estimates in 2018. Cannabis receipts nearly tripled in 2018 as recreational use becoming legal in October of that year.Note Despite this growth which contributed to the small rise in crop receipts, cannabis accounted for only 1.6% of crop receipts and 0.9% of farm cash receipts in 2018.
| 2008 | 2009 | 2010 | 2011 | 2012 | 2013 | 2014 | 2015 | 2016 | 2017 | 2018 | |
|---|---|---|---|---|---|---|---|---|---|---|---|
| percent | |||||||||||
| Cattle and calves | 34.5 | 32.5 | 32.6 | 30.8 | 31.4 | 31.7 | 38.2 | 41.0 | 36.7 | 36.1 | 36.3 |
| Hogs | 16.9 | 16.0 | 17.9 | 19.4 | 18.4 | 18.9 | 19.9 | 16.5 | 17.2 | 18.0 | 16.4 |
| Total supply managed | 44.5 | 47.4 | 45.2 | 45.5 | 45.6 | 45.0 | 38.1 | 38.4 | 42.4 | 42.3 | 43.6 |
| Other livestock | 4.1 | 4.0 | 4.3 | 4.3 | 4.5 | 4.5 | 3.7 | 4.1 | 3.8 | 3.6 | 3.7 |
| Sum of above | 100.0 | 100.0 | 100.0 | 100.0 | 100.0 | 100.0 | 100.0 | 100.0 | 100.0 | 100.0 | 100.0 |
| Source: Statistics Canada Table 32-10-0045-01 | |||||||||||
Hog receipts fell 8.9% in 2018, keeping livestock receipts little changed from 2017. Lower prices accompanied record high North American inventory levels. Inventories started to grow in the latter part of 2014, recovering from the losses incurred from porcine epidemic diarrhea virus (PEDV) outbreaks in the United States. The inventory growth continued until the end of 2018. Prior to 2018, rising pork exports helped to mitigate the downward pressure of these large inventories on prices. The export growth ended in 2018 with retaliatory pork tariffs imposed on the United States by China and Mexico. Over the fluctuations of the 2008 to 2018 period where hog receipts rose in six of the ten years, there was a 28.9% price-driven rise in hog receipts.
A 2.8% increase in supply-managed receipts in 2018 moderated the drop in livestock receipts largely thanks to 5.9% and 6.5% gains in chicken and egg receipts respectively. During the 2008 to 2018 time frame, supply-managed receipts showed less volatility than hog sales, increasing in nine of the ten years. The dairy sector contributed over 50% of the ten-year rise but small price decreases in three of the last four years of this period muted its receipt growth. Milk prices were negatively influenced by lower world prices as greater access to imports was granted for new popular milk products such as ultrafiltered milk.

Data table for Chart 5
| Year | Crop | Livestock | Total direct payments |
|---|---|---|---|
| % of total farm cash receipts |
|||
| 2008 | 50.0 | 41.1 | 9.0 |
| 2009 | 52.1 | 40.5 | 7.4 |
| 2010 | 50.4 | 42.5 | 7.1 |
| 2011 | 52.3 | 40.8 | 7.0 |
| 2012 | 55.2 | 38.5 | 6.3 |
| 2013 | 56.4 | 38.7 | 4.8 |
| 2014 | 52.4 | 44.0 | 3.6 |
| 2015 | 53.8 | 42.6 | 3.6 |
| 2016 | 56.6 | 39.4 | 4.0 |
| 2017 | 55.8 | 40.3 | 3.9 |
| 2018 | 56.2 | 40.2 | 3.6 |
| Source: Statistics Canada Table: 32-10-0099-01. | |||
Direct payment to producers fell 8.9% in 2018 providing another brake on receipt growth. These program payments declined in importance throughout much of the period, falling from 9.0% of farm cash receipts in 2008 to 3.6% in 2018. Much of the decline during this period can be traced to reduced stabilization programs, in part due to historically high levels of net income.
2) Rising expenses in 2018.
While there was little change in total farm cash receipts in 2018, this was not the case for total farm expenses which rose 5.9%, the largest annual increase since 2012 (+7.9%). A confluence of factors – tight feed supplies, rising interest rates and farm debt, higher energy costs as well as a spike in cash wages contributed to the increase.

Data table for Chart 6
| Year | Farm input total | Crop production | Animal production |
|---|---|---|---|
| 2007 = 100 | |||
| 2008 | 113.5 | 125.3 | 110.0 |
| 2009 | 108.2 | 123.2 | 109.1 |
| 2010 | 105.6 | 112.2 | 107.6 |
| 2011 | 115.7 | 120.1 | 122.2 |
| 2012 | 122.6 | 128.9 | 132.8 |
| 2013 | 124.5 | 127.0 | 134.6 |
| 2014 | 132.6 | 130.8 | 152.4 |
| 2015 | 137.3 | 132.8 | 163.8 |
| 2016 | 132.4 | 130.0 | 145.5 |
| 2017 | 134.5 | 130.5 | 146.8 |
| 2018 | 139.7 | 134.2 | 152.0 |
| Source: Statistics Canada Table: 32-10-0099-01. | |||
A longer-term view of farm expenses
For the 2008 to 2018 period, total farm expenses which include both operating costs and depreciation changes increased 37.9%. The price index associated with the total farm expense concept, the Farm Input Price Index (FIPI) was up 23.0%. While the price component was a major factor, other elements, such as crop selection, played a role in the growth of expenses over this time frame.
Since 2008, the largest contributors to the rise in total expenses are machinery depreciation, wages, feed, fertilizer and seed. Machinery depreciation costs which includes those for equipment and vehicle depreciation rose 54.0% - similar to the increase in the value of these assets (54.1%). Larger farms encouraged purchases of larger, more expensive machinery while the widespread adoption of land management practices such as no till required investment in specialized machinery. Another factor in the increase in machinery value and subsequent depreciation was a growing information technology component to machinery, from robotic milking systems to crop machinery equipped with global positioning systems.
Since 2008, the Labour Force Survey recorded a 39.4% hike in the average hourly wage rate for those whose main job was coded to the agricultural sector, which roughly corresponded to the 44.9% rise in wage expenses over the 2008 to 2018 period. Aside from the factors underlying the 2018 jump in wage expenses (e.g., higher minimum wages, greater cannabis production in some provinces), also positively impacting the estimate over the period in question was the continuation of the longstanding trend towards incorporation. This allows managerial and supervisory services of the operators to be recorded as wages instead of part of the operating surplus of unincorporated farms.
The 9.6% rise in 2018 resulted in commercial feed becoming a top contributor to total expense growth for the 2008 to 2018 period. The commercial feed expense estimate increased 27.1% as commercial feed prices rose 14.2% according to the FIPI and supply-managed marketings exhibited strong growth (over 20%) during this period supporting the level of feed quantities used.
The 36.0% growth in fertilizer expenses occurred despite lower prices in 2018 compared to 2008. Fertilizer shipments by major manufacturers, wholesale distributors and major retail distributors to Canadian agriculture markets suggested a sharp rise in usage, growing by over 60%. According to some crop production guides, fertilizer costs per acre for canola are close to 50% above those for barley and oats.Note Canola acres jumped 41% over this period.
Commercial seed costs almost doubled during the 2008 to 2018 period (+92.5%). There was a 45.1% jump in the commercial seed FIPI as higher grain and oilseed prices were reflected in seed prices. Also contributing to hike in seed expenses was the replacement of seeded acres of hay, summerfallow, barley and oats by higher cost crops such as canola, soybeans, lentils and corn.
One other notable increase was the 88.7% hike in rent expenses. The principal cause was a near tripling of bare farmland values per acre (+194.7%) over the 2008 to 2018 period according to the Farmland Values Report compiled by Farm Credit Canada.
Concluding Remarks
Preliminary figures indicate that the 2018 drop left realized net income in constant dollars at similar levels to those recorded for the 2008 to 2010 period – indeed within 1% of the three-year average over that time frame. If these preliminary figures are proven to be reasonably accurate, the 2018 decline will mark the end of a seven-year period of above-average net realized incomes (2011 – 2017).
- Date modified: