
Statistical Methods Reference Documents
Advance indicators: Production, use and interpretation, 2026
Text begins
This article provides nontechnical answers to questions related to the production, use and interpretation of advance indicators for Statistics Canada’s Monthly Survey of Manufacturing, Monthly Wholesale Trade Survey and Monthly Retail Trade Survey. This reference document complements the technical documentation on definitions, data sources and methods available for individual programs. It is composed of two sections. Section 1 reviews concepts and definitions that are central to the production of advance indicators, while Section 2 relates to the analysis and interpretation of these special statistical products.
Section 1: Context, definitions and terminology
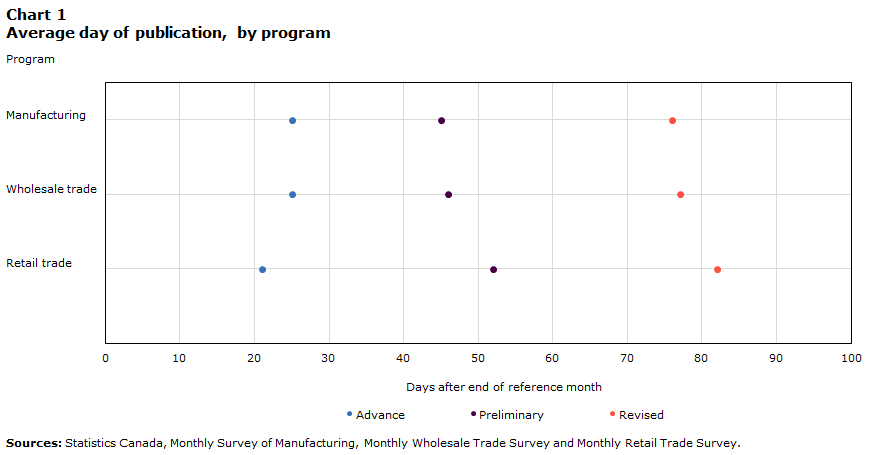
Advance indicators are statistical estimates designed to provide early information on economic activities for a given reference period. For the surveys listed above, advance indicators are generated when information for a portion of respondents has been received but data collection is still underway. Advance indicators for monthly manufacturing, wholesale trade and retail trade are typically published 21 to 25 days after the end of a reference month, while preliminary indicators are published approximately one month later. For example, the monthly retail advance indicator for the January reference month would be published in February (21 to 25 days after), while the preliminary indicator for January would be published in March (one month later). Therefore, a February publication would showcase a preliminary indicator for December, as well as an advance indicator for January.
Chart 1 shows the average number of days to publish advance, preliminary and revised indicators for the three programs following the end of the reference month.
Data table for Chart 1
| Program | Advance | Preliminary | Revised |
|---|---|---|---|
| percent | |||
| Sources: Statistics Canada, Monthly Survey of Manufacturing, Monthly Wholesale Trade Survey and Monthly Retail Trade Survey. | |||
| Manufacturing | 25 | 45 | 76 |
| Wholesale trade | 25 | 46 | 77 |
| Retail trade | 21 | 52 | 82 |
Rationale for publication
Statistics Canada first published advance indicators in 2020. This work was done primarily to provide users with more timely information, given the economic uncertainty that arose from the COVID-19 pandemic. Demand was high for advance indicators to monitor the economic impacts of the pandemic in different areas of the Canadian economy and to provide early signals and information about the direction of trends. By using early respondent data, Statistics Canada was able to compile timely and reliable economic signals based on observed data. Table 1 indicates the reference month of the first release of the advance indicators according to the statistical program.
| Program | Reference month of first release of advance indicator |
|---|---|
| Sources: Statistics Canada, Monthly Survey of Manufacturing, Monthly Wholesale Trade Survey and Monthly Retail Trade Survey. | |
| Monthly Retail Trade Survey | April 2020 |
| Monthly Survey of Manufacturing | May 2020 |
| Monthly Wholesale Trade Survey | August 2020 |
Flash estimation technique
Statistics Canada uses a technique called flash estimation to produce advance indicators for selected survey programs. Flash estimation refers to a type of advance indicator that uses the same methods used to produce preliminary indicators, but these methods are applied to a more limited dataset, at an earlier point in time. For example, to produce the advance retail trade indicator, only responses that have been received by a predetermined point in the collection period are used. Once collection is complete, the same non-response treatments and weighting methods are used on the full set of received data, which is then used to produce the preliminary indicator.
The amount of collected data incorporated into an advance indicator varies from month-to-month and across surveys. Table 2 shows that in 2025, the average response rates for advance indicators (rounded to the nearest percentage point) were 67% for the Monthly Survey of Manufacturing, 63% for the Monthly Wholesale Trade Survey and 57% for the Monthly Retail Trade Survey. These response rates are typically published along with each advance indicator to provide users with information on the quality of that month’s figure.
| Program | Advance indicator | Preliminary indicator | Revised indicator |
|---|---|---|---|
| percent | |||
| Sources: Statistics Canada, Monthly Survey of Manufacturing, Monthly Wholesale Trade Survey and Monthly Retail Trade Survey. | |||
| Manufacturing | 67 | 86 | 89 |
| Wholesale trade | 63 | 82 | 87 |
| Retail trade | 57 | 84 | 87 |
The monthly gross domestic product (GDP) by industry program uses the advance indicators discussed in this article to compile its own advance indicators of GDP. More information on estimates of monthly GDP can be found in Revisions to Canada’s GDP.
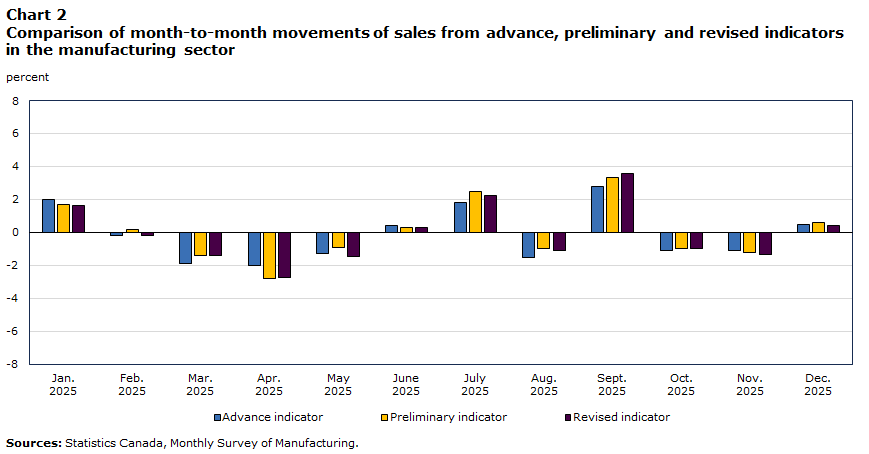
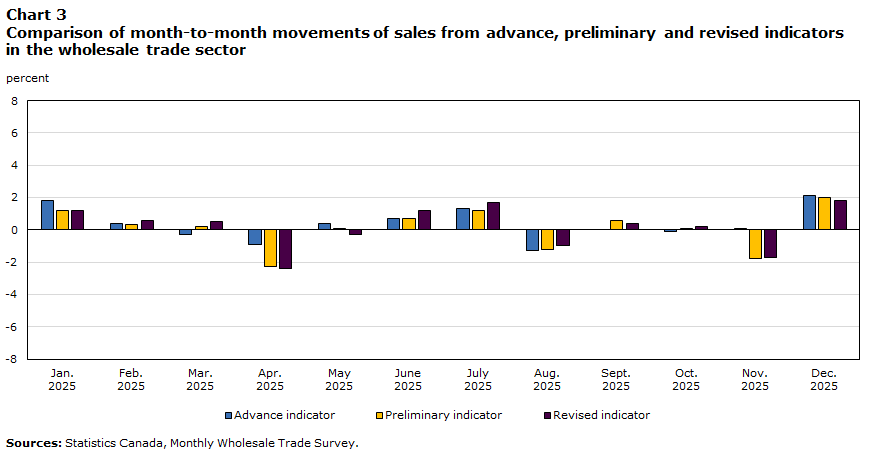
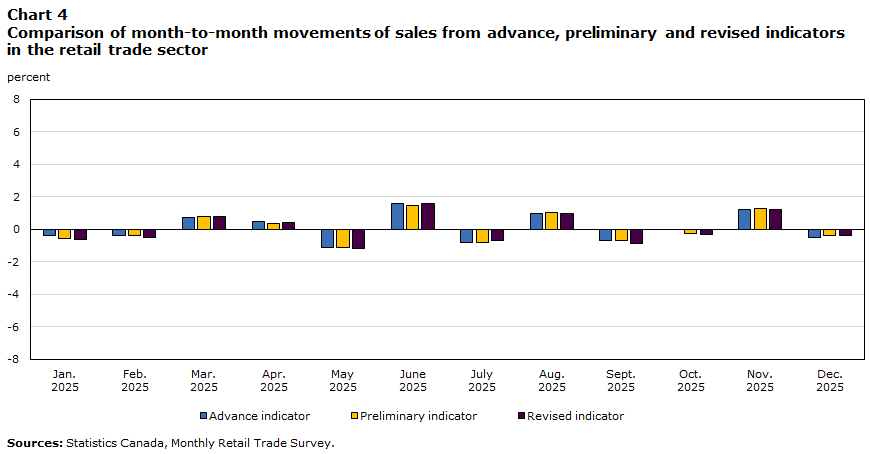
Chart 2, 3 and 4 illustrate the published month-to-month movements for sales in manufacturing, wholesale trade and retail trade throughout the 2025 reference year. The advance, preliminary and revised indicators are highly coherent, in terms of both the direction (increase or decrease) and the magnitude of the month-to-month change in sales.
Data table for Chart 2
| Advanced indicator | Preliminary indicator | Revised indicator | |
|---|---|---|---|
| percent | |||
| Sources: Statistics Canada, Monthly Survey of Manufacturing. | |||
| January | 2.0 | 1.7 | 1.6 |
| February | -0.2 | 0.2 | -0.2 |
| March | -1.9 | -1.4 | -1.4 |
| April | -2.0 | -2.8 | -2.7 |
| May | -1.3 | -0.9 | -1.5 |
| June | 0.4 | 0.3 | 0.3 |
| July | 1.8 | 2.5 | 2.2 |
| August | -1.5 | -1.0 | -1.1 |
| September | 2.8 | 3.3 | 3.6 |
| October | -1.1 | -1.0 | -1.0 |
| November | -1.1 | -1.2 | -1.3 |
| December | 0.5 | 0.6 | 0.4 |
Data table for Chart 3
| Advanced indicator | Preliminary indicator | Revised indicator | |
|---|---|---|---|
| percent | |||
| Sources: Statistics Canada, Monthly Wholesale Trade Survey. | |||
| January | 1.8 | 1.2 | 1.2 |
| February | 0.4 | 0.3 | 0.6 |
| March | -0.3 | 0.2 | 0.5 |
| April | -0.9 | -2.3 | -2.4 |
| May | 0.4 | 0.1 | -0.3 |
| June | 0.7 | 0.7 | 1.2 |
| July | 1.3 | 1.2 | 1.7 |
| August | -1.3 | -1.2 | -1.0 |
| September | 0.0 | 0.6 | 0.4 |
| October | -0.1 | 0.1 | 0.2 |
| November | 0.1 | -1.8 | -1.7 |
| December | 2.1 | 2.0 | 1.8 |
Data table for Chart 4
| Advanced indicator | Preliminary indicator | Revised indicator | |
|---|---|---|---|
| percent | |||
| Sources: Statistics Canada, Monthly Retail Trade Survey. | |||
| January | -0.4 | -0.6 | -0.6 |
| February | -0.4 | -0.4 | -0.5 |
| March | 0.7 | 0.8 | 0.8 |
| April | 0.5 | 0.3 | 0.4 |
| May | -1.1 | -1.1 | -1.2 |
| June | 1.6 | 1.5 | 1.6 |
| July | -0.8 | -0.8 | -0.7 |
| August | 1.0 | 1.0 | 1.0 |
| September | -0.7 | -0.7 | -0.9 |
| October | 0.0 | -0.2 | -0.3 |
| November | 1.2 | 1.3 | 1.2 |
| December | -0.5 | -0.4 | -0.4 |
Other production methods—nowcasting and forecasting
Nowcasting is another method that can be used to produce advance indicators. In contrast to flash estimation, nowcasting encompasses more types of advance indicators that use either different input data or different compilation methods than preliminary indicators. For example, a nowcast may include estimators based entirely on models that use information from alternative sources available at the time to generate the nowcast. Similar to flash estimation, nowcasting models typically yield advance indicators that are less precise than preliminary indicators.
An important distinction exists between advance indicators produced at Statistics Canada and what are commonly referred to as forecasts. Typically, forecasting models are used to project data forward to describe future reference periods, and, as a consequence, no information is available on the reference period of interest. The absence of observed data in forecasts increases the risk of inaccurate results because models rely on the assumption that historical trends and patterns will continue. In contrast, Statistics Canada incorporates some form of observed data in the production of advance indicators. Advance indicators released by Statistics Canada use direct observations as much as possible, such as data received from respondents or administrative data for a reference period of interest. The appropriate use of these data reduces the risk of large differences between advance indicators and preliminary indicators.
Section 2: Issues related to analysis and interpretation
Strengths, weaknesses and coherence
Advance indicators provide timelier information to users; however, they are less precise than preliminary and revised indicators produced at a later date. Statistics Canada follows a multidimensional framework to assess data quality (Statistics Canada, 2019), including the dimensions of accuracy and timeliness. Statistical products typically aim to strike a balance between these dimensions to best meet the needs of data users. In this particular framework, advance indicators are intended to be timelier, with some compromise in accuracy. Because of this compromise in accuracy, the advance indicators are published at more aggregate levels of detail, such as the national level rather than the provincial level, compared with preliminary and revised indicators. They are also not released through the official Statistics Canada data repository but are disseminated only as part of articles in Statistics Canada’s official release bulletin, The Daily.
Monitoring data quality
Before this initiative, studies demonstrated that publishing advance indicators would provide a desirable balance of data timeliness and accuracy for users. In particular, the criteria used for accuracy accounted for the direction and the magnitude of relative month-to-month movements. This element is particularly important because it identifies turning points in a time series; the magnitude of movements is a key consideration because it estimates the pace of economic change. The historical performance of advance indicators produced with flash estimation was assessed, and these indicators outperformed forecasting and nowcasting methods with comparable timeliness. Furthermore, advance indicators can be generated approximately one month earlier than preliminary indicators.
Each month, Statistics Canada compares advance indicators with the preliminary indicators that follow for the same reference period to monitor the size of the differences between them, as well as their coherence in terms of the direction of the month-to-month movement.
Additionally, a comprehensive review of advance indicators and their past performance is conducted periodically. This review includes analysis of descriptive statistics over time, as well as any noteworthy differences observed for individual reference periods.
Differences between advance and preliminary indicators
Since advance indicators are derived using the same methods as preliminary indicators, they are subject to the same types of sampling and non-sampling errors, but with different sensitivities to these sources of error. The differences between advance and preliminary indicators can be attributed to the following sources:
- Responses received after the production of advance indicators: Imputation, designed to produce unbiased and accurate aggregate estimates, is used to estimate values for each non-responding unit when advance indicators are produced. If an individual unit does not respond in time for the advance indicator but provides a response before the preliminary indicator is produced, this causes a difference between the advance and preliminary indicators. Large differences can occur when individual units have notable differences or when relatively small differences accumulate from many units.
- Improvements to imputation from additional responses received: Even for units that do respond in time for the advance indicator, the imputed values themselves can differ between advance and preliminary indicators. Since imputation for the preliminary indicator is based on more complete information, this indicator should be viewed as an improved estimate for non-responding units versus the advance indicator. While these differences are typically small, they can accumulate to yield notable differences between the advance and preliminary indicators.
- Updates made to data after the advance indicator: When advance indicators are produced, respondent data are subjected to a further revision and are updated as part of the data validation process, which can result in differences between the advance and preliminary indicators.
Future development
Statistics Canada continually seeks to adopt leading-edge methods to maximize data quality. To support these efforts, Statistics Canada regularly collaborates with other national statistical offices, other statistical organizations and academia to identify, develop and evaluate methods that would assist in producing advance indicators. In particular, nowcasting approaches hold promise to further improve timeliness if suitable accurate statistical models that rely on only available information can be developed.
References
Eurostat. (2017). Handbook on rapid estimates (2017 ed.). https://ec.europa.eu/eurostat/documents/3859598/8555708/KS-GQ-17-008-EN-N.pdf/7f40c70d-0a44-4459-b5b3-72894e13ca6d?t=1513758176000.
Statistics Canada. (2019). Statistics Canada Quality Guidelines (6th ed.). Statistics Canada. https://www150.statcan.gc.ca/n1/pub/12-539-x/12-539-x2019001-eng.htm.
- Date modified: