
Reports on Special Business Projects
Impact assessment of business innovation and growth support programs on firm performance in Canada using the CDM model
Skip to text
Text begins
Acknowledgments
We would like to acknowledge the attentive comments provided by two anonymous reviewers and Alessandro Alasia, Assistant Director, Centre for Special Business Projects. We would like to express special thanks to the language services team as well as the dissemination team at Statistics Canada without whom the review and dissemination of this study would not have been possible.
Summary
- The objective of this research study was to assess the impact of the Government of Canada’s business innovation and growth support (BIGS) program funding on firm financial performance, measured by revenue, profit and employment. Also, special attention was paid to the role of research and development (R&D) expenditures on firm financial performance as a proxy for firms’ product innovation.Note
- The findings of the study revealed that BIGS program funding had positive and significant effects on explaining firm revenue and employment. However, the impact was adverse concerning firm profit, during a period marked by important economic disruption caused by the COVID-19 pandemic. Moreover, the findings indicated that the extent of the impact remained relatively small, and it varied depending on the specific performance indicator and the nature of the business.
- The findings showed that the effect of BIGS program funding was slightly larger for non-exporting firms compared with their exporting counterparts. Conversely, the effect of R&D expenditures was slightly larger for exporting firms compared with non-exporting ones. Furthermore, the findings revealed that BIGS program funding and R&D expenditures had greater effects on employment levels in U.S.-controlled firms compared with Canadian-controlled firms.
Abstract
This study examined the impact of business innovation and growth support (BIGS) programs provided by the Government of Canada on firm financial performance measured using revenue, profit and employment metrics. Using Statistics Canada’s BIGS database and Business Linkable File Environment data, the study observed the effects of BIGS on different types of businesses, including exporting versus non-exporting firms and Canadian- versus U.S.-controlled firms from 2015 to 2020. Unlike previous studies that relied mainly on survey data, one significant aspect of this research was the use of a new dataset, enabling panel data structures and models to be employed. To assess the impact of BIGS and research and development spending on three interrelated measures of firm financial performance, the CDM (Crépon et al., 1998) framework was adopted. The results of the study indicated that BIGS programs had slightly greater effects on non-exporting firms than on exporting firms. Moreover, the findings showed that BIGS program funding and R&D expenditures had more significant effects on employment levels in U.S.-controlled firms compared with Canadian-controlled firms.
1. Introduction
Government support programs aim to play an important role in fostering business growth and innovation by providing various incentives and supporting access to resources and opportunities for firms. These programs are designed to create a favourable business environment, foster innovation ecosystems and drive economic development. Notably, government support programs often extend monetary aid through grants or loans to assist businesses with their research and development (R&D) efforts. The financial backing provided by these programs enables companies to explore new technological opportunities while simultaneously nurturing the creation of novel products and services—ultimately enhancing their competitive edge in the market. Furthermore, these programs facilitate access to specialized knowledge, often through various initiatives such as establishing innovation or technology hubs. Through this foundation of collaborative partnerships, firms can effectively tap into strategic alliances with industry experts, researchers and academics. In this way, they may gain invaluable insights that help them improve existing business processes or enable pathways for creating innovative offerings. In Canada, a myriad of BIGS programs are offered by various federal government departments, which aim to foster economic growth and encourage entrepreneurial activities. This continuum encompasses a wide range of initiatives that support businesses at different stages of development and innovation.
Despite the government’s substantial investment in business support and innovation programs, there are critical policy concerns with how to best evaluate their impact on firms and gain a deeper understanding of their effectiveness, streamline federal BIGS programs, and ultimately maximize innovation and economic growth in Canada.
This study enhances the understanding of the financial performance of the businesses that received federal government funding by controlling for two aspects that can lead to business growth and better performing firms: businesses’ level of innovation activity, measured by the value of funding received from federal BIGS programs as a proxy, and business expenditures in R&D.
On the one hand, innovation activities include all developmental, financial and commercial activities undertaken by a firm that are intended to result in an innovation for the firm. A business innovation is a new or improved product or business process that has been introduced on the market or brought into use by the firm. There are four types of business innovation: product, process, organizational and marketing innovation (OECD & Eurostat, 2018). In this study, the value of funding received from federal BIGS programs is used as a proxy to measure a firm’s level of innovation activity.
On the other hand, R&D includes a more specific range of activities that can generate innovation and lead to business growth. R&D activities are restricted to basic research, applied research and experimental development activities that are novel, creative, uncertain in their outcomes, systematic, transferable or reproducible (OECD, 2015). This study used a firm’s total in-house expenditures on R&D as a measure of a firm’s level of innovation activity to assess the relationship of R&D and innovation with firm performance.
The study assessed the impact of financial support for innovation and R&D spending on three interrelated aspects of firm performance: revenue, profit and employment. This study contributes to the existing literature by using more recent and comprehensive data on BIGS programs which presents a notable advantage from a methodological standpoint compared with other studies relying on survey data. Additionally, to account for the interdependency between employment, revenue and profit as financial measures of firm performance, the study adopted the CDM (Crépon et al., 1998) model for analyzing the firm innovation process, which has been extensively employed in previous research (e.g., Bérubé & Mohnen, 2009; Crépon et al., 1998; Dagenais et al., 2004; Fedyunina & Radosevic, 2022).
The next section provides the context for the BIGS programs in Canada and discusses the relevant literature. Section 3 discusses the empirical approach and data, highlighting their advantages in addressing the research question compared with previous research. Section 4 presents and analyzes the results. Lastly, Section 5 concludes the discussion by summarizing the findings and next steps.
2. Context: Innovation policy and program landscape in Canada — business innovation and growth support programs
2.1 Overview of business innovation and growth support programs
The Government of Canada provides financial support and advisory services to support innovation and growth for businesses through various federal departments and agencies. BIGS programs are designed to address the needs and challenges of different types of businesses, including small and medium enterprises (SMEs), start-ups, research organizations, and industry-specific sectors. Their aim is to foster innovation, enhance competitiveness and stimulate economic growth by providing financial assistance, technical expertise and advisory services, as well as increase access to resources such as partnerships and mentorships.
The magnitude of support provided through BIGS programs varies depending on the program and the nature of the project or initiative being supported. The programs can provide different types of support to firms, including grants, loans, advisory services in the form of training or mentorship opportunities, collaborative research partnerships, or any combination of support. The level of funding or assistance provided is often determined based on factors such as project scope, innovation potential, economic impact and eligibility criteria set by the respective programs. In 2020, the BIGS database consisted of 123 programs involving 18 federal departments and agencies.Note Significant BIGS federal departments included departments and agencies in the Innovation, Science and Economic Development (ISED) portfolioNote, Natural Resources Canada and Agriculture and Agri-Food Canada.
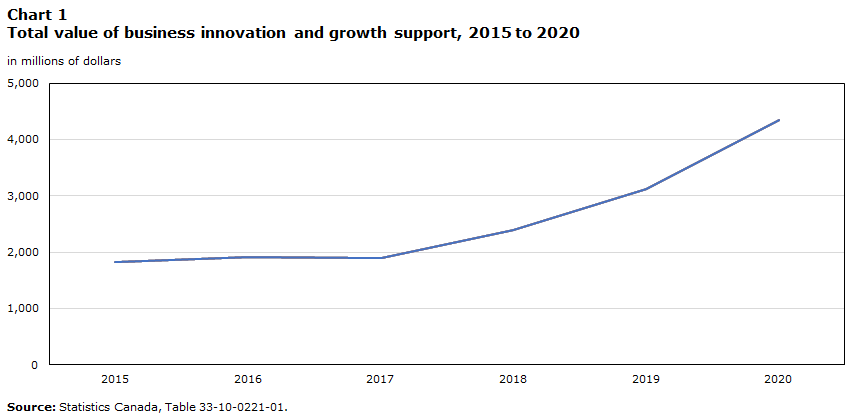
The total funding provided by BIGS programs has tended to grow over the years, starting out at $1.8 billion in 2015 and progressively increasing to $4.3 billion in 2020 (Chart 1). Significant BIGS programs in 2020 in terms of value of support were the Canada Small Business Financing Program, delivered by ISED and the Industrial Research Assistance Program, delivered by the National Research Council Canada. Significant types of BIGS funding included grants and contributions, loan guarantees, targeted procurement and cost-recovered services, with remaining support consisting of advisory services provided at no cost to the client.
Data table for Chart 1
| in millions of dollars | |
|---|---|
| 2015 | 1,819 |
| 2016 | 1,915 |
| 2017 | 1,902 |
| 2018 | 2,399 |
| 2019 | 3,128 |
| 2020 | 4,339 |
| Source: Statistics Canada, Table 33-10-0221-01. | |
SMEs were particularly prominent in receiving federal innovation and growth support. Around 96% of BIGS recipients were businesses with fewer than 500 employees in 2020, while large firms with 500 employees or more accounted for 4% of BIGS recipient businesses (Chart 2).

Data table for Chart 2
| 0 to 9 employees | 10 to 49 employees | 50 to 99 employees | 100 to 249 employees | 250 to 499 employees | 500 employees or more | |
|---|---|---|---|---|---|---|
| percent | ||||||
| 2015 | 45 | 32 | 9 | 7 | 3 | 5 |
| 2016 | 45 | 32 | 9 | 7 | 3 | 5 |
| 2017 | 44 | 32 | 9 | 7 | 3 | 5 |
| 2018 | 43 | 32 | 9 | 7 | 3 | 5 |
| 2019 | 43 | 32 | 9 | 7 | 3 | 5 |
| 2020 | 49 | 31 | 7 | 6 | 2 | 4 |
|
Note: Percentages do not always add up to 100% due to rounding. Source: Statistics Canada, Table 33-10-0219-01. |
||||||
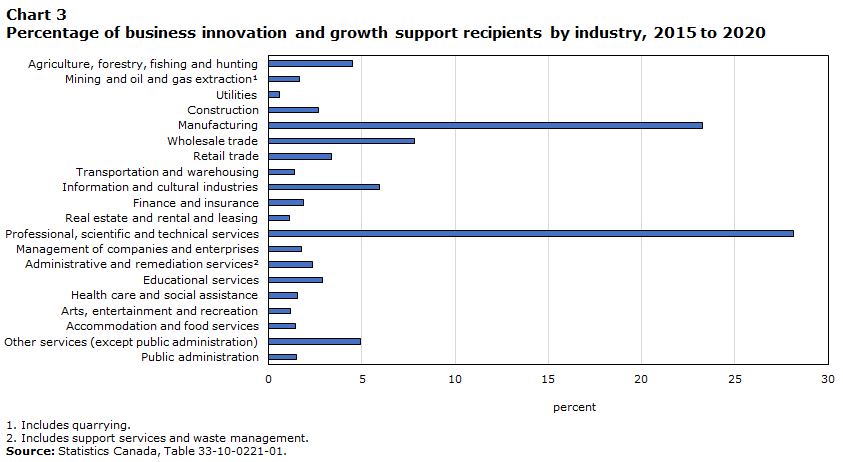
In terms of industry distribution, most firms (around 67%) that received BIGS from 2015 to 2020 operated in service sectors (Chart 3). The largest recipients of BIGS were the professional, scientific and technical services sector and the manufacturing sector, with 28% and 23% of the total recipient firms, respectively.
Data table for Chart 3
| Industry | Percent |
|---|---|
| Agriculture, forestry, fishing and hunting | 5 |
| Mining and oil and gas extractionData table for Chart 3 Note 1 | 2 |
| Utilities | 1 |
| Construction | 3 |
| Manufacturing | 23 |
| Wholesale trade | 8 |
| Retail trade | 3 |
| Transportation and warehousing | 1 |
| Information and cultural industries | 6 |
| Finance and insurance | 2 |
| Real estate and rental and leasing | 1 |
| Professional, scientific and technical services | 28 |
| Management of companies and enterprises | 2 |
| Administrative and remediation servicesData table for Chart 3 Note 2 | 2 |
| Educational services | 3 |
| Health care and social assistance | 2 |
| Arts, entertainment and recreation | 1 |
| Accommodation and food services | 1 |
| Other services (except public administration) | 5 |
| Public administration | 1 |
|
|
2.2 Literature review
The primary reason governments support innovation and business growth is to influence the behaviour of companies, encouraging them to actively participate in innovation activities and develop stronger potential for growth. Research has shown that, in turn, this increases the country’s competitiveness and generates economic benefits for society (Czarnitzki et al., 2004; Czarnitzki & Hussinger, 2017; Lu et al., 2022). Given that innovation and investments with high growth potential carry elevated risks, a firm’s aversion to risk may impede its ability to seize growth opportunities. The fact that innovation and knowledge creation are non-rival and non-excludable in nature is another significant factor (Lu et al., 2022). This means that individually firms are unable to fully appropriate their investments and returns from innovation. Consequently, government support aims to enhance knowledge creation, which is considered a public good.
The economic literature on business innovation is divided into two distinct streams, each focusing on different aspects. The studies in the first stream (e.g., David et al., 2000; De Fuentes et al., 2021) investigate the impact of innovation programs on firm-level innovation and growth using the treatment effect approach in their empirical analysis, comparing the performance of funding recipients with the performance of firms that did not receive funding. By contrast, those in the second stream (e.g., Crépon et al., 1998; Hall & Van Reenen, 2000; Le, 2020; Lööf et al., 2017; Mairesse et al., 2005) use the CDM model proposed by Crépon et al. (1998), which explores determinants of firms’ innovation processes without considering the government support received by these firms.
In response to this, the current study aimed to bridge the gap by integrating government support into the CDM framework. This study assessed the impact of financial support for innovation on firm financial performance only, measured by revenue, profit and employment. This study used only firms with a positive dollar value of funding.
The first stream of the literature which uses the treatment effect approach provides a more in-depth understanding of how government support affects recipient firms. For instance, empirical research within this first stream explores whether the public support is efficient, specifically focusing on whether it enhances a firm’s investments in R&D and growth opportunities or whether it is substituting (crowding-out effect) private investments. Empirical studies have yielded divergent results. Some studies have shown that R&D programs or subsidies complement private R&D investments (e.g., David et al., 2000; De Fuentes et al., 2021), while others have not identified a significant impact of government subsidies on private R&D expenditures at the firm level (Bronzini & Piselli, 2016; Dimos & Pugh, 2016; Radicic et al., 2016). In their theoretical model, Lu et al. (2022) provide important insights into the reasons behind divergent findings in empirical studies. Their model explores various factors related to program conditions and firm-level characteristics, such as a firm’s absorptive capacity and financial resourcefulness, to explain why certain programs may result in a crowding-out effect rather than a crowding-in or complementarity effect. According to Lu et al. (2022), a program’s impact on private expenditures will be positive if the expected benefits of the project outweigh the opportunity cost. This occurs when the programs help firms manage risks associated with building capabilities. Empirical studies have supported the notion that program complementarities, particularly the combination of advisory service and R&D subsidies, are more likely to be successful (e.g., De Fuentes et al., 2021; Shapira & Youtie, 2016).
An important aspect seemingly absent from this line of research is the omission of firm financial performance as a measure of output. While most of the studies in this domain have focused on measuring firm performance by capturing innovation outputs, this study employed financial performance indicators, along with changes in employment levels. Given that the primary focus here was to assess the impact of programs on diverse firm performance outcomes, this study contributed to the program evaluation literature by using new administrative data on businesses receiving government support, as well as panel data and the instrumentalization of performance indicators, to increase the precision of estimates. Furthermore, compared with other studies, this study incorporated R&D expenditures as a proxy for firms’ product innovation and BIGS funding as input variables, while exploring a range of performance outcome variables. The rationale is that BIGS programs are designed to support not only firm innovation, but also firm growth and performance. As well, given that the firm’s innovation effort is expected to yield higher financial performance and expand the firm’s size, it is crucial to measure the programs’ impact on economic performance indicators such as revenue, profit and employment.
The second stream of the literature employs the CDM model, which assesses the innovation process by using simultaneous equations to capture both innovation outputs and inputs. The CDM approach formalizes the innovation process in a three-step framework. The first step focuses on measuring the innovation input side, specifically a firm’s decision to invest in R&D and the intensity of R&D. The obtained results from innovation input equations are then used as inputs for explaining innovation output equations in the second step, which typically measure factors such as the number of innovation products or services, sales derived from innovation, or the number of intellectual properties generated. The third step involves measuring productivity, indicating that innovation outputs enhance a firm’s productivity (Crépon et al., 1998; Hall & Van Reenen, 2000; Le, 2020; Lööf et al., 2017; Mairesse et al., 2005) . This study applied this framework to (a) formalize a firm’s performance process and (b) incorporate government support as a key input variable.
Another important aspect of the literature in this domain is the empirical methodology and data on how to measure the programs’ impact. One of the commonly used approaches is using matching techniques to construct a treatment and control group and compare the outcomes between these two groups (e.g., Czarnitzki et al., 2004; Czarnitzki & Hussinger, 2017; De Fuentes et al., 2021). However, government support is endogenous as the firms are not selected randomly in the treatment group, and this is not addressed by matching techniques. Also, only cross-sectional data are available often, and they cannot control for the unobserved heterogeneity among firms in the treatment group, resulting in overestimating the programs’ impact (Radicic et al., 2016). A significant advantage of using the CDM model is its ability to address the issue of endogeneity by employing an equation that reflects a firm’s decision to innovate. In this study, this approach was modified to measure the impact of government support on various firm financial performance outcome variables, which were interconnected in a sequential manner.
3. Empirical approach
3.1 Data
The data used in this study include BIGS program-level information from the BIGS database linked to Statistics Canada’s Business Linkable File Environment (B-LFE). The B-LFE contains firm-level information, such as location, country of ownership, revenues, number of employees, assets, value of exports and annual R&D expenditures, derived from Statistics Canada’s Business Register (BR), the Corporate Revenue Tax File, the Statement of Account for Current Source Deductions (PD7), Trade by Exporter Characteristics, and the Annual Survey of Research and Development in Canadian Industry, among other sources.
This analysis focused on BIGS beneficiaries that received positive financial funding from 2015 to 2020. Because BIGS advisory services are provided to beneficiaries at no cost, they are not considered in this analysis. The database contained 145,000 observations during the study period, with unique support recipient enterprise numbers ranging from 22,029 in 2015 to 28,000 in 2020 (indicating imbalanced data). To conduct the analysis, a robust balanced panel dataset was constructed by selecting only those firms that had received annual BIGS funding throughout the study period. After excluding observations where firms did not receive BIGS in all six years, the count of firms dropped to 5,181, with 31,086 total observations (5 181 enterprises x 6 years).
3.2 Model
First, the model estimated BIGS recipients’ revenue. This was used to estimate their profit, which was then used to estimate their employment. Thus, the first stage of the model measured the impact of the federal funding (i.e., BIGS programs) on revenue in Equation (1). The second stage involved assessing the impact of federal funding on profit, using the estimates of revenue as an input variable, in Equation (2). Finally, the last stage estimated the impact of federal funding on employment using the estimates of profit as an input variable for Equation (3).
Equation (1) for revenue performance
Equation (2) for profit performance
Equation (3) for employment performance
In the equations above, ln indicates the logarithmic forms of the variables, i represents the firm and t = 2015,…,2020 represents the year. The error terms for each equation, denoted , and , respectively, capture variation over time and across different firms. Explanatory variables incorporated in the model were the amount of federal government financial support (INNOFUNDING) and firm characteristics such as R&D expenditures, assets, age, industry and province. In the empirical model, one-year lag values for INNOFUNDING and R&D were used, given that R&D investments and program funding invested in new projects are only expected to be in effect after a year.
3.3 Estimation
The equations were estimated by using fixed effect generalized least squares to obtain efficient and consistent estimators in the presence of potential heteroscedasticity in data. In equations (2) and (3), wages were instrumented by the predicted values of and , respectively, which were considered exogenous. The model used strongly balanced data, which included the firms that received BIGS funding during the study period. The estimation models were also conducted considering various combinations of business and support types.
Business types
- By exporting activity (exporters versus non-exporters): The businesses were divided based on their exporting activities. The Trade by Exporter Characteristics database provides information on businesses’ value of exports. This study used a dummy variable equal to 1 for exporters when the value of exports is positive and 0 otherwise for non-exporters.
- By country of ownership (Canadian- versus U.S.-controlled businesses): In the BR, the country of control classifies enterprises by the country of residence of the ultimate shareholders. This study used Canadian- and U.S.-controlled businesses, given that more than half of all foreign-controlled businesses have U.S. owners. For instance, in 2019, around 53% of foreign-controlled businesses belonged to U.S. owners (Statistics Canada, 2022).
Support types
- Grants and non-repayable contributions: The BIGS database contains data on the value of support by federal programs and types of support provided to recipient firms. BIGS encompasses several types of support, such as grants, non-repayable contributions, repayable contributions, advisory services, cost-recovered services and targeted procurement. BIGS support is mainly provided in the form of grants and contributions.
3.4 Variables
Dependent variables
To measure firm performance, three variables were used.
Revenue (REV): This variable captures firm performance in Equation (1). It captures a firm’s ability to generate sales and income. Higher revenue typically indicates positive business growth. This variable is the annual total revenue on line 8299 of the General Index of Financial Information (GIFI).
Profit: This variable is a measure of a firm’s financial gains after deducting all expenses from its revenue. Higher profits indicate the firm’s financial health and efficiency in generating returns on its investments. PROFIT is the gross profit or loss on line 8519 of the GIFI.
Employment (EMP): Employment is an important indicator of a firm’s ability to generate jobs and contribute to economic growth. Higher employment numbers indicate the strong position of the firm in the market. This variable is from the PD7, and it is reported as the average number of employees over 12 months at the firm level.
Independent variables
Value of BIGS received (INNOFUNDING): The main variable of interest was the government funding from BIGS programs (INNOFUNDING). It was measured by the total amount of annual funding received by a firm in year t-1 from any BIGS program and any type of BIGS funding (e.g., grants and contributions, and loans). In the BIGS database, advisory services are not assigned a monetary value; therefore, they were not considered in this study.
R&D: R&D is recognized as an important firm activity as it plays a significant role in enhancing innovation, fostering growth and improving competitiveness (e.g., Binh & Tung, 2020; Gui-Long et al., 2017). It is also regarded as a risky investment, because firms may often fail to innovate or receive returns from innovation. Yet firms engage in R&D with the objective of enhancing existing products or creating new ones, ultimately leading to increased revenues and profits. In this study, R&D expenditures were used as a measure of a firm’s annual investments in R&D in year t-1. R&D expenditures were calculated from two primary sources: Statistics Canada’s Annual Survey of Research and Development in Canadian Industry, and Scientific Research and Experimental Development tax data.
Wages: To capture labour-related aspects of a firm’s operations and cost management, the model used wages, which is an annual measurement of the firm’s compensation paid to employees. Higher wages may indicate that a firm is attracting and retaining a skilled workforce, hence enhancing the firm’s ability to generate better economic performance—higher revenue, profit and innovation (e.g., Cirillo, 2014). Wages were calculated from the PD7 database, corresponding to the total annual pay for a calendar year. In the model, this variable was included only in the first equation, while estimating the predicted values of revenues.
Assets: This variable was included to capture a firm’s financial strength and resources. It is the total assets on line 2599 of the GIFI. Assets serve as a proxy for the size and scale of the business, as larger asset values generally indicate a larger business with more extensive operations and market presence. This analysis helped in understanding how a firm’s investment decisions and resource allocation impact its performance, growth, productivity and competitiveness.
Age: This variable reflects the number of years a firm has been operating since its establishment. The rationale behind including the firm’s age is that older firms typically possess more market experience, have more knowledge and are more likely to receive government funding than younger firms (De Fuentes, et al., 2021). The firm’s age comes from Statistics Canada’s BR.
Other control variables
The analysis incorporated several control variables to account for the firm characteristics in the sample. To aggregate individual effects and consider regional and sectorial variation, dummy variables for the firm’s province and industry were used.
The industry variable (IND) classified the firm’s activities based on the two-digit North American Industry Classification System industry taxonomy. Similarly, the province of the business operations was used to capture the firm’s location, represented by the firm’s province or territory variable (PROV), which consisted of dummy variables for each province and the territories. Both industry and location were obtained from BR records.
Table 1 presents the results of the descriptive statistics and pairwise correlation among all variables. The averages are the average of all non-missing values over the 2015-to-2020 period for all firms that received funding in at least one year during the period. For instance, if a firm received funding in 2015, the average revenue is the average revenue of each year from 2015 to 2020. If the firm was created in 2018, the average revenue is the average of all years with non-missing revenue (2018, 2019 and 2020).
The average revenue was approximately $995 million, while the average profit was around $232 million. Both variables have high standard deviations ($8 billion for revenue and $3 billion for profit), indicating that the values of the variables vary widely. Related to R&D, the average expenditure was $2 million, with a standard deviation of $14 million. In the sample, firms on average had 2,947 employees. Over the 2015-to-2020 period, the total value of BIGS funding was $1 million on average per firm, with a wide range of variation (standard deviation of $8 million). The average firm age was 19 years, with a standard deviation of 15 years.
The amount of BIGS received by firms showed a significant and negative correlation with firm performance measures (i.e. , revenue, profit and employment). At the same time, R&D had a significant and positive correlation with them. The firm’s age had a positive and significant correlation with performance variables but a negative and significant correlation with INNOFUNDING and R&D, consistent with the previous literature and empirical evidence. Older firms conducted more R&D and, therefore, had higher chances of receiving government support.
| Variables | Mean | Standard deviation | (1) Revenue | (2) Profit | (3) Employment | (4) INNOFUNDING | (5) | (6) Wages | (7) Assets | (8) Age |
|---|---|---|---|---|---|---|---|---|---|---|
| (1) Revenue (in millions of dollars) | 995 | 8,000 | 1.000 | 0.922Note *** | 0.867Note *** | -0.076Note *** | 0.196Note *** | 0.875Note *** | 0.881Note *** | 0.490Note *** |
| (2) Profit (in millions of dollars) | 232 | 2,970 | 0.922Note *** | 1.000 | 0.838Note *** | -0.062Note *** | 0.258Note *** | 0.851Note *** | 0.842Note *** | 0.452Note *** |
| (3) Employment (number of employees) | 2,947 | 19,327 | 0.867Note *** | 0.838Note *** | 1.000 | -0.017Note *** | 0.141Note *** | 0.968Note *** | 0.852Note *** | 0.455Note *** |
| (4) INNOFUNDING (in millions of dollars) | 1 | 8 | -0.076Note *** | -0.062Note *** | -0.017Note *** | 1.000 | 0.162Note *** | -0.014Note ** | -0.054Note *** | -0.073Note *** |
| (5) (in millions of dollars) | 2 | 14 | 0.196Note *** | 0.258Note *** | 0.141Note *** | 0.162Note *** | 1.000 | 0.191Note *** | 0.231Note *** | -0.091Note *** |
| (6) Wages (in millions of dollars) | 163 | 948 | 0.875Note *** | 0.851Note *** | 0.968Note *** | -0.014Note ** | 0.191Note *** | 1.000 | 0.870Note *** | 0.445Note *** |
| (7) Assets (in billions of dollars) | 8 | 143 | 0.881Note *** | 0.842Note *** | 0.852Note *** | -0.054Note *** | 0.231Note *** | 0.870Note *** | 1.000 | 0.446Note *** |
| (8) Age (in years) | 19 | 15 | 0.490Note *** | 0.452Note *** | 0.455Note *** | -0.073Note *** | -0.091Note *** | 0.445Note *** | 0.446Note *** | 1.000 |
Source: Authors’ calculations based on Statistics Canada's Business Linkable File Environment. |
||||||||||
4. Results
The results are presented in the following order. First, subsection 4.1 discusses the results of the basic model. In subsection 4.2, the results with different groups such as business type and payment type are presented.
4.1. Basic models
Table 2 provides the estimated effect of BIGS programs on firm performance. Model 1 examines the relationship between firm revenue and BIGS programs, Model 2 focuses on firm profit, and Model 3 measures employment. All variables used in the models are in logarithmic form. The number of observations in Table 2 represents the number of observations with non-missing values for each year from 2015 to 2020 that were used in each model. For instance, 5,181 firms received BIGS funding in each year from 2015 to 2020, resulting in a total of 31,086 observations (5,181 x 6). Observations with a zero, missing or negative value for R&D, assets, age, wages, revenue, region or industry in any year were removed from Model 1. Additionally, observations with zero or negative profit were removed from Model 2, and observations with zero employees were removed from the estimation of Model 3.
| Variables | Model 1: log_Revenue | Model 2: log_Profit | Model 3: log_Employment |
|---|---|---|---|
| L.log_INNOFUNDING | |||
| Coefficient | 0.002Note *** | -0.005Note *** | 0.007Note *** |
| Robust standard error | (0.001) | (0.001) | (0.000) |
| L.log_ | |||
| Coefficient | 0.003 | -0.008Note *** | 0.008Note *** |
| Robust standard error | (0.002) | (0.003) | (0.001) |
| log_Assets | |||
| Coefficient | 0.331Note *** | -0.002 | -0.389Note *** |
| Robust standard error | (0.020) | (0.038) | (0.020) |
| log_Age | |||
| Coefficient | 0.648Note *** | -0.140 | -0.626Note *** |
| Robust standard error | (0.057) | (0.091) | (0.037) |
| log_Wages | |||
| Coefficient | 0.363Note *** | Note ...: not applicable | Note ...: not applicable |
| Robust standard error | (0.020) | Note ...: not applicable | Note ...: not applicable |
| log_Revenue_hat | |||
| Coefficient | Note ...: not applicable | 1.040Note *** | Note ...: not applicable |
| Robust standard error | Note ...: not applicable | (0.070) | Note ...: not applicable |
| log_Profit_hat | |||
| Coefficient | Note ...: not applicable | Note ...: not applicable | 1.324Note *** |
| Robust standard error | Note ...: not applicable | Note ...: not applicable | (0.042) |
| Constant | |||
| Coefficient | 3.404Note *** | -0.121 | -9.408Note *** |
| Robust standard error | (0.569) | (0.651) | (0.311) |
| R-squared | 0.323 | 0.212 | 0.619 |
| Number of observations | 20,543 | 18,473 | 20,717 |
| Number of unique firms | 4,291 | 4,041 | 4,294 |
... not applicable
Source: Authors’ calculations based on Statistics Canada's Business Linkable File Environment. |
|||
The number of firms with non-missing values in all years for all variables in Table 2 used in the estimation varies slightly across models: 4,291 firms in Model 1, 4,041 in Model 2 and 4,294 in Model 3. The panel data consist of 20,543 observations in Model 1, 18,473 in Model 2 and 20,717 in Model 3 over the period from 2015 to 2020.
The results show that INNOFUNDING had a positive and significant coefficient for revenue (0.002) and employment (0.007). By contrast, it had a negative and significant effect on profit, with a coefficient of -0.005. R&D had a negative and significant coefficient for profit and a positive and significant coefficient for employment. However, R&D did not appear to have a significant relationship with a firm’s revenue.
Assets had significant and positive effects on revenue, while they did not have a significant effect on profit. Assets had a significant and negative effect on employment, suggesting that a 1% increase in assets increased revenue by 0.33% and reduced employment by 0.38%. Similarly, age was positive and significant for revenue and significant and negative for employment, indicating that a 1% change in age resulted in a 0.64% increase in revenue and a 0.62% decline in employment.
Wages showed a significant and positive relationship with revenue, suggesting that a 1% increase in wages increased revenue by 0.36%.
Notably, the estimate of revenue obtained in Model 1 had a significant and positive association with the firm’s profit in Model 2, suggesting that a 1% increase in revenue generated around a 1.04% increase in profits. The estimates of profit obtained from Model 2 showed a significant and positive association with employment in Model 3. These results indicate that a 1% increase in a firm’s profit generated a 1.32% increase in employment.
Industry and province dummies were included in the model but are not reported, given that there was little variation in these variables over time.
4.2. Models based on business type
Exporters versus non-exporters
The next set of empirical results is related to business export activities (see Table 3), where separate analyses for two distinct groups are conducted: (a) exporters, or businesses with exporting activities, and (b) non-exporters, or businesses without any exporting activities. The study analyzes the differentiated impacts of BIGS programs on exporting versus non-exporting firms, given the notion that, in general, exporting firms are more innovative, profitable and productive. Exporting, a firm’s expansion to various markets, can increase revenue and profit.Note Therefore, including these two diverse groups in the analysis was necessary, even though BIGS programs do not focus directly on firms’ exporting activities.
Model 1
The INNOFUNDING and R&D variables are positive but statistically insignificant for exporting and non-exporting firms in the revenue model. Additionally, a firm’s assets, age and wages showed a positive and significant relationship with revenue for exporting and non-exporting firms. Assets and wages had a larger impact on the revenues of exporting firms compared with non-exporting firms. By contrast, the firm’s age had a slightly larger effect on the revenue of non-exporting firms versus exporting firms. Specifically, the results show that a 1% increase in assets resulted in a 0.35% increase in revenues for exporting firms and a 0.29% increase for non-exporting firms. Similarly, a 1% increase in age resulted in a revenue increase of 0.64% for exporting firms and a 0.69% increase for non-exporting firms.
Model 2
In the profit model, the previous year’s R&D and INNOFUNDING had a significant and small negative association with the firm’s profit in the current year for exporting and non-exporting firms. The firm’s assets and age were insignificant for exporting and non-exporting firms. The predicted revenue values were significant and positive for exporting and non-exporting firms, suggesting that a 1% increase in revenues resulted in a 1.03% increase in profits for exporting firms, with a slightly smaller increase (1.02%) for non-exporting firms.
Model 3
For the employment model, the lagged INNOFUNDING and R&D variables showed a positive and significant effect for exporting and non-exporting firms. Additionally, the firm’s assets and age had a significant and negative effect on firm employment for exporting and non-exporting firms, suggesting that an increase in a firm’s assets and age led to lower current employment levels. These results are aligned with the findings obtained in the basic model. Lastly, the predicted values of profit were significant and had positive effects on employment, suggesting that a 1% increase in profit resulted in a 1.39% increase in employment levels for exporting firms and a 1.26% increase for non-exporting firms.
It is possible that exporting status is associated more closely with R&D spending than BIGS. The majority of BIGS recipient firms are non-exporters, as BIGS does not focus on exporters specifically. BIGS targets mostly SMEs, and exporters tend to be larger. Also, the end of the study period coincides with the COVID-19 pandemic, which caused an important economic slowdown that especially affected exports.
| Variables | Model 1: log_Revenue | Model 2: log_Profit | Model 3: log_Employment | |||
|---|---|---|---|---|---|---|
| Exporters | Non-exporters | Exporters | Non-exporters | Exporters | Non-exporters | |
| L.log_INNOFUNDING | ||||||
| Coefficient | 0.001 | 0.003 | -0.004Note *** | -0.006Note ** | 0.006Note *** | 0.009Note *** |
| Robust standard error | (0.001) | (0.002) | (0.001) | (0.003) | (0.000) | (0.001) |
| L.log_ | ||||||
| Coefficient | 0.002 | 0.004 | -0.007Note * | -0.008Note * | 0.009Note *** | 0.007Note *** |
| Robust standard error | (0.002) | (0.004) | (0.003) | (0.005) | (0.001) | (0.002) |
| log_Assets | ||||||
| Coefficient | 0.355Note *** | 0.296Note *** | -0.010 | 0.019 | -0.447Note *** | -0.335Note *** |
| Robust standard error | (0.031) | (0.027) | (0.056) | (0.047) | (0.024) | (0.028) |
| log_Age | ||||||
| Coefficient | 0.642Note *** | 0.696Note *** | -0.173 | -0.032 | -0.643Note *** | -0.726Note *** |
| Robust standard error | (0.079) | (0.090) | (0.108) | (0.155) | (0.043) | (0.063) |
| log_Wages | ||||||
| Coefficient | 0.397Note *** | 0.335Note *** | Note ...: not applicable | Note ...: not applicable | Note ...: not applicable | Note ...: not applicable |
| Robust standard error | (0.031) | (0.026) | Note ...: not applicable | Note ...: not applicable | Note ...: not applicable | Note ...: not applicable |
| log_Revenue_hat | ||||||
| Coefficient | Note ...: not applicable | Note ...: not applicable | 1.038Note *** | 1.021Note *** | Note ...: not applicable | Note ...: not applicable |
| Robust standard error | Note ...: not applicable | Note ...: not applicable | (0.090) | (0.102) | Note ...: not applicable | Note ...: not applicable |
| log_Profit_hat | ||||||
| Coefficient | Note ...: not applicable | Note ...: not applicable | Note ...: not applicable | Note ...: not applicable | 1.394Note *** | 1.264Note *** |
| Robust standard error | Note ...: not applicable | Note ...: not applicable | Note ...: not applicable | Note ...: not applicable | (0.047) | (0.062) |
| Constant | ||||||
| Coefficient | 3.369Note *** | 2.958Note *** | -1.325 | 0.389 | -8.615Note *** | -8.907Note *** |
| Robust standard error | (0.626) | (0.874) | (0.831) | (0.756) | (0.339) | (0.422) |
| R-squared | 0.342 | 0.316 | 0.189 | 0.265 | 0.650 | 0.603 |
| Number of observations | 13,859 | 6,684 | 12,905 | 5,568 | 13,940 | 6,777 |
| Number of unique firms | 2,841 | 1,450 | 2,750 | 1,291 | 2,842 | 1,452 |
... not applicable
Source: Authors’ calculations based on Statistics Canada's Business Linkable File Environment. |
||||||
Canadian-controlled versus U.S.-controlled businesses
Table 4 displays the results based on two distinct ownership groups: (a) Canadian-controlled businesses and (b) U.S.-controlled businesses to examine whether there is a significant difference in the impact of government support on firm performance between the two types of businesses.
The variable INNOFUNDING was not statistically significant for Canadian- and U.S.-controlled firms in the revenue model. However, it showed a positive and significant relationship with employment for both Canadian and U.S.-controlled firms. The model indicated that a 1% increase in government support in the previous year led to 0.007% and 0.014% increases in employment levels for Canadian- and U.S.-controlled businesses, respectively. INNOFUNDING showed a negative and significant relationship with profit but only for Canadian-controlled firms—the effect was very small.
While lagged values of R&D expenditures had significant coefficients across almost all models, they showed no significant effect on profit for U.S.-controlled firms. In terms of firm revenue, R&D expenditures had a small positive association for Canadian-controlled firms and a negative association for U.S.-controlled firms. The previous period’s R&D expenditures were significantly and positively associated with the employment level for both groups, with a larger effect observed for U.S.-controlled firms.
The results show that a 1% rise in assets increased revenue by 0.33% for Canadian-controlled firms and 0.25% for U.S.-controlled firms. By contrast, assets contributed significantly and negatively to employment levels for both types of firms, suggesting that a 1% increase in assets reduced employment by 0.41% for Canadian-controlled firms and 0.34% for U.S.-controlled firms. Assets were not statistically significant for Canadian- and U.S.-controlled firms in the profit model.
Firm age had a significant effect only on Canadian-controlled firms in the revenue and employment models. These results suggest that older Canadian-controlled firms tended to have higher revenues, and that a 1% rise in a firm’s age increased the revenue of Canadian-controlled firms by 0.63%. By contrast, the findings suggest that older Canadian-controlled firms tended to have lower employment, as a 1% increase in a firm’s age reduced employment by 0.59%. Firm age was not statistically significant in the profit model for either type of firm.
Wages and the predicted values of revenues and profit had significant and positive coefficients in their respective models for both Canadian-controlled and U.S.-controlled businesses. Also, the results showed that a 1% gain in revenue generated a 1.02% increase in profit and a 1.32% rise in employment for Canadian-controlled businesses. For U.S.-controlled businesses, a 1% gain resulted in a 1.97% increase in profit, which was nearly double that of Canadian-controlled businesses, and a 1.39% rise in employment.
| Variables | Model 1: log_Revenue | Model 2: log_Profit | Model 3: log_Employment | |||
|---|---|---|---|---|---|---|
| Canadian-controlled | U.S.-controlled | Canadian-controlled | U.S.-controlled | Canadian-controlled | U.S.-controlled | |
| L.log_INNOFUNDING | ||||||
| Coefficient | 0.002 | -0.001 | -0.005Note *** | -0.008 | 0.007Note *** | 0.014Note *** |
| Robust standard error | (0.001) | (0.006) | (0.001) | (0.007) | (0.000) | (0.002) |
| L.log_ | ||||||
| Coefficient | 0.005Note ** | -0.026Note * | -0.009Note *** | 0.032 | 0.008Note *** | 0.028Note *** |
| Robust standard error | (0.002) | (0.015) | (0.003) | (0.028) | (0.001) | (0.004) |
| log_Assets | ||||||
| Coefficient | 0.336Note *** | 0.257Note *** | 0.011 | -0.218 | -0.410Note *** | -0.344Note *** |
| Robust standard error | (0.022) | (0.079) | (0.040) | (0.222) | (0.021) | (0.062) |
| log_Age | ||||||
| Coefficient | 0.637Note *** | 0.133 | -0.140 | 0.061 | -0.599Note *** | -0.298 |
| Robust standard error | (0.059) | (0.255) | (0.094) | (0.373) | (0.038) | (0.223) |
| log_Wages | ||||||
| Coefficient | 0.359Note *** | 0.280Note *** | Note ...: not applicable | Note ...: not applicable | Note ...: not applicable | Note ...: not applicable |
| Robust standard error | (0.021) | (0.073) | Note ...: not applicable | Note ...: not applicable | Note ...: not applicable | Note ...: not applicable |
| log_Revenue_hat | ||||||
| Coefficient | Note ...: not applicable | Note ...: not applicable | 1.029Note *** | 1.976Note *** | Note ...: not applicable | Note ...: not applicable |
| Robust standard error | Note ...: not applicable | Note ...: not applicable | (0.072) | (0.693) | Note ...: not applicable | Note ...: not applicable |
| log_Profit_hat | ||||||
| Coefficient | Note ...: not applicable | Note ...: not applicable | Note ...: not applicable | Note ...: not applicable | 1.324Note *** | 1.393Note *** |
| Robust standard error | Note ...: not applicable | Note ...: not applicable | Note ...: not applicable | Note ...: not applicable | (0.043) | (0.151) |
| Constant | ||||||
| Coefficient | 3.320Note *** | 8.511Note *** | -0.148 | -14.858Note * | -9.139Note *** | -10.937Note *** |
| Robust standard error | (0.634) | (1.568) | (0.668) | (8.817) | (0.315) | (1.790) |
| R-squared | 0.331 | 0.134 | 0.219 | 0.124 | 0.616 | 0.826 |
| Number of observations | 18,787 | 786 | 16,833 | 739 | 18,952 | 792 |
| Number of unique firms | 3,985 | 200 | 3,744 | 196 | 3,988 | 201 |
... not applicable
Source: Authors’ calculations based on Statistics Canada's Business Linkable File Environment. |
||||||
5. Conclusion
5.1 Summary of empirical results
In this study, the impact of federal government innovation support expenditures on three performance indicators—firm revenues, profits and employment—was estimated. Using new data from BIGS programs and the B-LFE, the study measured the mixed effects of innovation support and R&D expenditures by performance indicator.
- The key interest of this study is the impact of government support (INNOFUNDING), and the findings indicate that its impact varies depending on the outcome variable being measured. Specifically, when firm revenue was considered, INNOFUNDING did not show a significant effect in all models. However, when firm profits were examined, INNOFUNDING had a negative and significant effect in all models, except for U.S.-controlled firms, where the effect was not significant. Furthermore, a positive and significant relationship between INNOFUNDING and employment levels was observed. This effect was consistent across all models, suggesting that a higher level of government support in the previous year leads to increased employment the following year for all firms, regardless of whether they are exporters or non-exporters and whether they are Canadian- or U.S.-controlled. The magnitude of the impact of BIGS funding was expected to be small although positive and significant. The end of the study period was marked by a difficult economic situation with the COVID-19 pandemic; as a result, it is quite possible that the impact of BIGS was negligible compared with the economic difficulties faced by businesses.
- R&D expenditures are another key variable in the study, and the findings reveal that their effect varies depending on the outcome measured. When the effect of the previous year’s R&D on firm revenue was measured, there was no significant relationship across all models, except for Canadian- and U.S.-controlled firms. In the case of Canadian-controlled firms, R&D had a significant and positive relationship with revenues, while the relationship was significant and negative for U.S.-controlled firms. However, when the effect of R&D on firm profits was assessed, a significant and negative relationship was observed across all models, except for U.S.-controlled firms, where it was insignificant. Similar to INNOFUNDING, R&D expenditures demonstrated a positive and significant effect on employment levels across all models. This indicates that higher R&D expenditures in the previous period lead to higher employment the following year regardless of the model used. In the analysis, the complementarity between INNOFUNDING and R&D was tested, but no significant effects were found; therefore, the results were not reported.
- Results related to firm characteristics—specifically captured by a firm’s assets and age—demonstrated variability depending on the outcomes that were measured. In terms of firm revenues, assets and firm age had significant and positive effects across all models, with the exception of firm age when considering the revenues of U.S.-controlled firms, where effects were statistically insignificant. These results suggest that firms possessing higher levels of assets and older firms tend to generate higher revenue. However, when the effects of assets and firm age on profits were examined, these variables were not significant across all models. Furthermore, assets and firm age showed significant and negative effects on current levels of employment across all models, except for firm age, which did not have a significant impact on U.S.-controlled firms’ employment. Wages had a positive and significant relationship with revenues in all models.
- The effects of grants and non-repayable contributions, which account for around 75% of total BIGS government support, were also examined (see Table A.1 in Annex). The findings generally align with those of the basic model, with one notable difference. In the case of program support measured by grants and non-repayable contributions, a significant and positive relationship with firm revenue was observed, similar to the results in the basic model, whereas the relationship between INNOFUNDING (the overall amount of government support) and revenue was not found to be statistically significant in the exporter versus non-exporter and Canadian- versus U.S.-controlled models. This suggests that compared with other forms of government support, grants and non-repayable contributions received by firms in the previous period have a more pronounced impact on their current revenue levels. The remaining results for the other variables were similar to the basic model in terms of magnitude and significance.
- The results in this study were obtained from strongly balanced data. However, it is possible to run models with the unbalanced data, where there would be almost 75,000 observations. The results from the unbalanced data did not differ significantly from those obtained through balanced data; therefore, only results from the balanced data were reported.
5.2 Discussion of the findings
The literature on the impact assessment of government support on firm performance and innovation has been characterized by several empirical studies (e.g., Hall & Van Reenen, 2000; Czarnitzki et al., 2004; Radicic et al., 2016) that have often yielded contradictory results and findings. For instance, Link and Scott (2012) found that the Small Business Innovation Research Program in the United States had a large impact on employment growth, yet the effects were, in general, not statistically significant. Czarnitzki et al. (2004) and Hall and Van Reenen (2000) found that R&D tax credits increased R&D engagement at the firm level and therefore increased innovation output. By contrast, Radicic et al. (2016) concluded that the effects of government support on firms’ innovation were rather disappointing. There is also a lack of consensus regarding the application of an appropriate methodology and empirical approach. Moreover, many of these studies used cross-sectional survey data, restricting the application of more robust methodologies, such as panel data models.
This study attempts to make a valuable contribution to the existing empirical literature by presenting new evidence derived from Canadian BIGS programs. The data used in this study contain comprehensive program-level information, which was frequently absent in previous research because of data limitations. Moreover, this dataset allows for the construction of a panel dataset for firms that received support from BIGS programs from 2015 to 2020.
The findings related to the impact of public support programs on firm economic performance reveal that these programs have a statistically significant effect on firm performance; however, the general magnitude of the BIGS programs’ impact is small. Also, both the magnitude and the nature of this impact vary depending on the specific measures of firm performance and the type of business involved. For instance, the findings showed a positive but statistically insignificant impact of these programs on firm revenues for exporting firms and for Canadian- and U.S.-controlled firms. The relationship between program support and revenues was positive and statistically significant in the basic model. Additionally, the results showed a positive and significant effect of INNOFUNDING on increasing employment levels regardless of the model used. However, the effect of INNOFUNDING on profit was significant and negative for all models examined.
Furthermore, the variable of R&D expenditures was included to help explain firm performance. Interestingly, similar to the INNOFUNDING variable, R&D expenditures had a significant and positive impact only on employment levels.
When the disparity in the effects of the BIGS programs between exporting and non-exporting firms was examined, the positive effects were slightly larger for non-exporting firms compared with exporting firms (Table 3). Conversely, the effects of R&D expenditures were slightly larger for exporting firms compared with non-exporting firms. Lastly, the findings show that BIGS programs and R&D expenditures had greater effects on employment levels for U.S.-controlled firms compared with Canadian-controlled firms (Table 4).
Additionally, a separate model was tested to determine the impact of a subset of government support; this model restricted the type of support received from BIGS programs to only grants and non-repayable contributions. The results for this separate model resembled the results from the basic model, with the exception that the INNOFUNDING variable was statistically significant for firm revenue in the separate model.
In terms of firm characteristics, the results show that a firm’s assets and age positively affect firm revenue, and this is consistent with the existing literature. However, the results show that there is a negative relationship between a firm’s current assets and employment levels. This suggests that there may be a trade-off for firms between investing in assets and hiring more employees. Increasing expenses because of asset acquisition may affect a firm’s decision to hire fewer employees, thereby leading to a negative relationship between a firm’s assets and employment levels.
The findings on the negative relationship between firm age and employment levels could suggest that, on average, older firms tend to have a larger number of employees than younger firms and have already established a substantial amount of human capital. Additionally, as firms mature, they may reach a stage where they do not significantly increase their annual employment levels. Conversely, younger firms, being in a growth phase, are more likely to have higher hiring rates as they expand. However, it is important to note that the analysis did not specifically measure the threshold level for defining whether a firm is mature or young. Incorporating such a threshold level could better explain the observed negative relationship between firm age and employment.
5.3 Limitations
The study focused exclusively on recipients of BIGS programs, introducing an element of selectivity. This choice, while valid for examining the performance of supported enterprises, may limit the generalizability of findings to the broader business landscape. The hypothesis that all businesses receiving funding from BIGS programs are inherently innovative introduces a potential bias, as not all innovative enterprises may be part of the programs. This assumption may overlook innovative companies not applying for BIGS, leading to incomplete insights into the overall innovative landscape.
The study excluded R&D as an output variable, using it as an independent variable to explain financial performance. While addressing the issue of simultaneity, this approach may overlook the dynamic interplay between R&D and financial outcomes, potentially limiting the depth of the analysis. A lag for INNOFUNDING and R&D was added to attempt to solve the issue of simultaneity. The lag reduces the collinearity between INNOFUNDING and R&D.
The decision not to include interaction terms between province (PROV) and industry dummies was made to avoid the dummy trap issue. This omission, while addressing multicollinearity concerns, may overlook nuanced regional and sectoral variations affecting the study’s variables.
The model’s robustness was assessed by testing it with lagged independent variables. While results remained consistent, this methodology may not capture dynamic shifts and sudden changes in the relationships, potentially limiting the model’s sensitivity to short-term effects.
The inclusion of extensive variables (assets, wages and R&D) and their log transformation introduced potential size bias or scale effects. This approach may mask variations among smaller enterprises and skew the interpretation of results toward larger firms.
The study solely focused on financial performance (revenues, profits and employment), neglecting other dimensions like innovative performance or the owner’s performance, which could provide a more comprehensive understanding of the impact of support programs.
In this analysis, advisory services with a value of support equal to $0 were not considered, and this may overlook the potential value of non-monetary support. Future studies could explore the impact of such services on business outcomes.
Attempting to estimate results for the entire population requires a different modelling approach (e.g., two-stage least squares). This question would have been interesting if this current study had treated R&D as an output, which is not the case.
5.4 Next steps
First, it could be beneficial to expand the analysis to study the impact of BIGS non-financial support such as advisory services, which were not included in this study. This expansion would provide a more comprehensive understanding of the overall impact of BIGS programs. Second, incorporating analysis of other types of businesses, such as clean tech and high-growth firms, could reveal critical patterns and provide deeper insights on specific areas targeted by BIGS programs. Given these potential avenues for further research, future extensions of this study could contribute even more effectively to the existing literature and provide practical advice to policy makers on program design and delivery.
Bibliography
Bérubé, C., & Mohnen, P. (2009). Are firms that receive R&D subsidies more innovative? Canadian Journal of Economics, 42(1), 206-225. https://doi.org/10.1111/J.1540-5982.2008.01505.X
Binh, Q. & Tung, L. (2020). The Effect of R&D Expenditure on Firm Output: Empirical Evidence from Vietnam*. 379-385. 10.13106/jafeb.2020.vol7.no6.379.
Bronzini, R., & Piselli, P. (2016). The impact of R&D subsidies on firm innovation. Research Policy, 45(2), 442-457. https://doi.org/10.1016/J.RESPOL.2015.10.008
Cirillo, V. (2014). Patterns of innovation and wage distribution. Do “innovative firms” pay higher wages? Evidence from Chile. Eurasian Business Review. 4. 181-206. 10.1007/s40821-014-0010-0.
Crépon, B., Duguet, E., & Mairesse, J. (1998). Research, Innovation and Productivity: An Econometric Analysis at the Firm Level. Working Papers 98-33. Center for Research and Economics and Statistics. https://ideas.repec.org/p/crs/wpaper/98-33.html
Czarnitzki, D., Hanel, P., & Rosa, J. M. (2004). Evaluating the Impact of R&D Tax Credits on Innovation: A Microeconometric Study on Canadian Firms. ZEW Discussion Paper N 04-77, Available at SSRN: https://doi.org/10.2139/SSRN.651341
Czarnitzki, D., & Hussinger, K. (2017). Input and output additionality of R&D subsidies. Applied Economics, 50(12), 1324-1341. https://doi.org/10.1080/00036846.2017.1361010
Dagenais, M., Mohnen, P., & Therrien, P. (2004). Les firmes canadiennes répondent-elles aux incitations fiscales à la recherche-développement? L’Actualité Economique, 80(2), 175-205. https://ideas.repec.org/a/ris/actuec/v80y2004i2p175-205.html
David, P. A., Hall, B. H., & Toole, A. A. (2000). Is public R&D a complement or substitute for private R&D? A review of the econometric evidence. Research Policy, 29(4-5), 497-529. https://ideas.repec.org/a/eee/respol/v29y2000i4-5p497-529.html
De Fuentes, C., Milla, J., Lu, L., & Ahmadi, S. (2021). Final report: Crowding-in or crowding-out? Analysis of innovation government support for firms located in Canada. Treasury Board Canada Report. Ottawa, Canada.
Dimos, C., & Pugh, G. (2016). The effectiveness of R&D subsidies: A meta-regression analysis of the evaluation literature. Research Policy, 45(4), 797-815. https://doi.org/10.1016/J.RESPOL.2016.01.002
Fedyunina, A., & Radosevic, S. (2022). The relationship between R&D, innovation and productivity in emerging economies: CDM model and alternatives. Economic Systems, 46(3), 100998. https://doi.org/10.1016/J.ECOSYS.2022.100998
Gui-long, Z., Yi, Z., Kai-hua, C. & Jiang, Y. (2017). The impact of R&D intensity on firm performance in an emerging market: Evidence from China’s electronics manufacturing firms. Asian Journal of Technology Innovation. 25. 1-20. 10.1080/19761597.2017.1302492.
Le, S. T. K. (2020). Measuring Innovation Efforts of Developing Countries: Empirical evidence from Vietnam. Journal of Innovation Economics, 33(3), 163-194. https://ideas.repec.org/a/cai/jiedbu/jie_033_0163.html
Link, A. & Scott, J. (2012). The Small Business Innovation Research Program, ISSUES in Science and Technology, 89-92. http://www.issues.org/28.4/realnumbers.html R
Lööf, H., Mairesse, J., & Mohnen, P. (2017). CDM 20 years after. Economics of Innovation and New Technology, 26(1-2), 1-5. https://doi.org/10.1080/10438599.2016.1202522
Lu, H., De Fuentes, C., Milla, J., & Ahmadi, S. (2022). Government Subsidies as a Risk-Sharing Policy Tool in Innovation Investment. IZA Discussion Paper No. 15725. Available at SSRN: https://doi.org/10.2139/SSRN.4281280
Mairesse, J., Mohnen, P., & Kremp, E. (2005). The Importance of R&D and Innovation for Productivity: A Reexamination in Light of the French Innovation Survey. Annales d’Économie et de Statistique, 79(80), 487. https://doi.org/10.2307/20777586
OECD (2015). Frascati Manual 2015: Guidelines for Collecting and Reporting Data on Research and Experimental Development, OECD Publishing, Paris, http://oe.cd/frascati
OECD & Eurostat (2018). Oslo Manual 2018: Guidelines for Collecting, Reporting and Using Data on Innovation, 4th Edition, The Measurement of Scientific, Technological and Innovation Activities, OECD Publishing, Paris / Eurostat, Luxembourg, https://doi.org/10.1787/9789264304604-en
Radicic, D., Pugh, G., Hollanders, H., Wintjes, R., & Fairburn, J. (2015). The impact of innovation support programs on small and medium enterprises innovation in traditional manufacturing industries: An evaluation for seven European Union regions. Environment and Planning C: Government and Policy, 34(8), 1425-1452. https://doi.org/10.1177/0263774X15621759
Shapira, P., & Youtie, J. (2016). The impact of technology and innovation advisory services. Chapters in: Edler, J., Cunningham, P., Gök, A., & Shapira, P. (ed.), Handbook of Innovation Policy Impact, chapter 6, pages 161-195. Edward Elgar Publishing. https://ideas.repec.org/h/elg/eechap/16121_6.html
Statistics Canada. (2022). Foreign control in the Canadian economy, 2019. Ottawa, Canada : Statistics Canada, January. https://www150.statcan.gc.ca/n1/daily-quotidien/220131/dq220131b-eng.htm
Annex
| Variables | Model 1: log_Revenue | Model 2: log_Profit | Model 3: log_Employment |
|---|---|---|---|
| L.log_Grant_NonRepayable | |||
| Coefficient | 0.006Note ** | -0.007Note * | 0.004Note *** |
| Robust standard error | (0.003) | (0.004) | (0.001) |
| L.log_R&D | |||
| Coefficient | 0.003 | -0.008Note *** | 0.008Note *** |
| Robust standard error | (0.002) | (0.003) | (0.001) |
| log_Assets | |||
| Coefficient | 0.332Note *** | -0.002 | -0.391Note *** |
| Robust standard error | (0.020) | (0.037) | (0.020) |
| log_Age | |||
| Coefficient | 0.646Note *** | -0.134 | -0.633Note *** |
| Robust standard error | (0.057) | (0.091) | (0.037) |
| log_Wages | |||
| Coefficient | 0.364Note *** | Note ...: not applicable | Note ...: not applicable |
| Robust standard error | (0.020) | Note ...: not applicable | Note ...: not applicable |
| log_Revenue_hat | |||
| Coefficient | Note ...: not applicable | 1.033Note *** | Note ...: not applicable |
| Robust standard error | Note ...: not applicable | (0.070) | Note ...: not applicable |
| log_Profit_hat | |||
| Coefficient | Note ...: not applicable | Note ...: not applicable | 1.335Note *** |
| Robust standard error | Note ...: not applicable | Note ...: not applicable | (0.042) |
| Constant | |||
| Coefficient | 3.401Note *** | -0.065 | -9.500Note *** |
| Robust standard error | (0.570) | (0.655) | (0.311) |
| R-squared | 0.324 | 0.211 | 0.619 |
| Number of observations | 20,543 | 18,473 | 20,717 |
| Number of unique firms | 4,291 | 4,041 | 4,294 |
... not applicable
Source: Authors’ calculations based on Statistics Canada's Business Linkable File Environment. |
|||
| Variables | Model 1: log_Revenue | Model 2: log_Profit | Model 3: log_Employment |
|---|---|---|---|
| log_INNOFUNDING | |||
| Coefficient | 0.003Note *** | -0.001 | 0.005Note *** |
| Robust standard error | (0.001) | (0.001) | (0.001) |
| log_R&D | |||
| Coefficient | 0.002 | -0.001 | 0.011Note *** |
| Robust standard error | (0.002) | (0.002) | (0.001) |
| log_Assets | |||
| Coefficient | 0.356Note *** | 0.056Note *** | 0.231Note *** |
| Robust standard error | (0.023) | (0.019) | (0.014) |
| log_Age | |||
| Coefficient | 0.574Note *** | 0.079Note * | 0.312Note *** |
| Robust standard error | (0.046) | (0.045) | (0.028) |
| log_Wages | |||
| Coefficient | 0.365Note *** | Note ...: not applicable | Note ...: not applicable |
| Robust standard error | (0.020) | Note ...: not applicable | Note ...: not applicable |
| log_Revenue_hat | |||
| Coefficient | Note ...: not applicable | 0.897Note *** | Note ...: not applicable |
| Robust standard error | Note ...: not applicable | (0.020) | Note ...: not applicable |
| log_Profit_hat | |||
| Coefficient | Note ...: not applicable | Note ...: not applicable | 0.094Note *** |
| Robust standard error | Note ...: not applicable | Note ...: not applicable | (0.007) |
| Constant | |||
| Coefficient | 3.332Note *** | 0.380 | -2.556Note *** |
| Robust standard error | (0.457) | (0.445) | (0.207) |
| R-squared | 0.364 | 0.525 | 0.390 |
| Number of observations | 24,403 | 22,770 | 21,913 |
| Number of unique firms | 4,315 | 4,164 | 4,072 |
... not applicable
Source: Authors’ calculations based on Statistics Canada's Business Linkable File Environment. |
|||
- Date modified: