
Reports on Special Business Projects
The Relationship between Management Practices, Long-term Strategic Directions and the Economic Performance of Enterprises

Archived Content
Information identified as archived is provided for reference, research or recordkeeping purposes. It is not subject to the Government of Canada Web Standards and has not been altered or updated since it was archived. Please "contact us" to request a format other than those available.
by Julio Miguel Rosa
Centre for Special Business Projects
Acknowledgements
I would like to thank the following individuals for their support, encouragement and feedback on this report: Dany Brouillette from the Bank of Canada for his sound advice and suggestions, as well as my colleagues Frances Anderson and Daouda Sylla. Finally, special thanks to my manager at the Centre for Special Business Projects, George Sciadas, for the institutional review of this report.
Summary
This study is part of the movement in the literature that supposes that entrepreneurship is an important factor in economic development and growth. A company’s success or failure is largely determined by the quality of corporate decisions made by the entrepreneur. However, since business decisions are intangible, their impact on a company’s performance is difficult to measure. This analysis aims to quantify the impact of business decisions. To measure intangibles, we developed indexes to measure a company’s management practices and long-term strategic directions, much like those developed by Bloom and Van Reenen (2007) and Brouillette and Ershov (2014).
Based on a linkage between data from Statistics Canada’s Survey of Innovation and Business Strategy (SIBS) 2012, administrative data and data in the Business Register, this analysis reveals that the effects of these indexes are significant, but have a low impact on the performance of enterprises.
Specifically, an econometric analysis indicates that management practices and long-term strategic directions led to an increase of no more than 2 percentage points in sales and net profits per employee, regardless of the market conditions in which the enterprise operates. However, the effect on a company’s ability to innovate is much more pronounced. For all enterprises, an increase in the management practice index increases a company’s probability of innovating by 38 percentage points and increases a company’s average number of innovative products or processes by 48 percent. More specifically, a one-point increase in the long-term strategic directions index resulted in the average number of innovative products or processes rising from 0.4 to 0.9 for young companies operating in emerging markets and from 1.7 to 2.9 for high-growth companies.
1. Introduction
Entrepreneurs create enterprises, innovate and make them grow, but they also organize, manage and determine the strategies for their enterprise. An enterprise’s success and survival are closely linked to its tangible assets, such as investments in equipment, and to its intangible assets, such as good management practices and its strategic directions. While intangible assets are difficult to define and measure, they are increasingly mentioned in the literature (Bloom et al. 2012, 2013) as the main drivers of the productivity gains in modern economies. This study aims to analyze the relationship between management decisions and enterprises’ innovation and financial results.
A recent study by Brouillette and Ershov found a positive correlation between management practices and innovation across all industry sectors, as well as between management practices, sales and profits in Canada’s manufacturing sector. The study also demonstrated that large businesses are generally more likely to have better management practices. Using a similar analytical framework and more recent data, our study will revisit the link between intangible assets and business performance using the most recent data from the Survey of Innovation and Business Strategy (SIBS) 2012 linked with data from Statistics Canada’s Linkable File Environment (LFE).Note This relationship is assessed in the different economic contexts in which enterprises operate. Management decisions are assessed based on the company’s employment growth (high, moderate or low) and on market conditions. Market conditions comprise a combination of the company’s maturity (young or experienced) and the status of the market (well-established or emerging).
Analyzing how management practices affect the economic performance of enterprises is not new (Bloom and Van Reenen 2007, 2010), nor is the idea that the long-term strategic directions affect the performance of enterprises (Narver and Slater 1990). In fact, management practices act as an organizational lever for creating psychological conditions that favour employee engagement (Tremblay et al. 2005). Furthermore, the long-term strategic directions correspond to the enterprise’s ongoing efforts to achieve superior organizational performance and better profits at the lowest cost (Yang et al. 2015).
This study adds to the conceptual framework defined by Bloom and Van Reenen (2007) by focusing on the following considerations:
- The effect of intangible assets on the performance of enterprises is measured by looking at management practices and long-term strategic directions.
- The relationship between management practices, long-term strategic directions and enterprise performance is evaluated by looking at sales, profits and innovation.
- The effects of entrepreneurs’ decisions about to management practices and long-term strategic directions on performance will be examined based on the market conditions in which enterprises operate. To illustrate the market conditions, we will create an entrepreneurship classification is created that compares the enterprise’s level of maturity (young vs. experienced) and market status (well-established vs. emerging).
2. Data sources and concepts
2.1 Target population
The estimates presented in this study are produced using two separate data sources: Statistics Canada’s Survey of Innovation and Business Strategy (SIBS) 2012, and Statistics Canada’s Linkable File Environment (LFE), which contains information from the Business Register, administrative data and approximately 15 surveys.
Using LFE data made it possible to add administrative data that not available in the SIBS, as well as variables such as employment over several years, which allowed the calculation of the compound annual growth rate (CAGR) for employment for the 2009 to 2012 period.
This study only looks at small and medium enterprises (SMEs) surveyed in the SIBS 2012 with at least 10 employees, but no more than 250 employees, and with declared revenues of $250,000 or more.Note
2.2 Measuring management practices and long-term strategic directions
2.2.1 Management practices index
To calculate the management practices index (MP_INDEX), this study used the same methodology as the 2014 Brouillette and Ershov study, which was inspired by the conceptual framework introduced by Bloom and Van Reenen (2007). Calculation of the index was adjusted to the design of the Survey of Innovation and Business Strategy 2012. To build this index, 19 questions from the SIBS 2012 were used (see Appendix B for additional information). Each question and sub-question used to calculate the index was assigned a numerical score. The maximum number of criteria is 19,Note meaning that the maximum total score that an enterprise could get is 19. The index value is the sum of the numerical scores divided by the number of criteria (MP_INDEX= (total numerical score/19)). Standardizing the MP_INDEX ensures that its value is between 0 and 1. A higher score indicates that the enterprise has good management practices. It may be that the enterprise uses several management practices or that it uses some management practices with greater intensity.
2.2.2 Long-term strategic directions index
The long-term focus index (STRAT_LT_INDEX) was built using the same approach as the management practices index. However, the total maximum score for this index is 12 (see Appendix C for more information). A higher score indicates that the enterprise takes more new, long-term initiatives (mainly marketing methods, business activities and corporate practices) or that it monitors performance indicators or launches new/improved product and services more frequently.
2.3 Definition of employment growth levels
The calculation method for the different employment growth levels was inspired by international recommendations set out in the Eurostat-OECD Manual on Business Demography Statistics (Eurostat 2007). Three employment growth levels were calculated: low-growth enterprises (LGEs), moderate-growth enterprises (MGEs), and high-growth enterprises (HGEs). These three growth levels were defined as follows:
- High-growth enterprises were those that posted average annualized employment growth greater than 20 percent over a three-year period and that had at least 10 employees at the beginning of the observation period.
- Moderate-growth enterprises were those that posted average annualized employment growth greater than 5 percent and less than (20%) percent over a three-year period and that had at least 10 employees at the beginning of the observation period.
- Low-growth enterprises were those that posted average annualized employment growth of 5 percent or less over a three-year period and that had at least 10 employees at the beginning of the observation period.
The compound annual growth rate (CAGR) of employment for the 2009 to 2012 period was calculated using the following formula:
Where represents the number of years separating two periods and represents the number of employees. Enterprises that owed their growth to a merger, acquisition or restructuring during the observation period were excluded from the study.
2.4 Classification of enterprises’ market conditions
Several aspects of entrepreneurship have been studied in recent years (Julien and Cadieux 2010; Turcan 2013), particularly business creation, innovation, value creation and risk-taking. But none of these studies has empirically examined the relationship between enterprise maturity (young vs. experienced) and market status (well-established vs. emerging).Note
Figure 1 effectively illustrates the classification of this decision-making environment for entrepreneurs. It is within this framework that we will analyze how management practices and strategic directions affect enterprise performance.
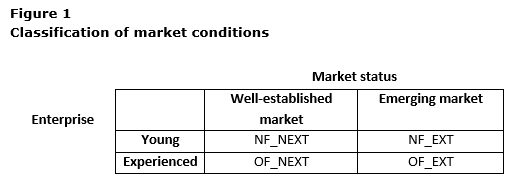
Our conceptual framework defines four market statuses for entrepreneurship as follows:
- Quadrant (NF_NEXT): an enterprise may be young or new and operate in a well-established market and has not introduced changes to its business activities;
- Quadrant (OF_NEXT): an enterprise may be experienced and operate in a well-established market and has not introduced changes to its business activities;
- Quadrant (NF_EXT): an enterprise may be new and operate in an emerging market because it has introduced major changes to its business activities;
- Quadrant (OF_EXT): an enterprise may be experienced and operate in an emerging market and has introduced major changes to its business activities.
An enterprise is considered young if it was established within the past 10 years, which includes start-ups. An emerging market is a market that has introduced a change to its business activities in or outside Canada. These changes can be acquisitions or mergers with other businesses, opening a new facility, increasing the company’s capacity to produce goods or provide services, or improving its distribution or logistics capacity.Note
In Quadrant (NF_NEXT), we find a type of creative entrepreneurship that characterizes young enterprises that reproduce or imitate something that is done elsewhere in the market. Only 9 percent of enterprises employ this type of entrepreneurship. These enterprises are not particularly innovative, as only 66 percent innovate and, on average, they produce less than one innovative product per enterprise (see Table 1). The enterprises in this category have a higher-than-average index for management practices, but a lower-than-average index for long-term strategic directions. This makes sense considering the enterprises are young and their long-term strategies may not yet be fully developed.
In Quadrant (OF_NEXT), we find the most common type of entrepreneurship, which is used by 55 percent of enterprises. These enterprises do not seek to grow their market or strive to be particularly innovative. These companies mainly do reproduction. As seen in Table 1, only 56 percent of these enterprises innovate. The enterprises in this category are the least structured in terms of management practices and long-term strategic directions, given that they have relatively low indexes for both.
In Quadrant (NF_EXT), we find a form of entrepreneurship that is very dynamic and innovative. The enterprises in this category actively seek new business opportunities. Only around 6 percent of enterprises practice this form of entrepreneurship, but of those that do, 79 percent innovate and produce, on average, 2.3 innovative products (see Table 1). These enterprises are very concerned with business practices and long-term strategic directions (according to Table 1, these scores are above average).
In Quadrant (OF_EXT), we find a type of entrepreneurship that aims to expand its market within Canada or abroad. These enterprises seek capital growth. This form of entrepreneurship is used by 30 percent of enterprises. These enterprises have the highest scores for management practices and long-term strategic directions. According to Table 1, they are the most innovative (86 percent) and produce, on average, 12.3 innovative products and processes per enterprise.
3. Descriptive statistics
Entrepreneurs adjust their enterprise management practices to the economic environment in which their businesses operate. The enterprise’s employment growth rate and maturity as well as market conditions make up the environment in which decisions about management practices and long-term strategic directions are made.
Table 1 indicates that, on average, the indexes for management practices and long-term strategic directions are higher when enterprises have more than 10 years of experience and operate in an emerging market (OF_EXT), with indexes of 0.52 and 0.51 respectively. This result seems to indicate that more business experience leads to better practices, particularly when an enterprise operates in a market that experiences frequent changes in trade activities.
Even though high-growth enterprises have, on average, a higher index of management practices, the density distribution (Appendix D, Figure 3) clearly shows that more moderate-growth enterprises have good management practices. Figure 4 in Appendix D shows that enterprises have similar behaviour relating to long-term strategic directions, regardless of their growth rate, except for low-growth enterprises, which tend to have a lower index, an indication that they have fewer long-term strategic directions.
The distribution of the indexes for management practices and long-term strategic directions (Appendix D, Figures 5 and 6) shows that young enterprises in a well-established market (NF_NEXT) often have lower indexes than other enterprises.
It is interesting to note that two subsamples stand out from the others: moderate-growth enterprises (Column 2) and experienced enterprises targeting emerging markets (Column 7). These enterprises sell more than average ($303,046 and $330,219, respectively); have a higher-than-average percentage of innovative enterprises (78 and 86 percent); produce more innovative products and processes (8.2 and 13.3, respectively); have a higher percentage of R&D performers (39.2 and 57.1 percent, respectively); have a higher percentage of employees with a university degree than other enterprises (18 and 20.7 percent, respectively); have higher profits than average; have a higher percentage of operations outside Canada (26.4 and 43.1 percent, respectively); and are found more frequently in the manufacturing sector (19.8 and 26.4 percent respectively).
| Variables (2012 reference year) | HGE (1) |
MGE (2) |
LGE (3) |
NF_NEX (4) |
OF_NEXT (5) |
NF_EXT (6) |
OF_EXT (7) |
Full sample (8) |
|---|---|---|---|---|---|---|---|---|
| averages | ||||||||
| Management practices and long-term strategies | ||||||||
| Management practices index | 0.42 | 0.41 | 0.40 | 0.42 | 0.35 | 0.43 | 0.52 | 0.40 |
| Long-term strategic directions index | 0.42 | 0.44 | 0.43 | 0.41 | 0.40 | 0.47 | 0.51 | 0.43 |
| Size of enterprise | ||||||||
| Number of employees | 58.7 | 54.0 | 41.0 | 42.9 | 41.0 | 47.9 | 66.3 | 47.2 |
| Employment growth | ||||||||
| Annual growth based on 2009–2012 employment (%) | 35.6 | 11.2 | -1.9 | 12.5 | 2.4 | 23.8 | 8.7 | 6.8 |
| Economic performance | ||||||||
| Sales per employee ($ thousands) | 210,231 | 303,046 | 242,791 | 275,331 | 231,402 | 207,793 | 330,219 | 256,959 |
| Net profit per employee (# thousands) | 7,758 | 11,288 | 9,177 | 7,351 | 10,886 | 3,352 | 10,035 | 9,637 |
| Innovative enterprises, at least one type of innovation (%) | 68.1 | 78.0 | 58.9 | 66.2 | 56.5 | 79.5 | 85.6 | 65.8 |
| Number of innovative products and processes | 1.7 | 8.2 | 1.2 | 0.4 | 1.0 | 2.3 | 12.3 | 3.4 |
| Other enterprise characteristics | ||||||||
| Performs R&D (%) | 21.0 | 39.2 | 38.6 | 24.6 | 33.6 | 23.5 | 57.1 | 36.6 |
| Physical and intangible assets per employee ($ thousands) | 110,512 | 87,650 | 136,575 | 46,134 | 120,094 | 147,442 | 151,897 | 118,478 |
| Share of profit centres (%) | 15.5 | 20.3 | 21.4 | 19.5 | 18.1 | 14.0 | 29.0 | 20.3 |
| Average age of enterprise (years) | 11.2 | 17.1 | 18.8 | 8.3 | 20.0 | 7.7 | 19.4 | 17.3 |
| Share of employees with a university degree (%) | 13.8 | 18.0 | 17.0 | 14.0 | 16.0 | 17.8 | 20.7 | 16.9 |
| Operations outside Canada (%) | 12.8 | 26.4 | 20.3 | 0.1 | 16.3 | 23.7 | 43.1 | 21.2 |
| Share of competitors in the main market (%) | 4.6 | 4.9 | 4.9 | 5.0 | 4.8 | 5.1 | 5.0 | 4.9 |
| Share of enterprises in the manufacturing sector (%) | 12.0 | 19.8 | 19.0 | 7.8 | 18.9 | 11.4 | 26.4 | 18.4 |
| Share of enterprises in the service-producing sector (%) | 51.4 | 61.1 | 61.9 | 75.1 | 57.1 | 53.7 | 61.5 | 60.3 |
| Share of enterprises in the rest of the economy (%) | 36.6 | 19.1 | 19.1 | 17.1 | 24.0 | 34.9 | 12.1 | 21.3 |
| Number of enterprises | ||||||||
| Non-weighted total | 313 | 919 | 1,719 | 270 | 1,639 | 164 | 878 | 2,951 |
| Sources: SIBS 2012 and Linked File Environment (LFE). | ||||||||
It is worth noting that moderate-growth enterprises and experienced enterprises operating in emerging markets (OF_EXT) performed the best, on average, in the areas of research and development, and innovation.
4. Modelling the relationship between intangible assets and business performance
This section provides a graphic representation of the estimated model. Figure 2 shows a relational diagram of the key explanatory variables, namely management practices (MP_INDEX) and long-term strategic directions (STRAT_LT_INDEX) with explanations of each variable’s effect on business performance, measured by: sales per employee; net profit per employee; innovation and the number of innovative products. The other control variables (see Appendix A) are illustrated in Figure 2, but they were not interpreted in this studyNote .
This model was evaluated under various economic conditions, according to enterprise growth level and market conditions. Detailed descriptions of all variables are provided in Appendices A, B and C.
4.1 Relationship model
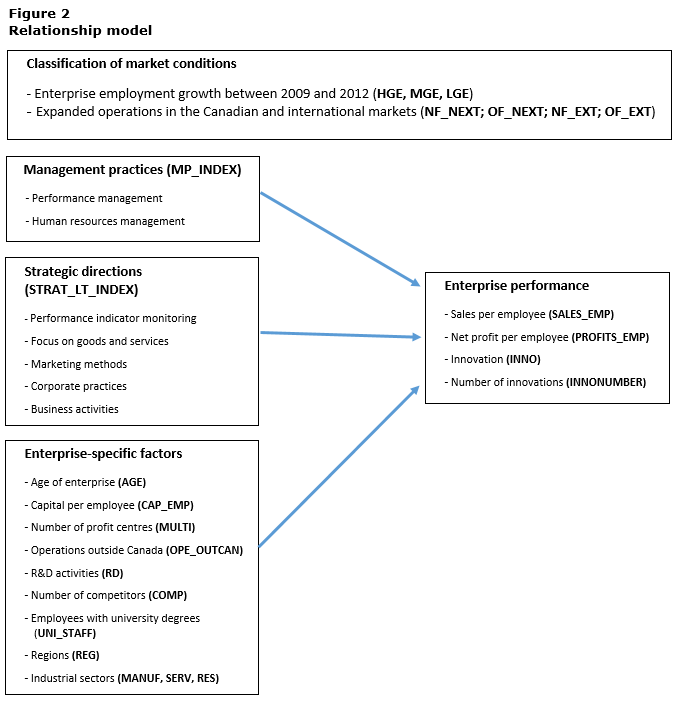
Description for Figure 2
This figure is a schematic representation of the relationships between the variables of the estimated model. The first box (Classification of enterprise economic conditions) represents the different dimensions on which the estimates will be based; that is to say, enterprise employment growth and expanded operations in the Canadian and international markets. Then the following boxes (Management practices and Strategic direction) successively represent the independent variables of interest build from the question about the performance management; human resources management; performance indicator monitoring; focus on goods and services; marketing methods; corporate practices and business activities. The other control variables are represented in the box Enterprise-specific factors (see Appendix B and C for definitions and more details), that is say, the age of the enterprise; capital per employee; number of profit centres; operations outside Canada; R&D activities; the number of competitors; employees with university degrees; regions and industrial sectors. Finally the last box shows the dependent variables to measure the performance of the enterprise; that is say, sales per employee, profits per employee, whether the company innovates or not and the number of innovations.
Formally, the estimated relationship is formulated as follows:
Where is the vector of enterprise performance variables, which respectively are: sales per employee (SALES_EMP); net profit per employee (PROFITS_EMP); one of the four types of innovation (INNO), namely innovations in processes, products, marketing practices or corporate practices; and number of innovations (INNONUMBER).
The two key control variables are represented by the indexes for management practices (MP_INDEX) and long-term strategic directions (STRAT_LT_INDEX).
Vector X represents the other control variables, namely: age of enterprise (AGE); physical and intangible capital per employee (CAP_EMP); number of profit centres (MULTI); operations outside Canada (OPE_OUTCAN); research and development activity (RD); market competitiveness based on number of competitors (COMP); level of expertise based on number of employees with a university degree (UNI_STAFF); regions (REG) represented by the provinces; and three sector groups: manufacturing (MANUF), services (SERV) and the rest (RES).
Estimates were made using ordinary least square analysis (OLS); (LOGIT) and (TOBIT), depending on the nature of the dependent variable. All estimates were calculated using the Stata ‘vce(robust)’ option to produce a more accurate heteroscedastic estimate of the variance-covariance matrix for error terms. Also, all estimates were weighted using the survey weights. Finally to minimize the loss of observations while estimating dependent variables expressed as logarithms,Note in particular for the model estimation (TOBIT), a slight transformation of the dependent variable was done to ensure that censored values were fixed to an amount that was slightly less than the minimum uncensored value of the log difference (see Cameron and Trivedi 2009, p. 532).
4.2 Results of the econometric estimations
This section presents the marginal effects of the model estimates presented in Section 4.1. Only the marginal effects for management practices and long-term strategic directions are indicted in the result tables.
Note that even though the estimates suggest a correlation between enterprise decisions and business performance, this does not mean there is a causal relationship. In addition, since we were not able to find good instrumental variables, we did not address endogenous questions, namely whether management decisions result in improved business performance or whether strong business performance causes enterprises to adopt good management practices.
4.2.1 The relationship between management practices, long-term strategic directions and sales per employee
Table 2 indicates that only the marginal effects for the management practices index of experienced enterprises in emerging markets (OF_EXT) and the long-term strategic directions indexes for high-growth enterprises (HGEs) and young enterprises in well-established markets (NF_NEXT) are significant.
| Sales per employee | ||||||||
|---|---|---|---|---|---|---|---|---|
| High-growth enterprises (2009 to 2012) (HGE) |
Moderate-growth enterprises (2009 to 2012) (MGE) |
Low-growth enterprises (2009 to 2012) (LGE) |
Young enterprises in a well-established market (NF_NEXT) |
Experienced enterprises in a well-established market (OF_NEXT) |
Young enterprises in an emerging market (NF_EXT) |
Experienced enterprises in an emerging market (OF_EXT) |
Full sample (FULL) |
|
| ordinary least square regressions | ||||||||
| MP_INDEX | 0.136 (0.210) |
1.115Note * (0.521) |
0.353 (0.309) |
0.288 (0.362) |
0.171 (0.322) |
-0.200 (0.427) |
1.091Note ** (0.340) |
0.428 (0.315) |
| STRAT_LT_INDEX | -0.819Note ** (0.300) |
-0.057 (0.560) |
0.591 (0.356) |
1.890Note *** (0.550) |
-0.244 (0.439) |
0.187 (0.471) |
0.480 (0.361) |
0.511 (0.376) |
| R2 | 0.599 | 0.318 | 0.183 | 0.654 | 0.144 | 0.757 | 0.321 | 0.119 |
| Number of enterprisesTable 2 Note 1 | 295 | 875 | 1,627 | 255 | 1,554 | 148 | 840 | 2,797 |
|
||||||||
The model estimates using the full sample (FULL) shows that management practices and long-term strategic directions do not have a significant impact on sales per employee.
The estimates for the other subsamples show that a one-point increase in the management practices index (e.g., going from 0.50 to 0.51) results in a 1.09 percent increase in sales per employee for experienced enterprises operating in emerging markets (OF_EXT) and a 1.1 percent increase in sales per employee for moderate-growth enterprises (MGE). The results are aligned with the descriptive analysis. The (MGE) and (OF_NEXT) groups of enterprises are those that have, on average, the highest sales per employee (more than $300,000 per employee). For both groups, management practices are a significant factor affecting their trade performance. Even though the effect is small, it nonetheless appears to be tangible.
Long-term strategic directions significantly influence young enterprises operating in well-established markets, as a one-point increase in this index results in 1.9 percent improvement in sales per employee (NF_NEXT). We should note that this group of enterprises ranks third for sales per employee (see Table 1).
Finally, the estimates show that an increase in the long-term strategic directions index results in a 0.8 percent decrease in sales per employee in high-growth enterprises. This somewhat surprising result may reflect the fact that long-term strategic directions implemented more recently (after 2009) may not yet have had a tangible effect on the enterprises’ recent performance.
4.2.2 The relationship between management practices, long-term strategic directions and net profits per employee
| Net profits per employee | ||||||||
|---|---|---|---|---|---|---|---|---|
| High-growth enterprises (2009 to 2012) (HGE) |
Moderate-growth enterprises (2009 to 2012) (MGE) |
Low-growth enterprises (2009 to 2012) (LGE) |
Young enterprises in a well-established market (NF_NEXT) |
Experienced enterprises in a well-established market (OF_NEXT) |
Young enterprises in an emerging market (NF_EXT) |
Experienced enterprises in an emerging market (OF_EXT) |
Full sample (FULL) |
|
| ordinary least square regressions | ||||||||
| MP_INDEX | -1.040Note * (0.433) |
0.926 (0.841) |
1.388Note * (0.495) |
1.056Note * (0.507) |
1.514Note *** (0.476) |
-0.990 (1.182) |
-0.514 (0.614) |
0.878Note * (0.441) |
| STRAT_LT_INDEX | 0.204 (0.815) |
-1.349 (0.827) |
0.149 (0.700) |
-0.165 (0.984) |
-0.927 (0.617) |
0.142 (1.096) |
0.657 (0.694) |
-0.020 (0.601) |
| R2 | 0.497 | 0.269 | 0.290 | 0.716 | 0.311 | 0.531 | 0.198 | 0.197 |
| Number of enterprisesTable 3 Note 1 | 241 | 743 | 1,244 | 190 | 1,234 | 102 | 702 | 2,228 |
|
||||||||
Table 3 shows that, overall, a one-point increase in the management practices index results in a 0.9 percent increase in net profits per employee, but that decisions on long-term strategic directions did not significantly affect profits per employee.
Enterprises, both young and experienced, operating in well-established markets are more affected by good management practices than enterprises operating in emerging markets. Low-growth enterprises are more affected by good practices than high- or moderate-growth enterprises, as a one-point increase in the index resulted in a 1.4 percent increase in net profit per employee for low-growth enterprises.
4.2.3 The relationship between management practices, long-term strategic directions and innovation
Table 4 shows that better management practices systematically result in an increased probability that an enterprise will innovate. In fact, a one-point increase in the management practices index results in a 38 percentage point increase in the probability that an enterprise will innovate.
The estimated coefficients for management practices are significant for all subsamples, except young enterprises in emerging markets (NF_EXT). The effect of management practices is particularly pronounced for low-growth enterprises, as a one-point increase in the index results in a 59 percentage point increase in the probability that an enterprise in this subsample (LGE) will innovate.
| Innovation | ||||||||
|---|---|---|---|---|---|---|---|---|
| High-growth enterprises (2009 to 2012) (HGE) |
Moderate-growth enterprises (2009 to 2012) (MGE) |
Low-growth enterprises (2009 to 2012) (LGE) |
Young enterprises in a well-established market (NF_NEXT) |
Experienced enterprises in a well-established market (OF_NEXT) |
Young enterprises in an emerging market (NF_EXT) |
Experienced enterprises in an emerging market (OF_EXT) |
Full sample (FULL) |
|
| Logit model (elasticities) | ||||||||
| MP_INDEX | 0.215Note ** (0.108) |
0.209Note *** (0.080) |
0.596Note *** (0.180) |
0.511Note *** (0.157) |
0.361Note ** (0.161) |
0.126 (0.079) |
0.126Note ** (0.057) |
0.386Note *** (0.109) |
| STRAT_LT_INDEX | 0.283Note * (0.152) |
0.177Note ** (0.084) |
-0.457Note * (0.265) |
-0.181 (0.199) |
-0.284 (0.250) |
-0.073 (0.057) |
0.095 (0.071) |
-0.113 (0.166) |
| Pseudo R2 | 0.546 | 0.263 | 0.133 | 0.584 | 0.101 | 0.665 | 0.171 | 0.127 |
| Number of enterprisesTable 4 Note 1 | 302 | 895 | 1,669 | 262 | 1,592 | 154 | 858 | 2,866 |
|
||||||||
An increase in the long-term strategic directions index increases the probability that an enterprise innovate if the enterprise experiences high or moderate employment growth over the 2009 to 2012 period; however, this probability decreases if the enterprise experiences low growth.
4.2.4 The relationship between management practices, long-term strategic directions and the number of product and process innovations.
For the full sample in Table 5, a one-point increase in the management practices index resulted in a 48 percent increase in the number of product or process innovations, while long-term strategic directions had no significant impact on the number of innovative products and processes.
It is particularly worthwhile to note that good management practices resulted in a 96 percent increase in the number of innovative products or processes for experienced enterprises operating in emerging markets (OF_EXT).
Long-term strategic directions also have a significant effect on an enterprise’s number of innovative products or processes, as a one-point increase in this index results the average number of innovative products or processes to rise from 0.4 to 0.9Note for young enterprises operating in emerging markets (NF_EXT). In addition, a one-point increase in the long-term strategic directions index results in a 73 percent increase in the average number of innovative products and processes for high-growth enterprises, with the average number of innovative products and processes jumping from 1.7 to 2.9 per enterprise.
| Number of innovative products and processes | ||||||||
|---|---|---|---|---|---|---|---|---|
| High-growth enterprises (2009 to 2012) (HGE) |
Moderate-growth enterprises (2009 to 2012) (MGE) |
Low-growth enterprises (2009 to 2012) (LGE) |
Young enterprises in a well-established market (NF_NEXT) |
Experienced enterprises in a well-established market (OF_NEXT) |
Young enterprises in an emerging market (NF_EXT) |
Experienced enterprises in an emerging market (OF_EXT) |
Full sample (FULL) |
|
| Tobit model (elasticities) | ||||||||
| MP_INDEX | -0.028 (0.121) |
0.796Note *** (0.161) |
0.307Note ** (0.135) |
0.029 (0.019) |
0.446Note *** (0.129) |
0.080 (0.259) |
0.960Note *** (0.219) |
0.479Note *** (0.152) |
| STRAT_LT_INDEX | 0.728Note *** (0.237) |
-0.027 (0.192) |
0.002 (0.169) |
-0.000 (0.013) |
-0.123 (0.177) |
1.375Note *** (0.460) |
0.250 (0.383) |
0.176 (0.241) |
| Pseudo R2 | 0.325 | 0.234 | 0.116 | 0.327 | 0.080 | 0.415 | 0.201 | 0.104 |
| Number of enterprisesTable 5 Note 1 | 302 | 895 | 1,669 | 262 | 1,592 | 154 | 858 | 2,866 |
|
||||||||
5. Conclusions and foreseeable challenges
This study evaluated the link between management practices, long-term strategic directions and the economic performance of the enterprises. It was found that, overall, these intangible factors had a significant but small effect on business performance. In addition, good management practices had a more frequent and significant influence on business performance than decisions concerning long-term strategic directions.
The descriptive analysis revealed that among the various forms of entrepreneurship, 9 percent are young enterprises operating in well-established markets; 55 percent are experienced enterprises operating in well-established markets; 6 percent are young enterprises operating in emerging markets; and 30 percent are experienced enterprises operating in emerging markets.
The estimates derived from the econometric analysis indicated that management practices and long-term strategic directions led to an increase of 2 percentage points in sales and of 2 percentage points in net profits per employee, regardless of the economic conditions of the market in which the enterprise operates.
However, the effects of these intangible factors seemed to have a much more pronounced effect on a company’s ability to innovate. For all enterprises, an increase in the management practice index increased a company’s probability of innovating by 38 percentage points and increased a company’s average number of innovative products or processes by 48%. In addition, a one-point increase in the long-term strategy index resulted in the average number of innovative products or processes to increase from 0.4 to 0.9 for young enterprises operating in emerging markets and from 1.7 to 2.9 for high-growth enterprises.
The econometric analysis also indicated that management practices and long-term strategic directions had uneven effects, depending on employment growth levels.
A one-point increase in the management practices index resulted in a 1.1 percent increase in sales per employee for moderate-growth enterprises and a 1.4 percent increase in net profits per employee for low-growth enterprises.
This study demonstrates that good management practices increase the probability than an enterprise will innovate, and this is especially true for low-growth enterprises. However, for this same category of enterprises, having good long-term strategic directions decreases the probability of innovating.
To take this analysis further, it would be useful to have intangible entrepreneurship indicators for longer periods. It would also be useful to be able to account for the individual characteristics of the entrepreneurs, such as their education, experience, gender or original nationality. Finally, having good instrumental variables or long series of observations would allow us to answer the question of potential causality, namely: Does good business performance drive enterprises to adopt good management practices, or do enterprises perform well because they have good management practices in place?
References
Bloom, N. and Van Reenen, J. (2007). "Measuring and explaining Management Practices across firms and countries". Quarterly Journal of Economics, vol. 122(4), pp. 1351-1408.
Bloom, N. and Van Reenen, J. (2010). "Why do Management Practices Differ across Firms and Countries". Journal of Economic Perspectives, vol. 24(1), pp. 203-224.
Bloom, N., Eifert, B., McKenzie, D., Mahajan, A. and Roberts, J. (2013). "Does management matter: evidence from India". Quarterly Journal of Economics, vol. 128(1), pp. 1-51.
Brouillette, D. et Ershov, D. (2014). "Pratiques de gestion, concurrence, innovation et performance des entreprises au Canada". Industrie Canada, Document de travail 2014-02.
Bruyat, C., and Julien, P.-A. (2000). Defining the Field of Research in Entrepreneurship. Journal of Business Venturing, vol. 16(2), pp. 165-180.
Cameron, A.C. and Trivedi, P.K., (2009). Microeconometrics Using Stata. Stata Press.
Eurostat (2007). Eurostat-OECD Manual on Business Demography Statistics. Collection: Methodologies and working papers.
Julien, P.A. et Cadieux, L., (2010). "La mesure de l’entrepreneuriat". Institut de la Statistique du Québec, rapport d’étude, Science, Technologie et Innovation.
Naidoo, V., (2010). "Firm survival through a crisis: The influence of market orientation, marketing innovation and business strategy". Industrial Marketing Management, vol. 39(8), pp. 1311-1320.
Narver, J. C. and Slater, S. F. (1990). "The effect of a Market Orientation on Business Profitability". Journal of Marketing, vol. 54(4), pp. 20-35.
Pelham, A. and Wilson, D. (1995). "A longitudinal Study of the Impact of Market Structure, Firm Structure, Strategy, and Market Orientation Culture on Dimension of Small-Firm Performance". Journal of the Academy of Marketing Science, vol. 24(1), pp. 27-43.
Teal, E.J., Upton, N., and Seaman, S.L. (2003). "A Comparative Analysis of Strategic Marketing Practices of High-Growth U.S. Family and Non-Family Firms". Journal of Development Entrepreneurship, vol. 8(2), pp. 177-195.
Thurik, R., Wennekers, S. and Ulhlaner, L.M. (2002). "Entrepreneurship and Economic Performance: A Macro Perspective". Centre for Advanced Small Business Economics, Rotterdam, Netherlands, Eramus University.
Tremblay, M., Chênevert, D; Simard, G; Lapalme, M.E; et Doucet, O. (2005). "Agir sur les leviers organisationnels pour mobiliser le personnel: le rôle de la vision, du leadership, des pratiques de GRH et de l’organisation du travail". Gestion vol. 30(2), HEC Montréal.
Turcan, R.V., (2013). International New Venture Legitimation. An Exploratory Study. Administrative Sciences, vol. 3(4), pp. 237-264.
Yang, M-J., Kueng, L. and Hong, B., (2015). "Business Strategy and the Management of Firms". NBER working paper series 20846. http:www.nber.org/papers/w20846.
Appendices
Appendix A: Description and variable sources
| Variables | Description | Source |
|---|---|---|
| Economic conditions | ||
| HGE – High-growth enterprises | Calculated on the basis of employment data. Business Payrolls Survey PD7 (average employment) | (LFE) |
| MGE – Moderate-growth enterprises | Calculated on the basis of employment data. Business Payrolls Survey PD7 (average employment) | (LFE) |
| LGE – Low-growth enterprises | Calculated on the basis of employment data. Business Payrolls Survey PD7 (average employment) | (LFE) |
| NF_NEXT – Young enterprises in well-established market. | Enterprises 10 years old or less which had no changes in production of goods; provision of services or distribution and logistics in Canada or outside of Canada in the period 2009-2012 (Q15 and Q19). | (SIBS) |
| OF_NEXT – Experienced enterprises in well-established market. | Enterprises 10 years old or more which had no changes in production of goods; provision of services or distribution and logistics in Canada or outside of Canada in the period 2009-2012 (Q15 and Q19). | (SIBS) |
| NF_EXT – Young enterprises in an emerging market. | Enterprises 10 years old or less which had changes in production of goods; provision of services or distribution and logistics in Canada or outside of Canada in the period 2009-2012 (Q15 and Q19). | (SIBS) |
| OF_EXT – Experienced enterprises in an emerging market. | Enterprises 10 years old or more which had changes in production of goods; provision of services or distribution and logistics in Canada or outside of Canada in the period 2009-2012 (Q15 and-Q19). | (SIBS) |
| Enterprise performance | ||
| SALES_EMP | Sales value per employee (gifi_totalsales / lfe_employees) | (LFE) |
| PROFITS_EMP | Net profits value per employee (gifi_netinclossaftertax / lfe_employees) | (LFE) |
| INNO | = 1 if the enterprise has innovated in at least one of the four categories of innovation (product; process; marketing innovation or organizational innovation (Q46; Q82; Q65; Q94). | (SIBS) |
| INNONUMBER | Number of product or process innovations (Q87; Q48). | (SIBS) |
| Enterprise specific factors | ||
| SIZE-_S – Small-sized enterprises | = 1 if employment >= 10 and employment < 50 | (LFE) |
| SIZE-_M – Medium-sized enterprises | = 1 if employment >= 50 and employment < 100 | (LFE) |
| SIZE-_L – Large-sized enterprises | = 1 if employment >= 100 and employment < 250 | (LFE) |
| MANUF – Manufacturing sector | NAICS 31-33 | (SIBS) |
| SERV – Service sector | NAICS 41-44-45-48-49-51-52-53-54-55-56 | (SIBS) |
| RES – Other sector | NAICS 11-21-22-23 | (SIBS) |
| REG – Regions (QC; ON; ATL; CENT; RDC) | QC = 1 if Quebec; | (SIBS) |
| ON = 1 if Ontario; | ||
| ATL = 1 if New Scotia; New Brunswick, Prince Edward Island or Newfoundland and Labrador | ||
| CENT = 1 if Alberta, Manitoba or Saskatchewan | ||
| RDC = 1 if British Columbia, Yukon or Territories | ||
| OPE_OUTCAN | =1 if the enterprise has commercial activities in Canada or outside Canada in the period 2009-2012 (Q16). | (SIBS) |
| R&D | =1 if the enterprise perform R&D activities in Canada or outside of Canada (Q14n) | (SIBS) |
| CAP_EMP | Capital (Physical capital assets and intangibles billion $) per employee ((gifi_totaltangiblecapital + gifi_totalintangiblecapital) / lfe_employees) (2012) | (LFE) |
| MULTI | Number of profit center (Q12) | (SIBS) |
| COMP | Number of competitors in the main market in 2012 | (SIBS) |
| = 1 if 1; = 2 if 2; = 3 if 3; = 4 if 4 or 5; = 5 if 6 to 10; = 6 if 11 to 20; = 7 if 20 or more (Q77) | ||
| AGE | = 2012-Enterprise's birth data | (LFE) |
| UNI_STAFF | Percentage of employees that have an university degree (Q63) | (SIBS) |
Appendix B: Management practice index (MP_INDEX)
| Question | Score |
|---|---|
| Management performance | |
| Q52-Does your enterprise have a systematic process or procedure to resolve problems associated with production of goods or delivery of services? | No = 0 |
| Yes = 1 | |
| Q53-How many key production performance indicators are monitored? | None = 0 |
| At least one = 1 | |
| Q54-How frequently are these key production performance indicators shown to managers of operations? | Never or do not know = 0 |
| Other frequency = 1 | |
| Q55-How frequently are these key production performance indicators shown to workers? | Never or do not know = 0 |
| Other frequency = 1 | |
| Q56-How often these key production performance indicators reviewed by top or middle managers? | Do not know = 0 |
| Rarely = 1/3 | |
| Periodically = 2/3 | |
| Continually = 1 | |
| Q58-What is the timeframe of your enterprise’s production performance targets for its highest selling good or service? | No performance targets = 0 |
| Short term only = 1/3 | |
| Long term only = 2/3 | |
| A mix of short and long term = 1 | |
| Q59-How does your enterprise reward production performance target achievement? | There are no rewards = 0 |
| Only management is rewarded = 1/2 | |
| All staff are rewarded = 1 | |
| Management of human resources practices | |
| Q60-Which of the following best describes the main way employees are promoted? | Effort and abilities = 0 |
| Partially effort; abilities and tenure = 1/2 | |
| mainly effort; abilities and tenure = 1 | |
| Q61-Which of the following best describes your enterprise’s main policy when dealing with employees who do not meet expectations? | They are rarely or never moved from their positions = 0 |
| They are given a certain number of warnings = 1/3 | |
| They are warned, and re-trained, but are rarely removed from their position = 2/3 | |
| They are immediately removed from their position = 1 | |
| Q62-Are employees involved in the decision-making process on task allocation? | No = 0 |
| Yes = 1 | |
| Q64a-Use of personality / attitude tests, intelligence or aptitude tests, work samples. | No = 0 |
| Yes = 1 | |
| Q64b-Use of formal training programs to teach new hires the skills they need to perform their job | No = 0 |
| Yes = 1 | |
| Q64c-The enterprise provides formal training or development programs to employees in order to increase their promo ability. | No = 0 |
| Yes = 1 | |
| Q64d-Use of formal performance agreements based on objectives, quantifiable results are prepared for managerial, supervisory and executive employees at least annually. | No = 0 |
| Yes = 1 | |
| Q64e-Use of formal appraisals are conducted of the majority of non-managerial staff at least annually. | No = 0 |
| Yes = 1 | |
| Q64f-Use of formal appraisals are conducted of the majority of managerial staff at least annually. | No = 0 |
| Yes = 1 | |
| Q64g-At least one of the incentive programs is available to non-managerial and non-supervisory employees: employee stock ownership, profit-sharing, gain-sharing, merit bonus. | No = 0 |
| Yes = 1 | |
| Q64h-At least one of the incentive programs is available to managerial and supervisory employees: employee stock ownership, profit-sharing, gain-sharing, merit bonus. | No = 0 |
| Yes = 1 | |
| Q64i-At least one of the incentive programs is available to all employees: employee stock ownership, profit-sharing; gain-sharing, merit bonus. | No = 0 |
| Yes = 1 |
Appendix C: Index on long-term strategic directions (STRAT_LT_INDEX)
| Question | Score |
|---|---|
| Monitoring of long-term performance indicators | |
| Q4a-Use of gross margin / operating margin growth practices. | No = 0 |
| Yes = 1 | |
| Q4b-Use of sales / income growth practices. | No = 0 |
| Yes = 1 | |
| Q4c-Use of shareholder dividends growth practices. | No = 0 |
| Yes = 1 | |
| Q4d-Use of market / customer share growth practices. | No = 0 |
| Yes = 1 | |
| Q4e-Use of customer satisfaction practices. | No = 0 |
| Yes = 1 | |
| Q4f-Use of increased sale of new products practices. | No = 0 |
| Yes = 1 | |
| Q4g-Use of improved delivery time practices. | No = 0 |
| Yes = 1 | |
| Q4h-Use of other practices. | No = 0 |
| Yes = 1 | |
| Long-term strategic orientations with respect to goods or services | |
| Q5-Which of the following statements best describes the strategic focus of your enterprise with respect to its goods or services? | Do not know = 0 |
| Maintaining or expanding the sales of existing goods or services = 1/2 | |
| Introducing new or significantly improved goods or services regularly = 1 | |
| Long-term strategic orientations with respect to marketing practices or methods | |
| Q6-Which of the following statements best describes the strategic focus of your enterprise with respect to its marketing practices or methods? | Do not know = 0 |
| Maintain or intensify existing marketing practices or methods = 1/2 | |
| Introduce new or significantly improved marketing practices or methods = 1 | |
| Long-term strategic orientations with respect to operations and business activities | |
| Q7-Which of the following statements best describes the strategic focus of your enterprise with respect to its operations and business activities? | Do not know = 0 |
| Maintain and optimize current operations and business activities = 1/2 | |
| Introduce new or significantly improved business activities or processes to its operations = 1 | |
| Long-term strategic orientation with respect to its organizational and management practices | |
| Q8-Which of the following statements best describes the strategic focus of your enterprise with respect to its organizational and management practices? | Do not know = 0 |
| Maintain or optimize organizational and management practices = 1/2 | |
| Introduce new or significantly improved business management practices or change organizational structure = 1 |
Appendix D: Distribution (Weighted density) of management indexes by growth level and economic conditions.
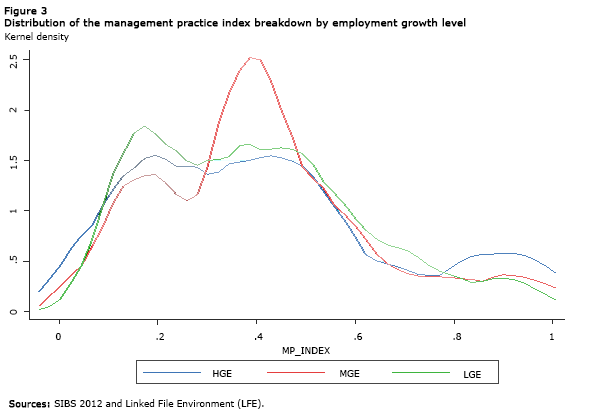
Description for Figure 3
Figure 3 shows the distribution of the Management Practices Index for employment growth levels respectively: high-growth employment; moderate-growth employment and low-growth employment. The results show that the frequency is the highest for enterprises with a moderate growth. Overall the distributions follow the same trends regardless of the level of employment growth.
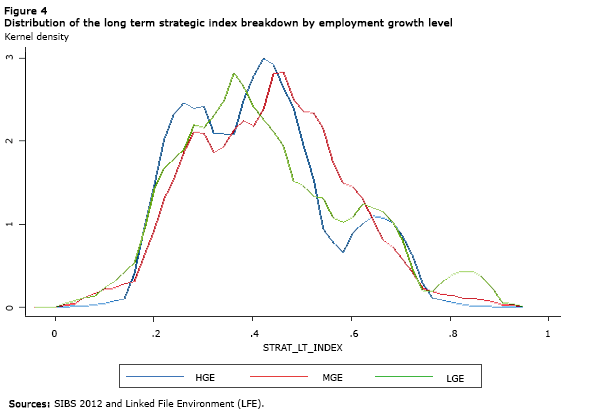
Description for Figure 4
Figure 4 shows the distribution of the index of long-term strategies for respectively: high-growth employment; moderate-growth employment and low-growth employment. The results show that the curves of density follow the same trends regardless of the level of employment growth.
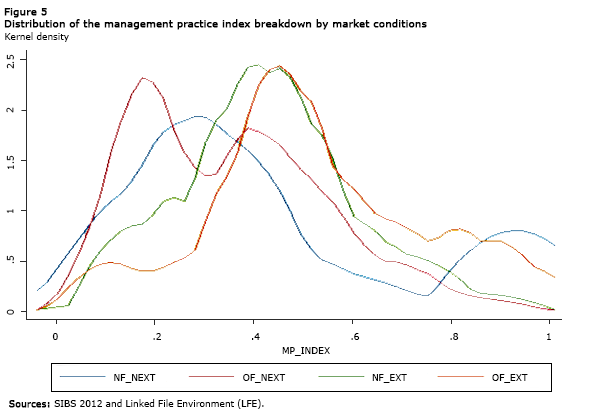
Description for Figure 5
Figure 5 shows the distribution of the management practice index according to whether the enterprise is young in a well-established market; experienced in a well-established market; young in an emerging market or experienced in an emerging market. The results show that the frequencies are the highest for experienced and well-established as well as for those who are experienced in an emerging market.
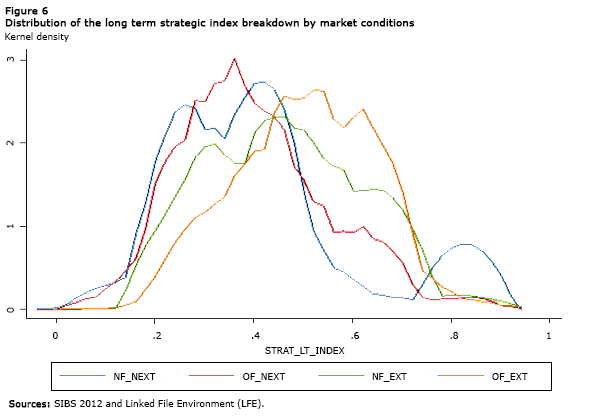
Description for Figure 6
Figure 6 shows the distribution of the index on long-term strategies according to the enterprise is young in a well-established market; experienced in a well-established market; young in an emerging market or experienced in an emerging market. The results show that the frequency is the highest for experienced companies and well.
Appendix E: Econometric estimates on sales per employees
| (1) HE |
(2) MGE |
(3) LGE |
(4) NF_NEXT |
(5) OF_NEXT |
(6) NF_EXT |
(7) OF_EXT |
(8) FULL |
|
|---|---|---|---|---|---|---|---|---|
| MP_INDEX | 0.136 (0.65) |
1.115Note * (2.14) |
0.353 (1.14) |
0.288 (0.80) |
0.171 (0.53) |
-0.200 (-0.47) |
1.091Note ** (3.21) |
0.428 (1.36) |
| STRAT_LT_INDEX | -0.819Note ** (-2.73) |
-0.057 (-0.10) |
0.591 (1.66) |
1.890Note *** (3.44) |
-0.244 (-0.56) |
0.187 (0.40) |
0.480 (1.33) |
0.511 (1.36) |
| UNI_STAFF | 0.136 (0.73) |
-0.246 (-0.91) |
-0.179 (-0.90) |
-0.794Note ** (-2.99) |
0.236 (0.88) |
0.502 (1.62) |
-0.322 (-1.95) |
-0.120 (-0.64) |
| LN(AGE) | -0.299Note * (-2.56) |
0.166 (0.99) |
0.151 (1.16) |
-0.0550 (-0.29) |
0.834Note ** (3.01) |
0.357 (1.39) |
-0.114 (-0.45) |
0.0672 (0.61) |
| LN(CAP_EMP) | 0.160Note *** (3.42) |
0.0911 (1.61) |
0.135Note ** (2.70) |
0.182Note *** (4.46) |
0.170Note ** (2.89) |
0.314Note *** (7.96) |
0.104 (1.82) |
0.137Note ** (3.06) |
| MULTI | -0.273 (-1.82) |
0.0534 (0.28) |
0.310 (1.95) |
0.538 (1.85) |
0.324 (1.77) |
-0.0594 (-0.38) |
-0.0893 (-0.56) |
0.194 (1.33) |
| OPE_OUTCAN | 0.326 (1.95) |
0.287Note * (2.22) |
-0.116 (-1.02) |
-0.261 (-1.49) |
0.155 (1.40) |
-0.282 (-1.85) |
0.0260 (0.26) |
0.165 (1.33) |
| COMP | 0.0273 (0.84) |
-0.0875Note * (-2.34) |
0.0185 (0.54) |
-0.0913Note ** (-2.70) |
0.00593 (0.17) |
0.101Note * (2.46) |
-0.0388 (-1.15) |
-0.00893 (-0.33) |
| SIZE_S | 0.0892 (0.65) |
-0.0602 (-0.31) |
0.00976 (0.05) |
-0.611Note *** (-3.75) |
0.0112 (0.04) |
0.0727 (0.38) |
0.152 (1.00) |
0.0271 (0.18) |
| SIZE_M | -0.0329 (-0.27) |
0.433Note * (2.12) |
-0.172 (-0.72) |
-0.771Note ** (-3.01) |
0.0300 (0.11) |
0.0826 (0.33) |
0.571Note ** (3.11) |
0.105 (0.55) |
| MANUF | -0.191 (-1.14) |
-0.690Note ** (-3.02) |
0.0578 (0.30) |
-0.871Note *** (-5.56) |
-0.0477 (-0.34) |
0.0669 (0.50) |
-0.321 (-1.71) |
-0.365Note ** (-2.95) |
| SERV | -0.198 (-1.28) |
-0.398 (-1.56) |
0.247 (1.12) |
-0.644Note *** (-4.26) |
0.130 (0.71) |
-0.320 (-1.93) |
-0.0599 (-0.34) |
-0.110 (-0.82) |
| QC | 0.130 (0.66) |
-0.747 (-1.79) |
-0.0470 (-0.20) |
-1.320Note *** (-5.18) |
-0.0860 (-0.40) |
0.148 (0.64) |
0.0361 (0.18) |
-0.166 (-0.63) |
| ON | -0.512Note * (-2.56) |
-0.702 (-1.71) |
0.250 (1.26) |
-1.501Note *** (-6.18) |
0.0622 (0.33) |
-0.719Note ** (-3.30) |
0.302 (1.49) |
-0.149 (-0.60) |
| CENT | 0.415 (1.89) |
-0.982Note * (-2.02) |
0.354 (1.67) |
-1.065Note *** (-4.54) |
0.225 (0.98) |
-0.230 (-1.00) |
0.366 (1.85) |
0.00118 (0.00) |
| ATL | -0.376 (-0.99) |
-0.440 (-0.93) |
-0.223 (-0.92) |
-1.316Note *** (-4.40) |
-0.147 (-0.63) |
-0.798Note * (-2.07) |
-0.487 (-1.90) |
-0.476 (-1.66) |
| _cons | 11.36Note *** (21.06) |
11.81Note *** (11.11) |
9.450Note *** (13.35) |
12.45Note *** (18.00) |
7.531Note *** (6.00) |
8.007Note *** (8.03) |
10.73Note *** (8.77) |
10.35Note *** (15.03) |
| N | 295 | 875 | 1,627 | 255 | 1,554 | 148 | 840 | 2,797 |
|
||||||||
Appendix F: Econometric estimates on net profit per employee
| (1) HE |
(2) MGE |
(3) LGE |
(4) NF_NEXT |
(5) OF_NEXT |
(6) NF_EXT |
(7) OF_EXT |
(8) FULL |
|
|---|---|---|---|---|---|---|---|---|
| MP_INDEX | -1.040Note * (-2.40) |
0.926 (1.10) |
1.388Note ** (2.80) |
1.056Note * (2.08) |
1.514Note ** (3.18) |
-0.990 (-0.84) |
-0.514 (-0.84) |
0.878Note * (1.99) |
| STRAT_LT_INDEX | 0.204 (0.25) |
-1.349 (-1.63) |
0.149 (0.21) |
-0.165 (-0.17) |
-0.927 (-1.50) |
0.142 (0.13) |
0.657 (0.95) |
-0.0199 (-0.03) |
| UNI_STAFF | 1.254Note ** (2.74) |
1.772Note *** (4.81) |
0.235 (0.58) |
2.148Note *** (4.61) |
0.892Note * (2.39) |
-0.0251 (-0.04) |
1.421Note * (2.39) |
0.959Note ** (3.09) |
| LN(AGE) | -0.579Note * (-2.14) |
0.487 (1.90) |
1.012Note *** (3.81) |
2.298Note *** (4.72) |
1.607Note *** (3.86) |
-0.241 (-0.40) |
0.146 (0.33) |
0.392 (1.79) |
| LN(CAP_EMP) | 0.148 (1.07) |
0.273Note ** (3.01) |
0.185Note ** (2.69) |
0.0958 (1.28) |
0.233Note ** (2.92) |
0.292Note * (2.27) |
0.388Note *** (3.57) |
0.171Note * (2.41) |
| MULTI | 0.308 (1.05) |
-0.0486 (-0.16) |
0.257 (1.14) |
0.448 (1.12) |
-0.0104 (-0.04) |
-0.0857 (-0.25) |
0.320 (1.39) |
0.142 (0.81) |
| OPE_OUTCAN | -0.0839 (-0.34) |
-0.0497 (-0.18) |
-0.0760 (-0.43) |
-0.817Note ** (-2.87) |
0.0434 (0.25) |
-0.850Note * (-2.26) |
0.00125 (0.00) |
-0.0507 (-0.33) |
| COMP | -0.122 (-1.70) |
-0.0996 (-1.71) |
-0.181Note * (-2.25) |
-0.344Note *** (-3.79) |
-0.216Note ** (-3.07) |
0.0574 (0.57) |
-0.0786 (-1.69) |
-0.144Note * (-2.39) |
| SIZE_S | 1.138Note * (2.35) |
0.790Note * (2.49) |
0.648Note ** (2.84) |
0.825Note ** (3.22) |
0.593 (1.84) |
-0.564 (-0.96) |
0.644Note * (2.37) |
0.680Note *** (3.57) |
| SIZE_M | 0.787 (1.72) |
0.802Note * (2.07) |
-0.102 (-0.31) |
-0.612 (-1.10) |
0.510 (1.26) |
-0.113 (-0.21) |
0.422 (1.17) |
0.408 (1.69) |
| MANUF | -0.0550 (-0.14) |
-0.764Note * (-2.46) |
-0.104 (-0.27) |
-1.375Note ** (-3.31) |
-0.464 (-1.73) |
0.203 (0.87) |
0.246 (0.55) |
-0.675Note * (-2.56) |
| SERV | -0.411 (-1.04) |
-0.791Note * (-2.00) |
-0.0708 (-0.18) |
-2.311Note *** (-5.52) |
-0.347 (-1.18) |
-0.150 (-0.60) |
0.107 (0.24) |
-0.750Note ** (-2.74) |
| QC | 0.195 (0.59) |
0.00864 (0.02) |
0.257 (0.47) |
-0.0990 (-0.36) |
0.291 (0.53) |
-0.451 (-0.75) |
-0.0109 (-0.03) |
0.248 (0.52) |
| ON | 0.134 (0.38) |
-0.429 (-1.32) |
0.374 (0.68) |
-0.531Note ** (-2.67) |
0.296 (0.54) |
-1.063Note * (-2.00) |
0.212 (0.62) |
-0.0362 (-0.08) |
| CENT | 0.988 (1.88) |
0.0257 (0.05) |
0.416 (0.74) |
0.456 (1.20) |
0.517 (0.89) |
-0.304 (-0.61) |
0.627 (1.80) |
0.279 (0.56) |
| ATL | 0.934Note * (2.15) |
-0.178 (-0.59) |
-0.544 (-0.86) |
-0.402 (-1.23) |
-0.727 (-1.17) |
-0.685 (-1.04) |
0.339 (0.88) |
-0.499 (-0.96) |
| _cons | 8.543Note *** (5.37) |
5.315Note *** (3.59) |
3.301Note ** (2.73) |
5.404Note *** (4.11) |
1.804 (1.00) |
8.013Note ** (3.08) |
3.418Note * (1.99) |
6.072Note *** (5.83) |
| N | 241 | 743 | 1,244 | 190 | 1,234 | 102 | 702 | 2,228 |
|
||||||||
Appendix G: Econometric estimates of marginal effects on innovation
| (1) HE |
(2) MGE |
(3) LGE |
(4) NF_NEXT |
(5) OF_NEXT |
(6) NF_EXT |
(7) OF_EXT |
(8) FULL |
|
|---|---|---|---|---|---|---|---|---|
| MP_INDEX | 0.215Note * (2.00) |
0.209Note ** (2.59) |
0.596Note *** (3.30) |
0.511Note ** (3.26) |
0.361Note * (2.23) |
0.126 (1.58) |
0.126Note * (2.19) |
0.386Note *** (3.52) |
| STRAT_LT_INDEX | 0.283 (1.86) |
0.177Note * (2.09) |
-0.457 (-1.72) |
-0.182 (-0.91) |
-0.284 (-1.13) |
-0.0730 (-1.28) |
0.0953 (1.34) |
-0.113 (-0.68) |
| UNI_STAFF | -0.0504 (-1.77) |
-0.0158 (-0.98) |
-0.0113 (-0.25) |
0.00205 (0.06) |
-0.000486 (-0.01) |
0.00115 (0.11) |
-0.00961 (-0.47) |
-0.0238 (-0.83) |
| LN(AGE) | -0.203 (-0.82) |
0.330 (1.81) |
-0.159 (-0.32) |
0.314 (0.77) |
0.380 (0.40) |
-0.331 (-1.52) |
-0.158 (-0.67) |
-0.0784 (-0.27) |
| LN(CAP_EMP) | -0.0719 (-0.15) |
-0.679Note ** (-3.24) |
0.0333 (0.07) |
-0.276 (-0.79) |
-1.108 (-1.68) |
-0.290 (-1.66) |
-0.413Note * (-2.11) |
-0.585 (-1.41) |
| MULTI | 0.104Note ** (3.11) |
0.0409Note * (2.36) |
-0.0375 (-0.94) |
0.0885Note * (2.18) |
-0.0275 (-0.63) |
0.00494 (0.97) |
-0.00673 (-0.46) |
0.00682 (0.24) |
| OPE_OUTCAN | -0.00244 (-0.14) |
-0.00384 (-0.29) |
0.0590Note * (2.17) |
0.0128 (1.04) |
0.0321 (1.47) |
-0.0133 (-1.63) |
0.0390 (1.60) |
0.0368 (1.93) |
| RD | 0.00172 (0.08) |
0.0125 (0.56) |
0.0962 (1.62) |
-0.00195 (-0.04) |
0.102 (1.92) |
-0.00456 (-0.48) |
-0.0273 (-0.91) |
0.0473 (1.25) |
| COMP | 0.138 (1.12) |
0.0848 (1.13) |
-0.181 (-0.76) |
0.317 (1.78) |
-0.224 (-0.92) |
0.0688 (1.05) |
0.0471 (0.77) |
0.0813 (0.56) |
| SIZE_S | 0.0135 (0.20) |
-0.0354 (-0.46) |
0.0595 (0.38) |
0.409Note ** (2.87) |
-0.0459 (-0.24) |
0.0265 (0.58) |
-0.0437 (-1.33) |
-0.0258 (-0.22) |
| SIZE_M | 0.0421 (0.61) |
0.00244 (0.07) |
0.00480 (0.19) |
0.149Note ** (3.02) |
0.0301 (0.75) |
0.00887 (0.41) |
-0.0317 (-1.27) |
0.0205 (0.56) |
| MANUF | 0.0601Note * (2.53) |
-0.00696 (-0.38) |
0.0664 (1.09) |
0.0195 (1.06) |
0.0305 (0.58) |
0.0128 (1.57) |
-0.0587Note * (-2.55) |
0.0316 (0.97) |
| SERV | 0.360Note *** (3.57) |
0.0000339 (0.00) |
0.0966 (0.51) |
0.0261 (0.17) |
0.0142 (0.09) |
0.0537 (1.55) |
-0.172Note * (-2.57) |
0.0649 (0.68) |
| QC | 0.0199 (0.28) |
-0.0329 (-1.36) |
-0.0198 (-0.30) |
-0.156Note ** (-2.78) |
0.0421 (0.46) |
-0.0496 (-1.45) |
-0.0229 (-1.62) |
-0.0350 (-0.72) |
| ON | -0.0107 (-0.19) |
-0.0162 (-0.42) |
-0.0251 (-0.26) |
-0.180Note * (-1.97) |
0.0182 (0.18) |
-0.0491 (-1.13) |
-0.0598 (-1.49) |
-0.00460 (-0.07) |
| CENT | 0.104Note * (2.31) |
-0.0108 (-0.54) |
0.0137 (0.21) |
-0.0214 (-0.37) |
0.0458 (0.64) |
-0.0113 (-1.04) |
-0.0183 (-1.64) |
0.0109 (0.28) |
| ATL | -0.00641 (-0.40) |
-0.0122Note * (-2.54) |
-0.0248 (-1.05) |
-0.0202Note * (-2.55) |
-0.0235 (-0.86) |
-0.0247 (-1.62) |
-0.00339 (-0.92) |
-0.0198 (-1.45) |
| N | 302 | 895 | 1,669 | 262 | 1,592 | 154 | 858 | 2,866 |
|
||||||||
Appendix H: Econometric estimates on the number of innovative products and processes
| (1) HE |
(2) MGE |
(3) LGE |
(4) NF_NEXT |
(5) OF_NEXT |
(6) NF_EXT |
(7) OF_EXT |
(8) FULL |
|
|---|---|---|---|---|---|---|---|---|
| MP_INDEX | -0.0283 (-0.23) |
0.796Note *** -4.92 |
0.307Note * -2.27 |
0.0295 -1.58 |
0.446Note *** -3.44 |
0.0807 -0.31 |
0.960Note *** -4.38 |
0.479Note ** -3.14 |
| STRAT_LT_INDEX | 0.728Note ** -3.06 |
-0.0267 (-0.14) |
0.00228 -0.01 |
-0.000447 (-0.03) |
-0.123 (-0.69) |
1.376Note ** -2.99 |
0.251 -0.65 |
0.176 -0.73 |
| UNI_STAFF | -0.0663 (-0.79) |
-0.0827 (-0.78) |
0.109 -1.09 |
0.00313 -0.51 |
-0.0302 (-0.29) |
-0.488Note * (-2.34) |
-0.0566 (-0.39) |
0.016 -0.16 |
| LN(AGE) | 0.124Note * -2.31 |
0.124Note * -2 |
0.00111 -0.02 |
-0.00417 (-0.66) |
-0.0327 (-0.28) |
-0.0212 (-0.22) |
-0.14 (-0.81) |
0.0674 -1.02 |
| LN(CAP_EMP) | -0.0426 (-1.97) |
-0.0814Note *** (-3.67) |
0.0380Note * -2.04 |
0.00186 -1.44 |
-0.026 (-1.10) |
-0.00137 (-0.06) |
-0.0735 (-1.72) |
-0.0451 (-1.54) |
| MULTI | -0.00818 (-0.14) |
0.0866 -1.17 |
0.0142 -0.2 |
-0.00900Note * (-2.04) |
0.0251 -0.26 |
0.0856 -0.59 |
0.0251 -0.23 |
-0.00133 (-0.02) |
| OPE_OUTCAN | 0.145 -1.02 |
0.0466 -0.9 |
0.191Note * -2.45 |
0.0119 -0.92 |
0.0867 -1.21 |
-0.125Note * (-2.21) |
0.136 -1.33 |
0.164 -1.93 |
| RD | 0.00433 -0.07 |
0.221Note * -2.42 |
0.0653 -0.76 |
0.0429 -1.45 |
0.0313 -0.39 |
0.256 -1.66 |
0.473Note *** -3.39 |
0.13 -1.57 |
| COMP | -0.000348 (-0.03) |
0.0376Note * -2.56 |
-0.018 (-1.06) |
-0.00016 (-0.16) |
0.00238 -0.15 |
-0.0325 (-1.35) |
0.0213 -0.88 |
-0.0019 (-0.12) |
| SIZE_S | -0.0972 (-1.26) |
-0.0216 (-0.24) |
-0.0281 (-0.38) |
-0.00134 (-0.25) |
0.0427 -0.57 |
-0.275 (-1.22) |
-0.207 (-1.30) |
-0.0538 (-0.55) |
| SIZE_M | -0.0231 (-0.35) |
-0.113 (-1.50) |
-0.0473 (-0.82) |
-0.00665 (-1.34) |
0.0278 -0.25 |
-0.096 (-0.84) |
-0.292Note * (-1.96) |
-0.0228 (-0.24) |
| MANUF | 0.577 -1.8 |
0.0415 -0.38 |
0.0649 -0.4 |
0.0206 -1.22 |
0.00569 -0.05 |
0.803Note * -2.09 |
1.028 -1.95 |
0.0462 -0.33 |
| SERV | 0.262Note * -2.24 |
-0.164 (-1.19) |
-0.1 (-0.53) |
Note ...: not applicable | -0.176 (-1.16) |
0.461Note ** -3.06 |
0.453 -1.74 |
-0.129 (-0.77) |
| QC | 0.0369 -0.43 |
-0.0926 (-1.60) |
0.12 -1.09 |
0.000102 -0.02 |
0.275Note * -2.21 |
-0.112 (-1.22) |
-0.0797 (-0.76) |
-0.00599 (-0.08) |
| ON | 0.0372 -0.47 |
-0.101 (-1.43) |
0.0799 -0.74 |
-0.0102 (-1.35) |
0.256 -1.74 |
-0.239 (-1.78) |
0.0127 -0.11 |
0.0394 -0.4 |
| CENT | -0.0459 (-0.78) |
-0.0115 (-0.15) |
0.00975 -0.11 |
-0.00786 (-1.64) |
0.336 -1.87 |
-0.163Note *** (-3.40) |
-0.0509 (-0.36) |
0.0281 -0.27 |
| ATL | -0.0161 (-0.24) |
0.031 -0.23 |
0.101 -0.57 |
-0.00478 (-1.63) |
0.241 -0.85 |
-0.130Note ** (-2.74) |
0.274 -0.89 |
0.0124 -0.09 |
| N | 302 | 895 | 1,669 | 262 | 1,592 | 154 | 858 | 2,866 |
... not applicable
|
||||||||
- Date modified: