
Environment Fact Sheets
Agricultural irrigation patterns in Canada from 2012 to 2018
Skip to text
Text begins
Irrigation is an important agricultural practice in areas where precipitation levels are low during the growing season. The Canadian agricultural sector used approximately 3 billion m3 of water for irrigation in 2018, equivalent to the volume of 1.2 million Olympic-sized swimming pools. It represents a 74% increase over 2012.
The vast majority of farms that irrigated were located in Alberta and British Columbia and they were responsible for the bulk of water used. In 2018, farms in Alberta accounted for 66% of water used for irrigation, followed by British Columbia (25%).
Regional irrigation volumes and crop type are interconnected. For example, farms in Alberta and British Columbia irrigate mainly hay land used to grow grass, legumes, or other plants such as clover or alfalfa, all of which are cut and dried for feed. These crops are traditionally more water intensive than horticultural crops (such as field grown vegetables, potatoes, greenhouse vegetables, fruits, ornamental products) and thus contribute to higher irrigation needs. In addition, there is a larger amount of agricultural land in the West compared to the eastern portion of Canada; according to the 2016 Census of Agriculture, 86% of total hectares of Canadian farms were located in the West, while 8% and 5% were in Ontario and Quebec respectively. Horticultural crops are also irrigated in the West but these are typically smaller in area.
Start of text boxThis article is based on data from the Agricultural Water Survey. It covers changes in the amount of water used for irrigation over time, land areas and crop types receiving irrigation, irrigation systems used, and the adoption of irrigation water and energy conservation practices across the country (excludes Yukon, Northwest Territories, and Nunavut, and farms involved in greenhouse production).
The Agricultural Water Survey is a biennial survey that is conducted to gather information on irrigation water use, irrigation methods and practices, and sources and quality of water use for agricultural purposes on Canadian farms. This survey is part of the Canadian Environmental Sustainability Indicators (CESI) program and the data is used in CESI's reporting activities.
Alberta and British Columbia led the increase in irrigation between 2012 and 2018
The amount of water used for irrigation increased 74% from 1.7 billion m3 in 2012 to 3.0 billion m3 in 2018, at the Canada level. In 2018, 68% of irrigation came from off-farm water sources compared to 74% in 2012; of those, 92% came from provincial sources in 2018. The largest increases in water use occurred from 2016 to 2018 (+44%).

Data table for Chart 1
| Geography | Total irrigation volume | |||
|---|---|---|---|---|
| 2012 | 2014 | 2016 | 2018 | |
| cubic metres | ||||
| Canada | 1,692,353 | 1,679,021 | 2,054,082 | 2,950,908 |
| Alberta | 1,279,583 | 1,265,576 | 1,424,022 | 1,941,522 |
| British Columbia | 234,830 | 276,888 | 363,370 | 744,830 |
|
Note: Canada excludes Yukon, Northwest Territories and Nunavut. Source: Statistics Canada. Table 38-10-0239-01. Irrigation volume by province and drainage region (x 1,000). |
||||
Alberta and British Columbia reported the largest irrigation volumes during this period. Albertan farms reported using an additional 518 million m3 in 2018 over 2016 levels (+36%), while farms in British Columbia reported an additional 381 million m3 (+105%). Though less of an increase in volume terms, Saskatchewan reported the largest growth over the period, a reported increase of 125% in 2018, the equivalent of an additional 75 million m3 over 2016. The gain in irrigation volumes comes amid a decline in precipitation in recent years. Relative to 2016 levels, the western provinces recorded lower accumulated precipitation levels in 2018 during the growing season.Note
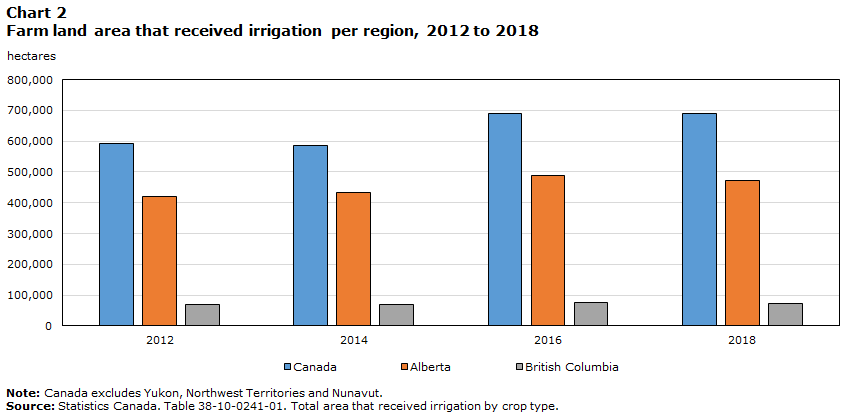
Area irrigated increased in Canada from 2012 to 2018
The total area that received irrigation in 2018 reached 691,108 hectares, up 17% from 2012. Canadian farmers reported the largest increase in 2016, irrigating an additional 102,910 hectares compared to 2014.
The increase in volume of water used for irrigation between 2012 and 2018 does not seem to be solely explained by the irregular increase of land irrigated; irrigation intensity patterns can provide valuable insight, since it integrates multiple factors like precipitation and water intensity of crop type. For instance, British Columbia’s irrigation volume increased by 105% between 2016 and 2018, and irrigated land area decreased by 2%, resulting in an average irrigation intensity of 10,032 m3 per hectare that year (+109% change from 2016). Compare this to Ontario, with an average irrigation intensity of 1,216 m3 per hectare in 2018 (resulting from a 29% decrease in irrigation volume over a 4% increase in area irrigated).
Data table for Chart 2
| Geography | All crop types | |||
|---|---|---|---|---|
| 2012 | 2014 | 2016 | 2018 | |
| hectares | ||||
| Canada | 591,050 | 585,870 | 688,780 | 691,108 |
| Alberta | 420,940 | 434,470 | 489,940 | 472,549 |
| British Columbia | 69,020 | 68,000 | 75,730 | 74,246 |
|
Note: Canada excludes Yukon, Northwest Territories and Nunavut. Source: Statistics Canada. Table 38-10-0241-01. Total area that received irrigation by crop type. |
||||
Alberta accounted for nearly 70% of the land receiving irrigation in Canada, followed by British Columbia (11%) in 2018. Saskatchewan reported the strongest growth of all provinces that year with an additional 16,746 hectares irrigated, a 43% increase over 2016.
In 2018, more than nine out of 10 irrigated hectares were field crops (58%) and forage crops (34%); these shares were relatively steady for all previously reported years.
Sprinkler systems were the dominant method of irrigation
Over the period, two-thirds of Canadian farms that irrigated reported using the sprinkler irrigation method which distributes water above the crop canopy. The second most commonly used method was micro-irrigation (one quarter of farms), which efficiently delivers water onto the soil surface very close to the crop or below the soil. Finally, one-tenth used surface irrigation, where water flows over the soil surface by gravity, either by flooding or in furrows. The choice of irrigation methods depends on a number of factors such as crop type, water quality, and precipitation levels during growing seasons.
By a wide margin, most provinces reported sprinkler irrigation as the most used between 2012 and 2018. Sprinkler irrigation in Quebec and Saskatchewan lead by a smaller margin but farmers reported using micro-irrigation in Quebec and surface irrigation in Saskatchewan to a greater extent than the other provinces.
An increasing number of farms using irrigation implemented water and energy conservation practices
At the Canada level, in 2018, the most widespread practices implemented to conserve water or energy were incorporating compost or other organic matter into soil (18%), watering at night or in the morning (18%), and using water or energy saving nozzles (17%). Increases in the use of conservation practices by farms over the period were noteworthy in Saskatchewan, which reported an increase of 75%, followed by the Atlantic Provinces (+62%).

Data table for Chart 3
| Conservation practices | Number of farms | |||
|---|---|---|---|---|
| 2012 | 2014 | 2016 | 2018 | |
| Wind breaks | 1,420 | 1,150 | 2,035 | 1,690 |
| Leaving stubble on fields | 2,575 | 2,650 | 4,015 | 3,555 |
| Watering at night or in the morning | 4,090 | 3,320 | 4,760 | 3,745 |
| Pressure reduction | 2,905 | 3,020 | 4,000 | 3,395 |
| Water or energy saving nozzles | 3,275 | 3,285 | 4,230 | 3,625 |
| Incorporating compost or other organic matter into soil | 3,115 | 3,275 | 4,220 | 3,860 |
| Other methods or devices | 610 | 985 | 1,315 | 1,030 |
| No conservation practices | 510 | 245 | 390 | 380 |
|
Note: Canada excludes Yukon, Northwest Territories and Nunavut. Source: Statistics Canada. Table 38-10-0241-01. Total area that received irrigation by crop type. |
||||
As the majority of the irrigating farms were in British Columbia and Alberta, these provinces also had the highest share of all Canadian farms implementing conservation practices, with 37% and 31%, respectively. Combining all provinces and practices, 2016 was the year when the highest number of practices were implemented.
- Date modified: