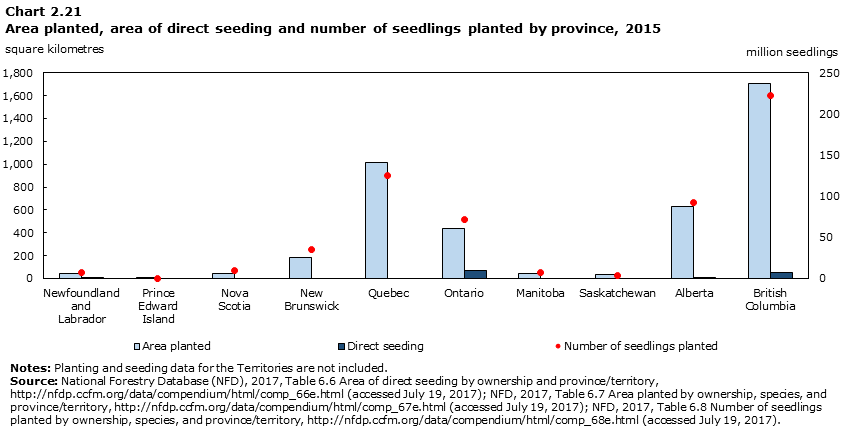
Chart 2.21
Area planted, area of direct seeding and number of seedlings planted by province, 2015

Data table for Chart 2.21
| Area planted | Direct seeding | Number of seedlings planted | |
|---|---|---|---|
| square kilometres | million seedlings | ||
| Newfoundland and Labrador | 42 | 1 | 7.54 |
| Prince Edward Island | 3 | Note ..: not available for a specific reference period | 0.51 |
| Nova Scotia | 46 | Note ..: not available for a specific reference period | 9.94 |
| New Brunswick | 180 | Note ..: not available for a specific reference period | 34.92 |
| Quebec | 1,011 | Note ..: not available for a specific reference period | 125.25 |
| Ontario | 437 | 67 | 71.95 |
| Manitoba | 41 | Note ..: not available for a specific reference period | 6.94 |
| Saskatchewan | 39 | Note ..: not available for a specific reference period | 3.57 |
| Alberta | 628 | 8 | 91.77 |
| British Columbia | 1,709 | 55 | 221.93 |
|
.. not available for a specific reference period Note: Planting and seeding data for the Territories are not included. Source: National Forestry Database (NFD), 2017, Table 6.6 Area of direct seeding by ownership and province/territory, http://nfdp.ccfm.org/data/compendium/html/comp_66e.html (accessed July 19, 2017); NFD, 2017, Table 6.7 Area planted by ownership, species, and province/territory, http://nfdp.ccfm.org/data/compendium/html/comp_67e.html (accessed July 19, 2017); NFD, 2017, Table 6.8 Number of seedlings planted by ownership, species, and province/territory, http://nfdp.ccfm.org/data/compendium/html/comp_68e.html (accessed July 19, 2017). |
|||
- Date modified: