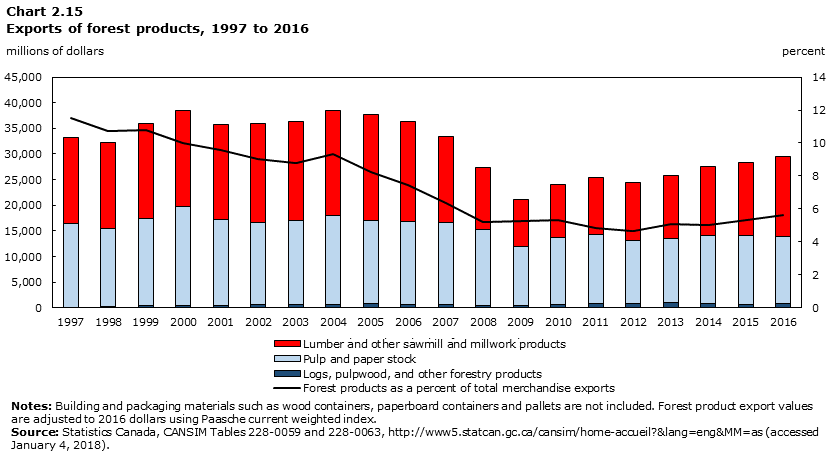
Chart 2.15
Exports of forest products, 1997 to 2016

Data table for Chart 2.15
| Year | Lumber and other sawmill and millwork products | Pulp and paper stock | Logs, pulpwood, and other forestry products | Forest products as a percent of total merchandise exports |
|---|---|---|---|---|
| million dollars | percent | |||
| 1997 | 16,743 | 16,311 | 138 | 11.5 |
| 1998 | 16,884 | 15,187 | 260 | 10.8 |
| 1999 | 18,468 | 17,122 | 383 | 10.8 |
| 2000 | 18,828 | 19,281 | 456 | 10.0 |
| 2001 | 18,688 | 16,652 | 486 | 9.6 |
| 2002 | 19,319 | 15,989 | 668 | 9.0 |
| 2003 | 19,340 | 16,275 | 731 | 8.8 |
| 2004 | 20,453 | 17,300 | 630 | 9.3 |
| 2005 | 20,557 | 16,256 | 801 | 8.3 |
| 2006 | 19,523 | 16,153 | 657 | 7.5 |
| 2007 | 16,629 | 16,141 | 595 | 6.4 |
| 2008 | 12,066 | 14,731 | 477 | 5.2 |
| 2009 | 9,142 | 11,485 | 444 | 5.3 |
| 2010 | 10,346 | 13,130 | 615 | 5.3 |
| 2011 | 11,055 | 13,469 | 884 | 4.9 |
| 2012 | 11,344 | 12,284 | 848 | 4.7 |
| 2013 | 12,267 | 12,575 | 997 | 5.1 |
| 2014 | 13,381 | 13,209 | 885 | 5.0 |
| 2015 | 14,235 | 13,335 | 753 | 5.3 |
| 2016 | 15,658 | 13,018 | 830 | 5.7 |
|
Notes: Building and packaging materials such as wood containers, paperboard containers and pallets are not included. Forest product export values are adjusted to 2016 dollars using Paasche current weighted index. Source: Statistics Canada, CANSIM Tables 228-0059 and 228-0063, http://www5.statcan.gc.ca/cansim/home-accueil?&lang=eng&MM=as (accessed January 4, 2018). |
||||
- Date modified: