
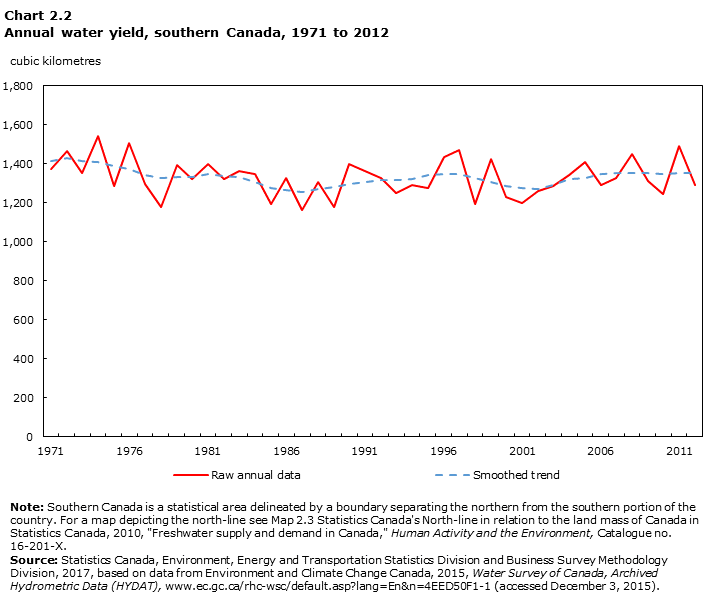
Chart 2.2
Annual water yield, southern Canada, 1971 to 2012
Data table for Chart 2.2
| Raw annual data | |
|---|---|
| cubic kilometres | |
| 1971 | 1,375.7 |
| 1972 | 1,467.7 |
| 1973 | 1,352.8 |
| 1974 | 1,543.5 |
| 1975 | 1,284.1 |
| 1976 | 1,506.5 |
| 1977 | 1,298.8 |
| 1978 | 1,181.1 |
| 1979 | 1,392.9 |
| 1980 | 1,324.6 |
| 1981 | 1,398.8 |
| 1982 | 1,323.3 |
| 1983 | 1,362.4 |
| 1984 | 1,349.0 |
| 1985 | 1,193.6 |
| 1986 | 1,327.0 |
| 1987 | 1,164.7 |
| 1988 | 1,304.9 |
| 1989 | 1,177.8 |
| 1990 | 1,399.6 |
| 1991 | 1,361.2 |
| 1992 | 1,326.5 |
| 1993 | 1,248.8 |
| 1994 | 1,293.4 |
| 1995 | 1,278.2 |
| 1996 | 1,437.4 |
| 1997 | 1,469.0 |
| 1998 | 1,196.0 |
| 1999 | 1,425.4 |
| 2000 | 1,228.2 |
| 2001 | 1,200.1 |
| 2002 | 1,260.0 |
| 2003 | 1,284.7 |
| 2004 | 1,344.8 |
| 2005 | 1,408.6 |
| 2006 | 1,291.7 |
| 2007 | 1,329.5 |
| 2008 | 1,449.6 |
| 2009 | 1,311.7 |
| 2010 | 1,243.0 |
| 2011 | 1,491.7 |
| 2012 | 1,293.3 |
|
Note: Southern Canada is a statistical area delineated by a boundary separating the northern from the southern portion of the country. For a map depicting the north-line see Map 2.3 Statistics Canada's North-line in relation to the land mass of Canada in Statistics Canada, 2010, "Freshwater supply and demand in Canada," Human Activity and the Environment, Catalogue no. 16-201-X. A line representing the smoothed trend of the raw annual data points is also included on the chart for Trends in water yield, 1971 to 2013. Source: Statistics Canada, Environment, Energy and Transportation Statistics Division and Business Survey Methodology Division, 2017, based on data from Environment and Climate Change Canada, 2015, Water Survey of Canada, Archived Hydrometric Data (HYDAT) (accessed December 3, 2015). |
|
- Date modified: