
EnviroStats
Repair
or Replace: What are Canadians doing with their old cell phones
and computers?
Skip to text
Text begins
Background
Repairing damaged cell phones and computers has become increasingly challenging in recent years as devices have become smaller and more complex in nature. Common problems such as cracked screens and dead batteries can lead consumers to replace damaged or dead devices rather than repairing them because the costs of the two options can often be similar, if repairing is even an option.
While all cell phones have batteries in them, replacing these batteries is no longer the straightforward proposition that it used to be. Although there are still some models of cell phones for which the battery can be easily replaced, many of the models available today require specialized tools and training to replace them, assuming that the batteries and tools are even readily available. (Rosborough, 2021)
The inability to easily repair devices like cell phones means that consumers are left with few options other than to replace them with new ones, resulting in the old devices needing to be disposed of. Because of the materials they contain, they cannot be disposed of in the waste stream and instead need to be treated as a form of hazardous waste and disposed of using a special program.
In response to this situation, grassroots movements advocating for the right to repair have emerged in countries and legislation has been proposed,Note Note and in some cases passed, in some jurisdictions requiring manufacturers to make devices easier for users to service and to make replacement parts, tools and repair manuals available and affordable.Note
As part of its goal to support a transition to a more circular economy, the Government of Canada has embarked on a number of initiatives, including a national strategy to encourage the development of value-retention processes for products in Canada.Note Note Value-retention processes include remanufacturing, refurbishment, repair and reuse as ways of prolonging the length of time a product remains in the economy and reducing the volume of products that enter the waste stream.
In November 2021, Apple announced the creation of a self-service repair program in response to pressure from grassroots right-to-repair groups.Note Initially available in the United Stated starting in 2022, the program allows owners of recent model cellular phones made by Apple to make common repairs such as displays and batteries. People using the program will have the option of returning the old parts for credit.
A public opinion survey conducted in 2019 reveals that, overall, 75% of Canadians would support right-to-repair legislation. (Innovative Research Group, 2019) According to the report, the more familiar people were with the policy, the higher their level of support.
In 2010, a cell phone in Canada was typically owned for about 33 months before being replaced by its owner. (Entner, 2013) In the years leading up to that point in time, the average time between replacements was increasing. (Chart 1) It is, of course, important to remember that this is an average and that some people hold on to their devices for much longer than that.

Data table for Chart 1
| months | |
|---|---|
| 2007 | 29.5 |
| 2008 | 30.8 |
| 2009 | 31.8 |
| 2010 | 33.0 |
| Source: Based on (Entner, 2013). | |
Canadian statistics
Statistics Canada’s Households and the Environment Survey is conducted on a biennial basis and examines the environmental practices of Canadian households. Included in the content of the survey since the 2009 cycle have been questions that ask respondent households about whether they had certain types of e-waste, including cell phones and computers, and how they disposed of these devices.
Cell phones
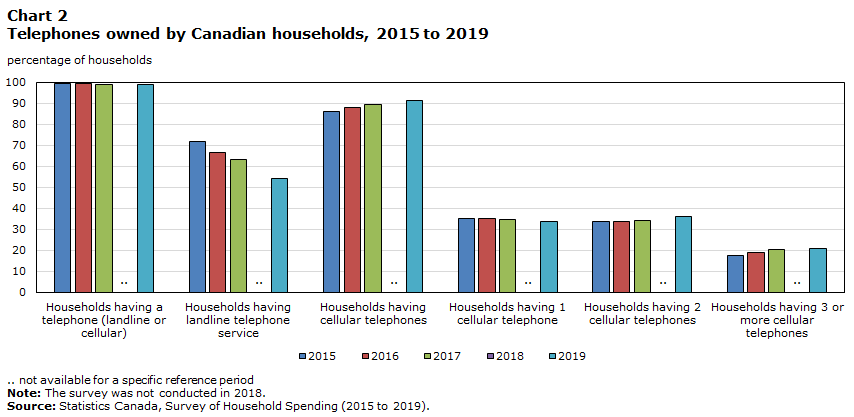
The Survey of Household Spending reveals that while virtually all Canadian households (99.1%) (Chart 2) reported having some type of telephone, only 54% reported having a landline telephone in 2019, down from 71.9% in 2015.Note Households reporting having at least one cell phone has increased from 86.1% in 2015 to 91.3% in 2019.Note About 70.1% of households reported having one or two cell phones in 2019, while 21.1% reported having three or more of the devices.Note
Data table for Chart 2
| Households having a telephone (landline or cellular) | Households having landline telephone service | Households having cellular telephones | Households having 1 cellular telephone | Households having 2 cellular telephones | Households having 3 or more cellular telephones | |
|---|---|---|---|---|---|---|
| percentage of households | ||||||
| 2015 | 99.3 | 71.9 | 86.1 | 35.0 | 33.7 | 17.5 |
| 2016 | 99.3 | 66.8 | 87.9 | 35.4 | 33.7 | 18.8 |
| 2017 | 99.0 | 63.3 | 89.4 | 34.6 | 34.4 | 20.4 |
| 2018 | Note ..: not available for a specific reference period | Note ..: not available for a specific reference period | Note ..: not available for a specific reference period | Note ..: not available for a specific reference period | Note ..: not available for a specific reference period | Note ..: not available for a specific reference period |
| 2019 | 99.1 | 54.0 | 91.3 | 34.0 | 36.1 | 21.4 |
|
.. not available for a specific reference period Note: The survey was not conducted in 2018. Source: Statistics Canada, Survey of Household Spending (2015 to 2019). |
||||||
As can be seen in Chart 3, over the past decade, about 19% of Canadian households have reported having a cell phone to dispose of. There was a slight peak of about 21% in 2013 and 2015, but the rate has been holding steady at about 17% since 2017.

Data table for Chart 3
| Had unwanted cellphones to dispose of | |
|---|---|
| percentage of households | |
| 2011 | 18 |
| 2013 | 21 |
| 2015 | 21 |
| 2017 | 17 |
| 2019 | 17 |
| Source: Statistics Canada, Households and the Environment Survey (2011 to 2019). | |
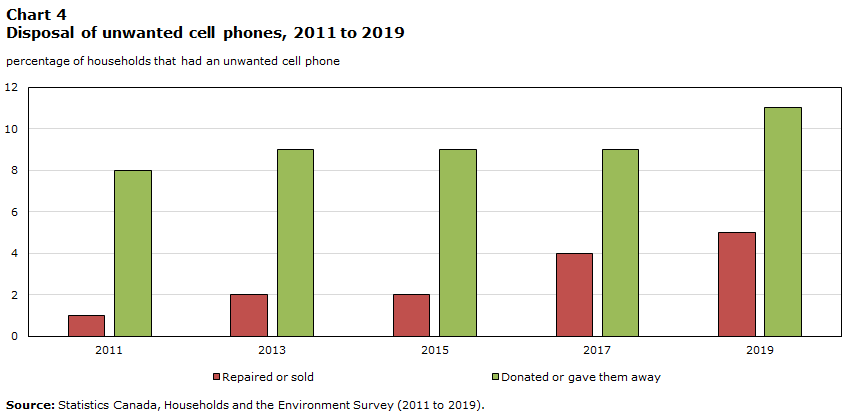
The proportion of households that reported repairing or selling unwanted cell phones has been very low since Statistics Canada started collecting data on this topic, but it has been trending upwards since 2011. (Chart 4)
Disposal of unwanted cell phones
Donating or giving away unwanted cell phones is another method by which a household can rid itself of the unwanted devices. Since 2011, the proportion of households that had an unwanted cell phone that reported doing this increased from 8% to 11%. (Chart 4)
While the Households and the Environment Survey doesn’t ask respondents for the number of unwanted cell phones they had, it is possible to make some inferences into the number of devices based on the number of disposal methods used. A limitation of this, of course, is that a household may have had more than one unwanted cell phone but used the same disposal method for all of them.
Retention of unwanted cell phones
Some households hold on to unwanted cell phones for any number of reasons, such as waiting for a household hazardous waste drop-off day or intending to sell them or give them away.
Data table for Chart 4
| Repaired or sold | Donated or gave them away | |
|---|---|---|
| percentage of households | ||
| 2011 | 1 | 8 |
| 2013 | 2 | 9 |
| 2015 | 2 | 9 |
| 2017 | 4 | 9 |
| 2019 | 5 | 11 |
| Source: Statistics Canada, Households and the Environment Survey (2011 to 2019). | ||
Computers
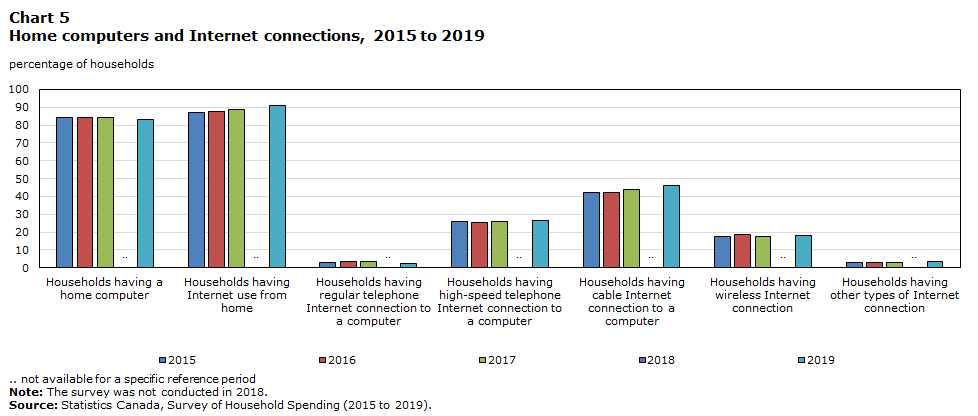
According to the Survey of Households Spending, in 2019, 83.2% of Canadian households reported having a computer.Note The rate of ownership has remained fairly steady since 2015, when 84.5% of households reported having a computer, dropping to 84.1% in 2016.Note (Chart 5)
Data table for Chart 5
| Households having a home computer | Households having Internet use from home | Households having regular telephone Internet connection to a computer | Households having high-speed telephone Internet connection to a computer | Households having cable Internet connection to a computer | Households having wireless Internet connection | Households having other types of Internet connection | |
|---|---|---|---|---|---|---|---|
| percentage of households | |||||||
| 2015 | 84.5 | 86.9 | 3.0 | 25.9 | 42.0 | 17.4 | 3.1 |
| 2016 | 84.1 | 87.4 | 3.4 | 25.2 | 42.0 | 18.7 | 2.9 |
| 2017 | 84.1 | 89.0 | 3.5 | 26.1 | 43.7 | 17.5 | 3.1 |
| 2018 | Note ..: not available for a specific reference period | Note ..: not available for a specific reference period | Note ..: not available for a specific reference period | Note ..: not available for a specific reference period | Note ..: not available for a specific reference period | Note ..: not available for a specific reference period | Note ..: not available for a specific reference period |
| 2019 | 83.2 | 91.0 | 2.5 | 26.5 | 46.0 | 18.0 | 3.5 |
|
.. not available for a specific reference period Note: The survey was not conducted in 2018. Source: Statistics Canada, Survey of Household Spending (2015 to 2019). |
|||||||
While the level of ownership has remained fairly stable over the last few years, the trend of the rate at which households have reported having unwanted computers to dispose of is negative, suggesting that Canadian households may be using their computers longer than they did in the past.
When they do have a computer to dispose of, however, they tend not to put them in the garbage. As can be seen in Chart 6, only 3% of households that had an unwanted computer in 2019 did this. Instead, the majority of households with unwanted computers took them to a depot or drop-off site, an option that has been increasing since 2011.

Data table for Chart 6
| Had unwanted computers to dispose of | Repaired or sold computersData table for Chart 6 Note 1 | GarbageData table for Chart 6 Note 1 | Depot or drop-offData table for Chart 6 Note 1 | Return to retailer/supplierData table for Chart 6 Note 1 | |
|---|---|---|---|---|---|
| percentage of households | |||||
| 2011 | 23 | Note F: too unreliable to be published | 3 | 52 | 7 |
| 2013 | 24 | 1 | 3 | 53 | 8 |
| 2015 | 26 | 1 | 3 | 56 | 9 |
| 2017 | 20 | 1 | 2 | 58 | 9 |
| 2019 | 16 | 2 | 3 | 63 | 9 |
F too unreliable to be published
|
|||||
Conclusion
When an electronic device, such as a cell phone or computer, becomes damaged or reaches the end of its useful life, users are faced with the question of whether to repair the device or replace it. Data from Statistics Canada suggest that Canadian households are retaining their cell phones and computers longer in recent years than they were a decade ago, as evidenced by a decrease in the proportion of households having one of these devices to dispose of while ownership levels have remained fairly steady.
Grassroots movements advocating for the consumer’s right to be able to repair devices using official parts, tools and instructions have appeared during the last few years. Some jurisdictions have implemented proposed or implemented legislation requiring manufacturers to design their devices to be repairable and at least one manufacturer has announced an authorized self-repair service that will launch in 2022.
In Canada, private member’s Bill C-272 was favourably received in Parliament in June 2021,Note but it died on the order paper with the election in the fall of 2021.
References
Entner, R. (2013). International Comparisons: The handset replacement cycle. Recon Analytics. Retrieved August 3, 2021, from http://www.vaxination.ca/crtc/2012-557/recon_handset_study.pdf
Innovative Research Group. (2019). Right to Repair National Online Omnibus Survey. Vancouver: OpenMedia. Retrieved August 3, 2021, from https://openmedia.org/sites/openmedia.org/files/openmedia_right_to_repair_omnibus_questions_report_-_20190531.pdf
Rosborough, A. (2021, May 14). Canada needs right-to-repair legislation. Policy Options. Retrieved August 03, 2021, from https://policyoptions.irpp.org/magazines/may-2021/canada-needs-right-to-repair-legislation/
- Date modified: