
EnviroStats
Canadian Industry and Environmental Protection, 2006 to 2016

Archived Content
Information identified as archived is provided for reference, research or recordkeeping purposes. It is not subject to the Government of Canada Web Standards and has not been altered or updated since it was archived. Please "contact us" to request a format other than those available.
Introduction
The manner in which Canadians conduct their daily activities can have a profound impact on their surroundings thereby compelling them to adapt their practices to be less harmful to the environment. This is even more of a reality for Canadian businesses as their operations are significant contributors to the amount of pollution and environmental pressures generated each year in Canada. For this reason, it is important to monitor the amount and the type of environmental protection that Canadian industry has undertaken over the years.
The following article highlights expenditures made by Canadian industry to protect the environment from industrial activities between 2006 and 2016.
Start of text boxWhat you should know about this study
Data sources
The main data source for this paper is the Environmental Protection Expenditures Survey (EPES), which is conducted every two years. The purpose of the survey is to provide a measure of the expenditures made by Canadian businesses to comply with present or anticipated environmental regulations, conventions and voluntary agreements. In addition, the survey collects information on environmental management practices and environmental technologies used by industry for the purpose of preventing or abating pollution.
I. How does environmental protection work in Canada?
In Canada, environmental protection regulatory powers are shared between provincial and federal governments. Each of these entities can put regulations into place that can lead to environmental protection expenditures as defined by the EPES. For example, in 2012, under the Canadian Environmental Protection Act, the federal government established the Reduction of Carbon Dioxide Emissions from Coal-Fired Generation of Electricity Regulations. In a nutshell, the objective of these regulations is to minimize carbon dioxide (CO2) emissions during the production of electricity using coal as a fuel.Note 1 In order to comply with these regulations, coal-fired generating stations are required to make environmental protection expenditures such as monitoring or mitigation equipment acquisition, amongst others.
While new regulations are put into place by government, industry also contributes to the environmental protection framework through other mechanisms. For example, several industry associations have become active participants in environmental protection through voluntary actions. For instance, from 2008 to 2013, the vinyl industry established an agreement with the government of Canada to prevent the release of tin stabilizers into the environment by allowing site verification and agreeing to corrective actions if needed. In 2015, the agreement was renewed until 2020.
II. Environmental protection expenditures by industries
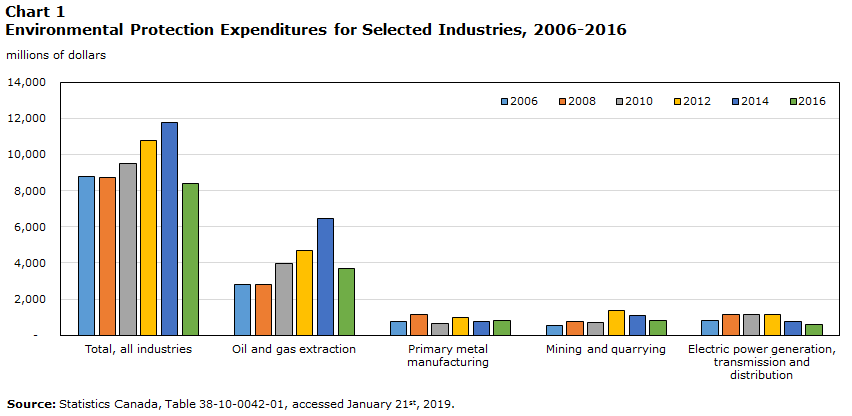
In order to comply with environmental protection regulations, conventions and voluntary agreements, businesses often incur expenses to purchase equipment as well as environmental services to prevent or clean up pollution. In 2006, Canadian industry spent approximately $8.8 billion on environmental protection expenditures, and by 2014, this amount increased by 26%, peaking at close to $11.8 billion. In 2016, environmental protection expenditures decreased to nearly $8.4 billion, with a little over $3.2 billion being capital investments. The majority of the decrease in environmental protection expenditures observed from 2014 to 2016 was a direct result of lower capital investment expenditures.
As shown in chart 1, in 2016, the oil and gas extraction industry accounted for the largest share of environmental protection expenditures made during the year at 44% of the total. This has been the case historically, as the industry accounted for an average share of 41% of total environmental protection expenditures in each reference year from 2006 to 2016.
The mining and quarrying, primary metal manufacturing and electric power generation, transmission and distribution industries were also key contributors to national environmental protection expenditures made by Canadian businesses. In 2016, these three industries combined to represent more than a quarter of all environmental protection expenditures.
These industries require the implementation of numerous environmental measures and practices to prevent pollution and environmental damage that can occur during the production process. For example, businesses engaged in the oil and gas extraction industry are required to perform reclamation activities (e.g. revegetation, remediation) on lands they have disturbed during their production cycle. Similarly, businesses taking part in mining and quarrying may have to undergo environmental assessments before they are granted a permit to drill.Note 2
Data table for Figure 1
| 2006 | 2008 | 2010 | 2012 | 2014 | 2016 | |
|---|---|---|---|---|---|---|
| millions of dollars | ||||||
| Total, all industries | 8,761 | 8,733 | 9,522 | 10,772 | 11,798 | 8,415 |
| Oil and gas extraction | 2,797 | 2,821 | 3,992 | 4,703 | 6,470 | 3,689 |
| Primary metal manufacturing | 734 | 1,172 | 643 | 993 | 766 | 836 |
| Mining and quarrying | 547 | 754 | 723 | 1,357 | 1,065 | 810 |
| Electric power generation, transmission and distribution | 806 | 1,128 | 1,171 | 1,160 | 775 | 583 |
| Source: Statistics Canada, Table 38-10-0042-01, accessed January 21st, 2019. | ||||||
III. Environmental protection expenditures by type
Statistics Canada classifies environmental protection expenditures into nine distinct types of activities as shown below:
- Environmental monitoring
- Environmental assessments and audits
- Reclamation and decommissioning
- Wildlife and habitat protection
- Waste management and sewerage services
- Pollution abatement and control processes
- Pollution prevention processes
- Fees, fines and licences
- Other types of environmental protection
In 2016, waste management and sewerage services, pollution prevention processes and pollution abatement and control processes were the categories in which the majority of business expenditures were made as they combined for over $6 billion in spending. Alone, pollution abatement and control processes accounted for a little under $2.6 billion of all environmental protection expenditures followed by pollution prevention processes and waste management services which contributed $1.2 billion and $2.2 billion respectively. These three categories combined represented the largest environmental expenditure share in each survey cycle since 2006.
Meanwhile, fees, fines and licenses and wildlife and habitat protection were the categories where the least amount was spent, averaging approximately 4% of all environmental protection expenditures for each reference period. The gap in expenditures between the different categories can partly be attributed to the relatively low amount of capital investments required to put some of these measures into application.
Pollution prevention and pollution abatement and control expenditures
Generally speaking, there are two stages during the production process where pollution can be treated. The first stage is at the source of the pollution and these measures are called pollution prevention processes. Simply put, they imply the use of technologies, equipment, or processes that reduce or eliminate pollution and/or waste before it is created. This can be accomplished, for example, by using material substitution to remove polluting materials from the production process, or by installing more efficient equipment that produces fewer pollutants during use.
The other possible stage where pollution can be treated in the production process, is after the pollution or waste has been created. These types of processes are called pollution abatement and control processes. An example can be found in the nickel industry where scrubbers are used in the exhaust streams to reduce the amount of air pollutants released to the environment.
Pollution prevention is considered a more proactive and effective strategy toward environmental protection, but it implies the restructuring of the production process. Furthermore, eliminating waste at the source can be more efficient for businesses as it can help them achieve cost savings on expenditures such as environmental clean-up or other environmental liabilities.Note 3
Chart 2 shows that from 2006 to 2014, capital investments made by Canadian businesses on pollution abatement and control processes and pollution prevention processes mostly progressed in opposite directions. In 2006, pollution abatement and control capital expenditures were estimated at a little over $900 million and reached close to $3.1 billion in 2014. In 2016, overall pollution abatement and control investments reached their lowest level since 2006, at $933 million. The decrease observed reflects an overall downturn in the oil and gas industry which was largely a result of declining prices in crude oil and natural gas.Note 4
Meanwhile, pollution prevention capital expenditures were estimated at over $1.5 billion dollars in 2006 and decreased to $700 million in 2016. The main industry driving this trend was the oil and gas extraction industry for which pollution abatement and control investments went up by more than fourfold between 2006 and 2014. Other significant increases were observed in the primary metal manufacturing industry where pollution abatement investments doubled over the same period.

Data table for Figure 2
| 2006 | 2008 | 2010 | 2012 | 2014 | 2016 | |
|---|---|---|---|---|---|---|
| millions of dollars | ||||||
| Pollution abatement and control processes (end-of-pipe) | 916.5 | 1,640.2 | 1,714.3 | 2,263.4 | 3,171.7 | 932.6 |
| Pollution prevention processes | 1,566.9 | 964.7 | 1,070.9 | 1,031.4 | 852.8 | 703.7 |
| Source: Statistics Canada, Table 38-10-0043, accessed: February 7th 2019. | ||||||
The main driver contributing to the increase in pollution abatement investments from 2010 to 2014 was the expansion in the oil and gas, and mining and quarrying industries. This led to a need to invest in pollution treatment solutions to support the added production. During the same period, many pollution reduction innovations were introduced to the market as a response to regulations that fell into the pollution abatement category. For example, the introduction of Directive 074 by Alberta Energy Regulators (AER) regarding tailings performance made it necessary to find alternatives in the way tailing ponds were managed.Note 5 Since tailing management techniques occur after the waste is created, the adoption of new techniques led to increased investments in pollution abatement expenditures. The decrease also coincides with a reduction in the distribution of pollution prevention methods among all industries.
Environmental media targeted by businesses environmental operational expenditures
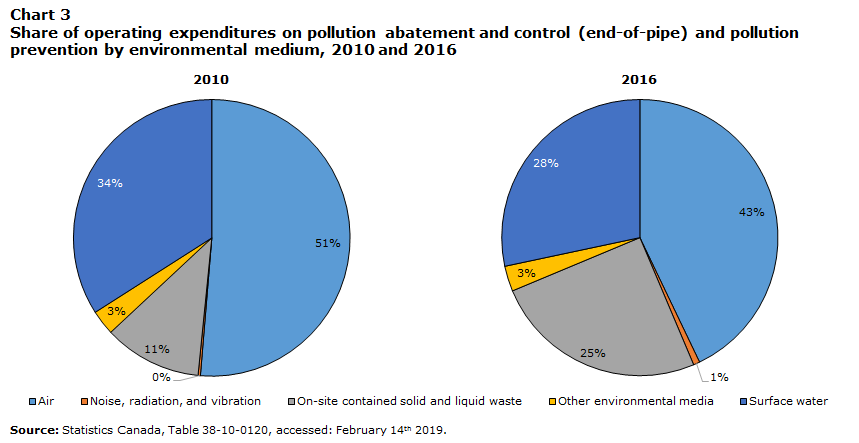
Operating expenditures are described as expenses made by businesses to successfully carry out day-to-day activities. These include expenses incurred for labour, training, material and purchased services. For example, waste management provided by a third-party or staff training on environmental management fall under this category. Chart 3 provides an overview of the evolution in the distribution of environmental operating expenditures by medium between 2010 and 2016.
Data table for Figure 3
| 2010 | 2016 | |
|---|---|---|
| percent | ||
| Air | 51% | 43% |
| Noise, radiation, and vibration | 0% | 1% |
| On-site contained solid and liquid waste | 11% | 25% |
| Other environmental media | 3% | 3% |
| Surface water | 34% | 28% |
| Source: Statistics Canada, Table 38-10-0120, accessed: February 14th 2019. | ||
In 2010, more than half (51%) of businesses’ operating expenditures on pollution abatement and prevention were directed toward the treatment of air pollution. In 2016, the share of expenditures for this category decrease to 43%. Similarly, the share of operating expenditures on surface water also decreased from 34% to 28% between 2010 and 2016.
During the same period, the share of expenditures aimed at on-site contained solid and liquid waste more than doubled, increasing from 11% in 2010 to 25% in 2016. Meanwhile, the share of expenditures on noise, radiation, vibration and other environmental media remained steady between 2010 and 2016 at around 3 to 4 percent.
IV. Participation in environmental practices
In addition to pollution prevention and abatement, a third category of potential environmental expenditures are environmental practices, which are protocols that businesses adopt to reduce their impact on the environment. Canada’s environmental protection strategy often avoids imposing compulsory measures and rather relies on co-operation between governments and industry.Note 6 For instance, companies are strongly encouraged by different levels of government to engage in environmental management practices such as the implementation of pollution prevention plans or establishing green procurement policies, but in most industries these practices are not mandatory. As a result, the level of participation in environmental management practices varies among individual businesses.
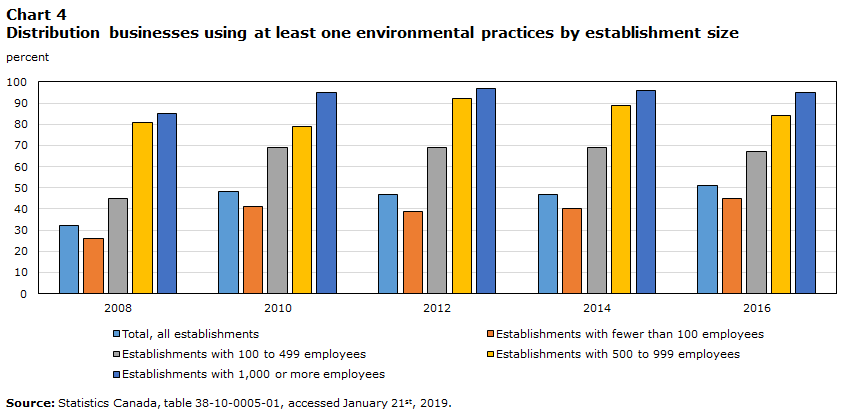
Chart 4 shows the percentage of establishments that used at least one environmental management practice during each EPES reference year from 2008 to 2016. Overall, the participation rate increased from 32% in 2008 to 51% in 2016 for all establishments regardless of size. In the latest iteration of the survey, environmental management systems and energy audits were the most common environmental management practices among all businesses regardless of size.
Data table for Figure 4
| 2008 | 2010 | 2012 | 2014 | 2016 | |
|---|---|---|---|---|---|
| percent | |||||
| Total, all establishments | 32 | 48 | 47 | 47 | 51 |
| Establishments with fewer than 100 employees | 26 | 41 | 39 | 40 | 45 |
| Establishments with 100 to 499 employees | 45 | 69 | 69 | 69 | 67 |
| Establishments with 500 to 999 employees | 81 | 79 | 92 | 89 | 84 |
| Establishments with 1,000 or more employees | 85 | 95 | 97 | 96 | 95 |
| Source: Statistics Canada, table 38-10-0005-01, accessed January 21st, 2019. | |||||
In 2016, establishments with 1,000 or more employees were the group with the highest percentage of businesses using at least one environmental practice, reaching 95%. Environmental management systems and the development of a greenhouse gas inventory were the most common practices among these businesses, with a participation rate of 88% and 73% respectively. From 2008 to 2016, green procurement activities and life-cycle analysis showed the most important percentage increase among all environmental practices, increasing by 15% and 16% respectively.
In contrast, businesses with fewer than 100 employees had the lowest rate of participation in environmental management practices with a rate of 45% in 2016, representing a percentage increase of 19% from 2008 levels. For this group, the most common environmental management practices were the implementation of environmental management systems (17%), energy audits (17%) and the implementation of energy management or monitoring systems (15%).
Overall, there is a noticeable trend where businesses with more employees have higher participation rates in environmental management practices. A factor that can likely explain this tendency is that larger businesses usually have more resources and skilled employees at their disposal to adopt these practices. Additionally, they may also be getting more stakeholder pressure to do so.Note 7 That being said, when faced with stakeholder pressures, smaller businesses might be in a position to more easily address some environmental concerns due to their ability to react more quickly than larger firms.Note 8
- Date modified: