
Quality of Employment in Canada
Average weekly working hours, 1976 to 2022
Skip to text
Text begins
The average amount of time workers usually spent at their main job or business in 2022 was nearly 3 hours less per week than in 1976. The characteristics of workers have changed in many ways over this period, with women accounting for a growing share of employment and younger workers shifting from working full-time hours on average in 1976, to working part-time on average in 2022. Nonetheless, despite seeing a decline in their average weekly working hours over this period, men continued to work longer hours than women in 2022.
The average number of usual hours worked on a weekly basis can change due to a number of circumstances: economic cycles (downturns and periods of growth), the structure of the economy (the share of services- or goods-producing industries), the socio-demographic composition of the employed population (gender, age, school enrollment), the distribution of unpaid household and family responsibilities, as well as wages offered to workers and marginal tax rates on employment income, among other factors. As an indicator of quality of employment, average weekly hours provide insights on economic conditions as well as on the characteristics of the employed population.
All analyses are based on annual averages from the Labour Force Survey (LFS).
Historical trends, 1976 to 2022
While data collected prior to 1997 are not directly comparable with data collected from 1997 onward due to a change in the way hours are measured in the LFSNote , the two time periods can be examined separately. Further, the change in concepts is not accompanied by a major break in the data series.
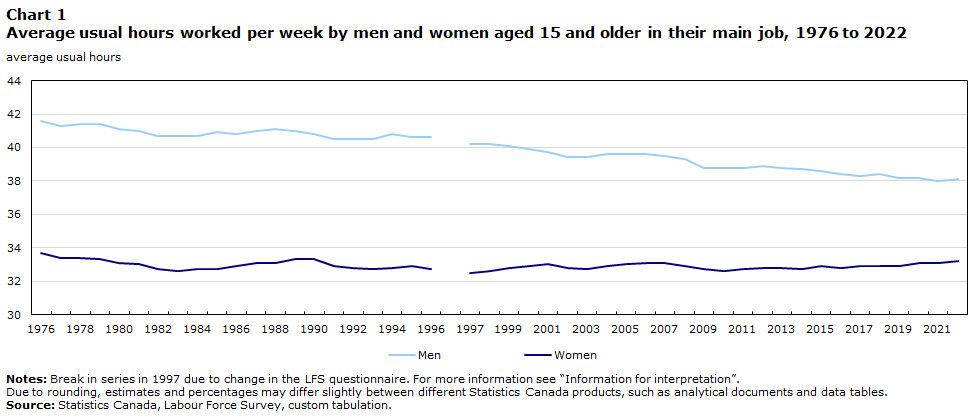
In 1976, Canadian workers worked an average of 38.6 hours per week at their main job or business. Generally, hours have fallen during economic downturns and have edged up in the early stages of economic recoveries. However, over time, the trend has been a gradual decline, and in 2022, the average worker was working 35.8 hours per week. Part of this decrease in average working hours reflects the growth in the share of women and students in the employed population from 1976 to 2022. On average, women and students are more likely to work shorter weekly hours which has pulled down the overall average weekly hours worked across time.
By sex, the largest change has been among employed men, for whom average hours fell from 41.6 per week in 1976 to 40.6 in 1996. The average hours of male workers also decreased from 1997 to 2022, declining from 40.2 to 38.1. Among women, average weekly work hours fell slightly from 33.7 in 1976 to 32.7 in 1996, before rising by 0.7 to 33.2 from 1997 to 2022.
For men, part of the decrease in hours is attributable to a notable decline in the number of people employed in manufacturing, an industry with relatively high average weekly hours (39.8 hours per week in 2022). As a result of multiple factors—including offshoring, automation, and declines associated with the recessions of the early 1980s and early 1990s, as well as a downward trend from 2004 to 2011—the share of employed men working in manufacturing fell from 22.7% in 1976 to 12.3% in 2022. At the same time, there was an increase in the number of men employed in services-producing industries, which typically have lower average weekly hours.
Data table for Chart 1
| Men | Women | |
|---|---|---|
| average usual hours | ||
| 1976 | 41.6 | 33.7 |
| 1977 | 41.3 | 33.4 |
| 1978 | 41.4 | 33.4 |
| 1979 | 41.4 | 33.3 |
| 1980 | 41.1 | 33.1 |
| 1981 | 41.0 | 33.0 |
| 1982 | 40.7 | 32.7 |
| 1983 | 40.7 | 32.6 |
| 1984 | 40.7 | 32.7 |
| 1985 | 40.9 | 32.7 |
| 1986 | 40.8 | 32.9 |
| 1987 | 41.0 | 33.1 |
| 1988 | 41.1 | 33.1 |
| 1989 | 41.0 | 33.3 |
| 1990 | 40.8 | 33.3 |
| 1991 | 40.5 | 32.9 |
| 1992 | 40.5 | 32.8 |
| 1993 | 40.5 | 32.7 |
| 1994 | 40.8 | 32.8 |
| 1995 | 40.6 | 32.9 |
| 1996 | 40.6 | 32.7 |
| 1997 | 40.2 | 32.5 |
| 1998 | 40.2 | 32.6 |
| 1999 | 40.1 | 32.8 |
| 2000 | 39.9 | 32.9 |
| 2001 | 39.7 | 33.0 |
| 2002 | 39.4 | 32.8 |
| 2003 | 39.4 | 32.7 |
| 2004 | 39.6 | 32.9 |
| 2005 | 39.6 | 33.0 |
| 2006 | 39.6 | 33.1 |
| 2007 | 39.5 | 33.1 |
| 2008 | 39.3 | 32.9 |
| 2009 | 38.8 | 32.7 |
| 2010 | 38.8 | 32.6 |
| 2011 | 38.8 | 32.7 |
| 2012 | 38.9 | 32.8 |
| 2013 | 38.8 | 32.8 |
| 2014 | 38.7 | 32.7 |
| 2015 | 38.6 | 32.9 |
| 2016 | 38.4 | 32.8 |
| 2017 | 38.3 | 32.9 |
| 2018 | 38.4 | 32.9 |
| 2019 | 38.2 | 32.9 |
| 2020 | 38.2 | 33.1 |
| 2021 | 38.0 | 33.1 |
| 2022 | 38.1 | 33.2 |
|
Notes: Break in series in 1997 due to change in the LFS questionnaire. For more information see “Information for interpretation”. Due to rounding, estimates and percentages may differ slightly between different Statistics Canada products, such as analytical documents and data tables. Source: Statistics Canada, Labour Force Survey, custom tabulation. |
||
Workers aged 15 to 24 experienced the most pronounced change in average weekly working hours over time, largely reflecting the share of students in this age group which more than doubled from 1976 to 2022, rising from 19.0% to 39.2%. Between 1976 and 1996, the largest decline in the weekly working hours of young workers occurred among part-time students, falling 8.7 hours to an average of 27.4. This was followed by non-students, for whom average usual hours fell by 4.2 to 34.6 hours per week and full-time students, among whom hours declined by 1.9 to 13.4 over the same period. From 1997 to 2022, average weekly hours for employed youth were more stable with a 1.9 hour increase per week among full-time students and declines among both part-time students (-2.5 hours to 25.8) and non-students (-0.6 hours to 33.9). Overall, the largest declines in average hours among 15- to 24-year-olds occurred during the recessions of the early 1980s and early 1990s, and, to a lesser extent, during the 2008/2009 recession.
Among workers aged 55 and older, men saw declines in average hours worked during both the 1976-to-1996 (42.6 to 41.5) and 1997-to-2022 (41.3 to 39.3) periods. Employed women in this age group saw a decrease from 1976 to 1996 (34.1 to 32.4), but an increase from 1997 to 2022 (32.4 to 33.5).
A recent snapshot
In 2022, 81.8% of workers were working full-time (30 or more hours per week). The proportion of men working full-time was 87.6%, while it was 75.4% for women. Among non-student workers aged 15 to 24, 75.3% were working full-time, compared to 13.2% among students in the same age group. Those aged 65 and older (57.1%) had lower rates of full-time employment compared with workers aged 25 to 64 (88.4%), a pattern which corresponds to their lower average usual hours worked per week in 2022.
Average weekly hours tend to be higher in goods-producing industries, where men account for the majority of workers.
In 2022, average usual hours per week were 40.3 for the goods-producing sector as a whole and ranged from a high of 46.3 in the natural resources industry, to a low of 38.4 hours in utilities. For services-producing industries, average weekly hours were 34.6, with the longest hours observed in transportation and warehousing (39.8 hours) and the lowest in accommodation and food services (29.0 hours).
Usual hours worked also varied between broad occupational categories. In 2022, average usual hours worked per week were highest among workers employed in natural resources, agriculture and related production occupations (42.0 hours), followed by those in management occupations (40.7 hours). The lowest average usual hours of work were in art, culture, recreation and sport occupations (30.6 hours), as well as in sales and services occupations (30.7 hours). Both occupational categories had more women than men and had among the highest proportions of younger workers.
Compared with employees, being self-employed was associated with longer average weekly working hours among men (40.6 compared with 37.7) but with shorter average hours for women (31.5 hours compared with 33.4). As shown by the distribution of weekly working hours indicator, there is greater variability in the hours of self-employed workers, and a higher proportion of them work more than 50 hours, as well as less than 15 hours per week compared with employees. Male workers were also more likely to be self-employed than female workers (16.1% compared with 10.5%) in 2022.
Start of text box
Information on the indicator
Description or definition
The average weekly working hours indicator is the average hours usually worked per week by workers in their main job, not including overtime.
Source
Statistics Canada, Labour Force Survey, 1976 to 2022.
Information for interpretation
For more information on the Labour Force Survey (LFS) methodology and population coverage, please consult the Guide to the Labour Force Survey, 2020.
The LFS estimates are based on a sample and are therefore subject to sampling variability. The analysis focuses on differences between estimates that are statistically significant at the 95% confidence level. Due to rounding, estimates and percentages may differ slightly between different Statistics Canada products, such as analytical documents and data tables.
Occupations are coded according to the National Occupational Classification (NOC) 2021, while industry coding is based on the North American Industry Classification System (NAICS) 2017.
Prior to January 1997, usual hours were the number of hours usually worked by the respondent in a typical week, regardless of whether they were paid. Beginning January 1997, usual hours for employees refers to their normal paid or contract hours, not counting any overtime. However, the definition of usual hours remains unchanged for the self-employed and unpaid family workers. In January 1997, the LFS questionnaire was changed to allow responses up to 168 hours per week. Prior to 1997, the upper limit was set at 99 hours.
Other related information
Additional Statistics Canada data are available on the following subject:
Hours of workEnd of text box
- Date modified: