
Quality of Employment in Canada
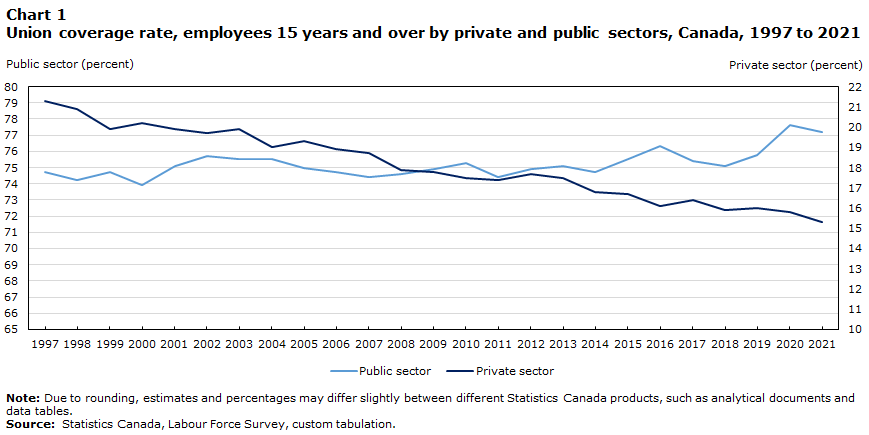
Collective bargaining coverage rate, 1997 to 2021
Skip to text
Text begins
In 2021, 3 in 10 employees in Canada (30.9%) were covered by a collective bargaining agreement. Coverage by a union agreement was about five times as high among employees in the public sector (77.2%) than among employees in the private sector (15.3%). Overall, the collective bargaining coverage rate followed a downward trend from 1997 to 2021, almost entirely due to a decline in coverage in the private sector.
Public health measures introduced to limit the spread of COVID-19 in 2020 resulted in unprecedented job losses in the Canadian labour market in March and April 2020, with employment remaining below its pre-pandemic level at the end of the year. With most of the decline concentrated among non-unionized employees in the private sector, the collective bargaining coverage rate increased by 1.1 percentage points to 31.3% from 2019 to 2020.
As non-unionized private sector employment recovered in 2021, the collective bargaining coverage rate fell back 0.4 percentage points to 30.9%, but remained slightly elevated compared with 2019 (30.2%).
The proportion of employees covered by collective bargaining, also known as the union coverage rate, includes union members and non-members covered by a collective agreement or a union contract. The coverage rate can reflect the particularity of the industrial relations system and the type of labour regulations in a country. Positions covered by a collective agreement are often associated with higher wages, more benefits, and greater job security. In association with the unionization rate, this indicator of quality of employment can be used to help assess trends in industrial relations in a country.
The union coverage rate for all employees and for different demographic and worker characteristics is calculated using data from the Labour Force Survey (LFS).
Historical trends, 1997 to 2021
In 1997, 33.7% of employees were either a union member, or a non-member covered by a collective agreement or a union contract. By 2021 the union coverage rate had declined to 30.9%.
The decrease in the collective bargaining coverage rate from 1997 to 2021 was driven by the private sector, where it declined from 21.3% in 1997 to 15.3% in 2021.
The union coverage rate for public sector employees was 74.7% in 1997. The rate was relatively stable from 1997 to 2019 before increasing to 77.6% in the context of the COVID-19 pandemic in 2020. The collective bargaining coverage in the public sector was 77.2% in 2021.
The most important contributor to the decline in the collective bargaining coverage rate in the private sector is the manufacturing industry. In 1997, manufacturing was the largest private sector industry by number of employees and had one of the highest coverage rates (36.4%). From 1997 to 2021, both the total number of private sector employees working in manufacturing and the proportion covered by a collective bargaining agreement declined—the number of employees declined by 245,000 and the proportion covered by a collective bargaining agreement fell 13.5 percentage points to 22.9%.
Data table for Chart 1
| Public sector | Private sector | |
|---|---|---|
| percent | ||
| 1997 | 74.7 | 21.3 |
| 1998 | 74.2 | 20.9 |
| 1999 | 74.7 | 19.9 |
| 2000 | 73.9 | 20.2 |
| 2001 | 75.1 | 19.9 |
| 2002 | 75.7 | 19.7 |
| 2003 | 75.5 | 19.9 |
| 2004 | 75.5 | 19.0 |
| 2005 | 75.0 | 19.3 |
| 2006 | 74.7 | 18.9 |
| 2007 | 74.4 | 18.7 |
| 2008 | 74.6 | 17.9 |
| 2009 | 74.9 | 17.8 |
| 2010 | 75.3 | 17.5 |
| 2011 | 74.4 | 17.4 |
| 2012 | 74.9 | 17.7 |
| 2013 | 75.1 | 17.5 |
| 2014 | 74.7 | 16.8 |
| 2015 | 75.5 | 16.7 |
| 2016 | 76.3 | 16.1 |
| 2017 | 75.4 | 16.4 |
| 2018 | 75.1 | 15.9 |
| 2019 | 75.8 | 16.0 |
| 2020 | 77.6 | 15.8 |
| 2021 | 77.2 | 15.3 |
|
Note: Due to rounding, estimates and percentages may differ slightly between different Statistics Canada products, such as analytical documents and data tables. Source: Statistics Canada, Labour Force Survey, custom tabulation. |
||
In 1997, male employees (35.2%) had a higher union coverage rate than female employees (32.1%). This pattern reversed by 2008, and women have had a higher collective bargaining coverage rate since. In 2021, among employees 33.2% of women were covered by a union agreement, compared with 28.6% of men. The proportion of female employees working in the public sector was higher than for men throughout this period, reducing the impact of declining coverage in the private sector. Furthermore, among women, the percentage of employees who worked in the public sector increased from 27.9% in 1997 to 32.4% in 2021. Among men, this rate declined from 19.2% in 1997 to 17.3% in 2019, but increased to 18.3% in 2021.
A recent snapshot
In 2021, the industries with the highest collective bargaining coverage rates were public administration (75.5%), educational services (74.2%), utilities (65.1%) and health care and social assistance (53.6%). These industries all had relatively large proportions of public sector employees. In contrast, employees in professional, scientific and technical services (3.3%), agriculture (3.7%), and accommodation and food services (4.9%) had the lowest coverage rates. The vast majority of employees in these industries were in the private sector.
Largely as a result of their concentration in industries with a lower coverage rate, employees aged 15 to 24 (16.8%) were about half as likely to be covered by a collective bargaining agreement than employees aged 25 to 54 (33.5%) and 55 years and over (32.9%).
Since 1997, the first year when data on wages became available in the LFS, employees covered by collective bargaining have tended to earn higher hourly wages than their non-unionized counterparts.Note In 2021, employees covered by collective bargaining earned $33.19 per hour on average, compared with $28.62 for those with no coverage.
While temporary employment contracts are typically associated with lower employment security, permanent employees (31.7%) only had a slightly higher coverage rate than temporary employees (30.8%) in 2021.
Start of text box
Information on the indicator
Description or definition
The collective bargaining coverage rate indicator measures the union coverage rate, which is the number of employees in a union and non-members covered by a collective agreement or a union contract, expressed as a percentage of the total number of employees.
Source
Statistics Canada, Labour Force Survey, 1997 to 2021.
Information for interpretation
For more information on the Labour Force Survey (LFS) methodology and population coverage, please consult the Guide to the Labour Force Survey, 2020.
The LFS estimates are based on a sample and are therefore subject to sampling variability. The analysis focuses on differences between estimates that are statistically significant at the 95% confidence level. Due to rounding, estimates and percentages may differ slightly between different Statistics Canada products, such as analytical documents and data tables.
Industry coding is based on the North American Industry Classification System (NAICS) 2017.
Beginning in January 1997, employees are classified as: a) union member; b) not a member, but covered by a union contract or collective agreement; or c) non-unionized.
Other related information
Additional Statistics Canada data are available on the following subjects:
End of text box
- Date modified: