
Quality of Employment in Canada
Long working hours, 1976 to 2021
Skip to text
Text begins
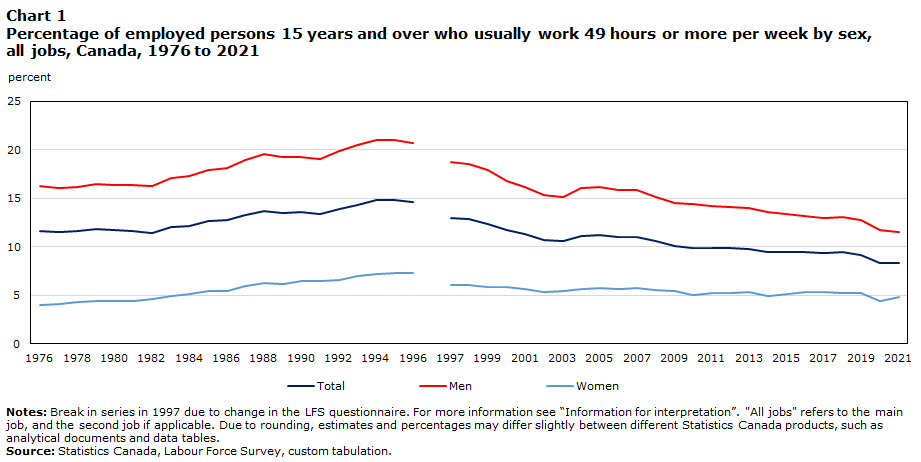
Less than 10% of workers in Canada usually worked very long hours (49 or more hours per week) in 2021, a proportion which has been trending down since 1997. Although most self-employed workers worked less than 49 hours per week, they were nearly five times more likely than employees to have worked long hours in 2021. Long working hours were also more common among men, and in the agriculture industry.
This indicator provides information on the proportion of employed persons who usually work 49 hours or more per week—that is, workers who have long working hours. The indicator covers usual hours worked at both the main and the second job (if applicable). This threshold is based on International Labour Organization (ILO) conventions,Note and in Canada, employees under the federal jurisdiction cannot work more than 48 hours under normal circumstances. Working long hours is related to different aspects of quality of employment. It could lead to difficulties managing work-life balance and negatively impact physical and mental well-being.
The analysis is based on data from the Labour Force Survey (LFS).
In March 2020, public health measures were introduced by governments to reduce the spread of COVID-19. These measures, which were eased and re-introduced in response to the different waves of the pandemic over the course of 2020 and 2021, resulted in the temporary closure of non-essential businesses, lower economic activity and reduced demand for labour. In this context, the share of workers who usually work 49 hours per week or more fell 0.8 percentage points to 8.3% from 2019 to 2020, the largest annual decline since the beginning of the comparable data series in 1997. Despite the easing of public health restrictions during the summer and fall of 2021, the proportion of workers who worked 49 hours or more per week remained at 8.3% on average in 2021.
Historical trends, 1976 to 2021
While data collected prior to 1997 are not directly comparable with data collected from 1997 onwards, the two time periods can be examined separately.
The percentage of employed persons working long hours was 11.6% in 1976. It then rose to a peak of 14.8% in 1994 and 1995. With the exception of the period between 2003 and 2008, the proportion of workers with long usual hours followed a long-term downward trend from 1997 to 2021. The decline from 1997 to 2021 was mostly driven by a decrease in the proportion of men working long hours.
Throughout the 1976 to 2021 period, women were less likely than men to work long hours. However, the gap has narrowed over time, primarily due to a reduction in the proportion of men working long hours. In 1976, 4.0% of employed women worked 49 hours or more hours per week, compared with 16.2% of men—a gap of 12.2 percentage points. By 2021, the prevalence of long hours among men was down 4.7 percentage points to 11.5%. Among women it changed less, rising 0.8 percentage points to 4.8%, resulting in a gap of 6.7 percentage points in 2021.
Data table for Chart 1
| Total | Men | Women | |
|---|---|---|---|
| percent | |||
| 1976 | 11.6 | 16.2 | 4.0 |
| 1977 | 11.5 | 16.0 | 4.1 |
| 1978 | 11.6 | 16.1 | 4.3 |
| 1979 | 11.8 | 16.5 | 4.4 |
| 1980 | 11.7 | 16.4 | 4.4 |
| 1981 | 11.6 | 16.4 | 4.4 |
| 1982 | 11.4 | 16.2 | 4.6 |
| 1983 | 12.0 | 17.1 | 4.9 |
| 1984 | 12.1 | 17.3 | 5.1 |
| 1985 | 12.6 | 17.9 | 5.4 |
| 1986 | 12.7 | 18.1 | 5.4 |
| 1987 | 13.3 | 18.9 | 5.9 |
| 1988 | 13.7 | 19.5 | 6.3 |
| 1989 | 13.5 | 19.2 | 6.2 |
| 1990 | 13.6 | 19.2 | 6.5 |
| 1991 | 13.4 | 19.0 | 6.5 |
| 1992 | 13.9 | 19.9 | 6.6 |
| 1993 | 14.3 | 20.5 | 7.0 |
| 1994 | 14.8 | 21.0 | 7.2 |
| 1995 | 14.8 | 21.0 | 7.3 |
| 1996 | 14.6 | 20.7 | 7.3 |
| 1997 | 13.0 | 18.7 | 6.1 |
| 1998 | 12.8 | 18.5 | 6.0 |
| 1999 | 12.3 | 17.9 | 5.8 |
| 2000 | 11.7 | 16.8 | 5.8 |
| 2001 | 11.3 | 16.1 | 5.6 |
| 2002 | 10.7 | 15.3 | 5.3 |
| 2003 | 10.6 | 15.1 | 5.4 |
| 2004 | 11.1 | 16.0 | 5.6 |
| 2005 | 11.2 | 16.1 | 5.7 |
| 2006 | 11.0 | 15.8 | 5.6 |
| 2007 | 11.0 | 15.8 | 5.7 |
| 2008 | 10.6 | 15.1 | 5.5 |
| 2009 | 10.1 | 14.5 | 5.4 |
| 2010 | 9.9 | 14.4 | 5.0 |
| 2011 | 9.9 | 14.2 | 5.2 |
| 2012 | 9.9 | 14.1 | 5.2 |
| 2013 | 9.8 | 14.0 | 5.3 |
| 2014 | 9.5 | 13.6 | 4.9 |
| 2015 | 9.5 | 13.4 | 5.1 |
| 2016 | 9.4 | 13.2 | 5.3 |
| 2017 | 9.3 | 13.0 | 5.3 |
| 2018 | 9.4 | 13.1 | 5.2 |
| 2019 | 9.1 | 12.7 | 5.2 |
| 2020 | 8.3 | 11.7 | 4.4 |
| 2021 | 8.3 | 11.5 | 4.8 |
|
Notes: Break in series in 1997 due to change in the LFS questionnaire. For more information see “Information for interpretation”. "All jobs" refers to the main job, and the second job if applicable. Due to rounding, estimates and percentages may differ slightly between different Statistics Canada products, such as analytical documents and data tables. Source: Statistics Canada, Labour Force Survey, custom tabulation. |
|||
A recent snapshot
Differences in the prevalence of long working hours between demographic groups, industries, and types of jobs mostly held steady during the COVID-19 pandemic in 2020 and into 2021.
Younger workers aged 15 to 24 have consistently had the lowest incidence of long hours over the past four decades. Younger workers are more likely to be in full-time education and tend to have lower labour market attachment. In 2021, 3.7% of them usually worked long hours, the smallest proportion among the main age groups. The proportion of long hours among workers aged 55 and older (9.6%) was higher than the rate for workers aged 25 to 54 (8.8%).
In 2021, workers who were self-employed in their main job (26.4%) were more likely than employees (5.3%) to work 49 hours or more per week. As a result, while the self-employed accounted for 14.1% of all employed persons, they comprised 44.9% of those working long hours.
Across industries, the incidence of long hours in the main job in 2021 was highest in agriculture (32.0%), natural resources (23.2%), transportation and warehousing (17.4%), and construction (12.8%). The lowest rates were recorded among workers in utilities (1.9%), public administration (1.2%), and educational services (2.2%).
The long hour rate declined in most industries from 2019 to 2021, and a notable decrease was recorded in professional, scientific and technical services (-1.6 percentage points).
The rate of self-employment, the composition of jobs by industry, and legislation relating to maximum weekly working hours vary by province. In 2021, the prevalence of long working hours ranged from 6.2% in Quebec to 12.6% in Prince Edward Island.
Start of text box
Information on the indicator
Description or definition
The long working hours indicator is the number of employed persons who usually work 49 hours or more per week at their main and second job (if applicable), expressed as a percentage of all employed persons.
Source
Statistics Canada, Labour Force Survey, 1976 to 2021.
Information for interpretation
For more information on the Labour Force Survey (LFS) methodology and population coverage, please consult the Guide to the Labour Force Survey, 2020.
The LFS estimates are based on a sample and are therefore subject to sampling variability. The analysis focuses on differences between estimates that are statistically significant at the 95% confidence level. Due to rounding, estimates and percentages may differ slightly between different Statistics Canada products, such as analytical documents and data tables.
Industry coding is based on the North American Industry Classification System (NAICS) 2017.
Prior to January 1997, usual hours were the number of hours usually worked by the respondent in a typical week, regardless of whether they were paid. Beginning January 1997, usual hours for employees refers to their normal paid or contract hours, not counting any overtime. However, the definition of usual hours remains unchanged for the self-employed and unpaid family workers. In January 1997, the LFS questionnaire was changed to allow responses up to 168 hours per week. Prior to 1997, the upper limit was set at 99 hours.
In addition, the calculation of usual hours worked for those who changed jobs during the reference week was modified. Prior to 1997, total usual hours consisted of the sum of usual hours worked at the main and second job (if applicable). After 1997, total usual hours worked for job changers refers to usual hours at the new or main job.
Other related information
Additional Statistics Canada data are available on the following subject:
End of text box
- Date modified: