Interprovincial trade flows
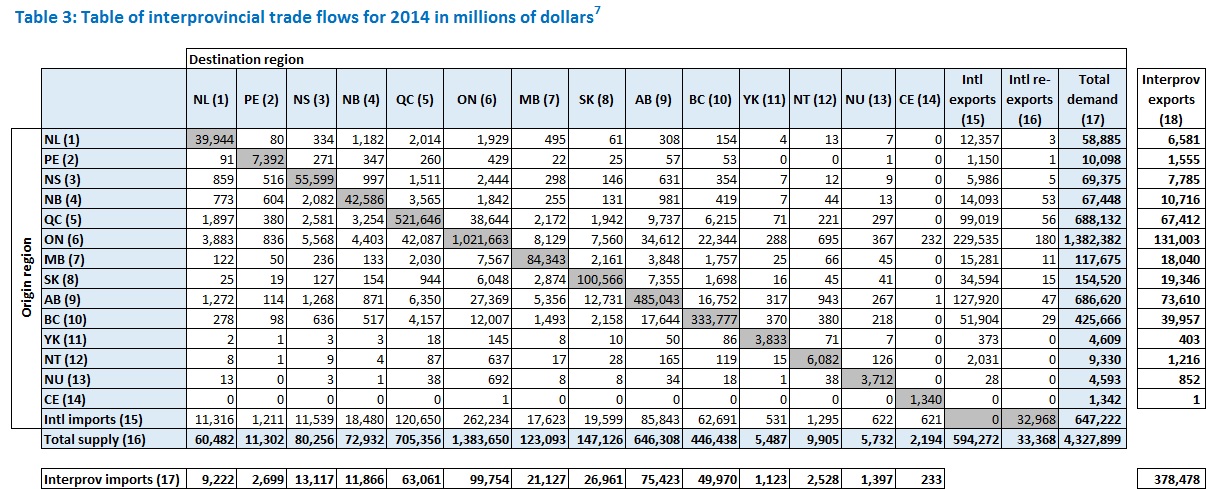
Trade flows among provinces, territories, and the rest of the world are also presented in the form of interprovincial trade flows tables (IPTF) for each product. Table 3 contains an aggregated form of an IPTF table.

The number along each row (other than the diagonal) represents the exports of the region to other regions and to the rest of the world. The number down each column (other than the diagonal) represents the imports of the region from other regions and from the rest of the world. The number in the diagonal represents a region’s consumption of domestically-produced goods and services.
As an example, Quebec’s total domestic supply of products is $688 billion, and is distributed as follows: $99 billion as international exports, $67 billion as exports to other provinces, $522 billion as own consumption of products produced domestically. Of the total product requirement of $705 billion, Quebec imports $121 billion internationally, $63 billion from other provinces, of which $42 billion are from Ontario.
Canadian provinces and territories exported $594 billion of products internationally in 2014. Total interprovincial exports were valued at $378 billion. Ontario accounts for 41% of the country’s foreign trade[8]. In the realm of interprovincial trade, Ontario and Quebec together account for 52% of all interprovincial exports.
- Date modified: