
Latest Developments in the Canadian Economic Accounts
Canadian regional labour statistics and inter-regional movements of paid workers, 2001 to 2021
Skip to text
Text begins
Summary
This paper focuses on the newly built regional labour statistics based on the economic regions where people work. The estimates contained in the regional labour data are experimental and subject to revision. The data allow us to analyse regional labour markets as well as to track the flows of workers from one economic region to other regions. The inter-regional analyses reveal that Québec and Ontario include the economic regions that were the largest sources or destinations of workers in 2021. Each economic region that records a large net inflow of jobs is surrounded by a cluster of economic regions that record considerable net outflows of workforce to different destinations. Such clusters have been formed around Montréal, Toronto, Ottawa, and Capitale-Nationale (around Québec City).Note Within these clusters, the main donors of jobs are the Montérégie, Lanaudière, Laurentides, and Hamilton - Niagara Peninsula regions.
The job distribution shows that 55 out of 76 economic regions each had less than 1.0% of Canadian jobs, while the Toronto region reported the highest proportion at 19.3% in 2021. About 47 economic regions had positive, average annual growth rates of jobs between 2010 and 2021. Among them are all the economic regions in British Columbia, regions in Southern Ontario, all the regions in Québec except the eastern ones, Prince Edward Island and the three territories. The long run analysis demonstrates that the Calgary, Edmonton, and London regions switched from recording net inflows of jobs from other regions to net outflows. While the Toronto and the Montréal regions faced upward trends in their net inflows of jobs during the last decade, the Ottawa, Winnipeg and Capitale-Nationale regions experienced mild continuous declines in their net inflows of jobs.
With the outset of the COVID-19 pandemic and the related impact of public health measures on the labour market, all economic regions lost jobs in 2020. The economic regions with the highest job losses (between 90,000 and 400,000 jobs) were employment hubs such as Toronto, Lower Mainland – Southwest (in British Columbia), Montréal, Calgary and Edmonton. The regions around the first three of these hubs ranked next. Considering the 15 economic regions with the highest job losses in 2020 (between 30,000 and 400,000 jobs), 11 of them had job recovery rates between 80.0% and 95.0% in 2021. Except for four economic regions (including Winnipeg and Edmonton), the rest of the regions in the Prairies had low recovery rates while almost half of the regions in the Atlantic provinces fully recovered.
In 2021, all the economic regions in Southern British Columbia and most of the regions in Central and Southern Québec recorded one less week of work than the national average hours (1,685 hours).
Keywords: Economic region, regional labour statistics, number of jobs, number of hours worked, inter-regional labour movements.
1. Introduction
Although monthly statistics for employment are available,Note such statistics are based on where a worker lives. Residence-based statistics are useful for household analyses involving final demand and wealth. However, statistics related to the production of goods and services, the corresponding value added and the performance of economic regions should be based on where the person works. To build up new labour statistics in terms of region of work, the available residence-based information from the Labour Force Survey (LFS) must be adjusted. The adjustments can yield estimates for the number of workers who come to work in a region and for the number of its residents who leave the region to work elsewhere. The difference between these two values determines whether a region has a net inflow or a net outflow of workforce.
This paper reviews the methodology in creating these new experimental regional labour statistics. It analyzes the regional distributions of jobs and hours worked and unveils the inter-regional dynamics of paid workers among economic regions of work using geographic maps. This paper is the first that compares such statistics over an entire decade (2010 to 2021) and investigates the extent to which the COVID-19 pandemic restrictions affected employment and labour movements among regional economies.
The analysis contained in this paper, based on this newly developed dataset, is distinguishable from that in other studies, such as Morissette et al. (2016) who examined regional hiring and layoff rates built upon the residential information of workers. It is similarly distinct from Morissette (2018), in which the analysis is limited to the number of tax filers who had some paid employment income in a given year.Note In addition, the new data facilitate the integrated exploration of all regional labour markets, whereas previous papers focused on labour market features in one or a few regions. For example, Siman and Adeyemo (2019) analyzed net inter-provincial migration in the region of London in Ontario. In their study, they described the movement from one place of residence to another, using all labour force (i.e., employed and unemployed). On the other hand, this paper shows the net flows of jobs based on movement from the most recent place of residence to the place of work, focusing only on employed workers.
As it will be shown in this paper, the analyses of inter-provincial labour movements by Laporte and Lu (2013) can mask which regions in a province are suffering from labour shortages or faced with labour surpluses, key elements that these new data can highlight. It should be noted that there are some studies that go even further and focus on municipalities within economic regions. However, these studies are generally restricted to census years and analyze only a few municipalities. Using 2001 and 2006 census data, for example, Turcotte and Vézina (2010) tracked the movements of people aged 25 to 44 years from central municipalities of metropolitan areas such as Toronto, Montréal and Vancouver to surrounding municipalities.
The rest of the paper is structured as follows. Section 2 explains the new regional database and its methodology. Section 3 identifies employment hubs and the distribution of total jobs around them. Section 4 analyzes the inter-regional movements of paid workers. Section 5 explores changes in the regional labour markets during the last decade. Section 6 focuses on the impact of the COVID-19 pandemic restrictions on employment and its regional dynamics. Section 7 discusses annual average hours worked for the regions and section 8 concludes the discussion.
2. Data and methodology
Previously, labour statistics for economic regions were available only by special request. The regional labour data were released in an experimental database for the public on May 20, 2022.Note The published table contains several time series beginning in 2001 and the data contain regional labour statistics, such as number of jobs and hours worked by class of worker (paid workers and self-employed jobs),Note net regional flows of jobs for paid workers and net international flows of jobs for paid workers (those who crossed the Canada-USA border on a daily basis). All statistics are available for full-time and part-time work schedules, except for the net international flows.
Since sampling for the LFS is based on economic regions, the new regional labour statistics are built upon LFS micro-databases. However, two adjustments are applied to the LFS information: the workers who were on unpaid leaves (like strikes) are excluded and secondary job holders are counted twice. The concepts of jobs and workers should be interpreted with caution in this paper, since interregional flows of jobs actually refer to interregional flows of workers filling those jobs. Some of these workers may potentially be counted twice in the flow if they leave their region to work in two different jobs during the same reference week. Finally, to construct a robust and extended time series for these labour statistics based on a region of work, LFS information is combined with available census information (see Appendix A for more details).
Census data have exhaustive information on the movements of workers from their home regions to their work regions. For an economic region, the proportion of workers who left the region to work in other regions is calculated for census years. These proportions are expanded following a logistic transformation to create a time series. The subsequent ratios are applied to the estimates of employment from the LFS (by region of residence) to obtain the preliminary estimates for the number of jobs by region of work. These regional estimates are then reconciled with provincial and territorial benchmarksNote of jobs.
The procedure estimates the number of workers who entered a region and the number of workers who left the region. The resulting statistics are then used to calculate the net flows of paid workers jobs for each economic region (inflows minus outflows). The reconciliation process makes the inter-regional flows consistent with the estimation of inter-provincial flows that are already provided in the provincial benchmarks.Note Note that the net regional flows of jobs for self-employed workers are not conceptually applicable since, by definition, their business establishments correspond with their residences.
In addition, the regional hours worked are built up from detailed NAICSNote industry breakdowns from the census to better reflect the influence of the industry structure of each region on the intensity of hours worked. Thus, for each region of work, the proportion of workers working in different industries is calculated from census data and is then expanded for other years. The resulting industrial distribution of jobs is combined with provincial average hours worked to estimate an aggregate number of hours worked for the region. Finally, these regional hours worked are adjusted to respect provincial and territorial benchmarks.
3. Employment hubs and job distribution among regional labour markets, 2021
This section focuses on the distribution of total number of jobs among economic regions and identifies the employment hubs and their relationships with the regions around them in 2021.
An economic regionNote (ER) is a grouping of complete census divisions (CDs), with one exception in Ontario, created as a standard geographic unit for analysis of regional economic activity.Note The regional data reveal that the total number of jobs in Canada is heterogeneously allotted among the 76 economic regions because of their geographical and industrial distinctions. In 2021, 87.0% of total jobs were concentrated in four provinces: Ontario (39.0%), Québec (22.0%), British Columbia (14.0%) and Alberta (12.0%) (Table 1).
The regional distribution of total jobs shows that about half of economic regions had job proportions less than 0.5% (Map 1). Such regions were in the three territories, Manitoba (except Winnipeg), Atlantic provincesNote (except three regions), Saskatchewan (except two), Central and Northern British Columbia as well as Northern and Northeast Québec. On the other hand, the highest shares of total jobs were recorded in economic regions such as Toronto with 19.3%, Lower Mainland – Southwest (in British Columbia) with 9.0%, Montréal with 7.4% and Calgary with 4.6%. These four employment hubs accounted for 40.3% of jobs in Canada.
Ontario had no regions with job proportions less than 0.5%. The Toronto economic region, with 19.3% at the national level, accounted for half of its provincial share in Canadian jobs. The job proportions gradually decrease as the distance away from this hub grows. Toronto was followed by economic regions such as Ottawa with 4.1%, Kitchener – Waterloo – Barrie with 3.7% and Hamilton – Niagara Peninsula with 3.6%, all of which represent high proportions of total jobs at Canada level. After these regions were London with 1.9%, Windsor – Sarnia with 1.5%, Northeast with 1.3% and Kingston – Pembroke with 1.2%. The Northwest region had the lowest percentage at 0.6%, which nonetheless exceeded half of the economic regions in Canada.
In British Columbia, the job proportions declined considerably beyond its employment hub, Lower Mainland – Southwest. With 9.0% of Canadian jobs, this hub received two-third of its provincial share in Canadian jobs and was followed by two other economic regions: Vancouver Island and Coast with 2.2% and Thompson – Okanagan with 1.6%. The job proportions at the national level for the rest of the economic regions in this province were less than 0.5%, with the lowest at 0.1% for Nechako.
The employment proportions in the regions around Montréal in Quebec declined more sharply than regions around Toronto, but more gradually than those around Lower Mainland – Southwest in British Columbia. Montréal, with 7.4% of jobs at the national level, attracted one-third of the provincial share in Canadian jobs and was followed by Montérégie with 3.5%, Capitale-Nationale with 2.1%, Laurentides with 1.3%, Chaudière-Appalaches with 1.0% and Lanaudière with 0.9%. Six other economic regions in this province reported shares of total Canadian jobs between 0.5% and 0.9%. The regions located in Northern and Northeast Quebec received less than 0.5% of jobs, with the lowest, Nord-du-Québec, at 0.1%.
In Alberta, Calgary and Edmonton, with national job shares of 4.6% and 4.2%, accounted for about three quarters (73.0%) of their provincial share in Canadian jobs. The proportions rapidly dropped to a range of between 0.2% and 0.7% for Alberta’s remaining economic regions.
Other provinces had at most one region with proportions of total jobs above 1.0%. In Manitoba, Winnipeg received 2.3% of Canadian jobs, while the rest of its regions had less than 0.3%. In Saskatchewan, the job percentages for Regina – Moose Mountain and Saskatoon – Biggar were about 1.0%, and the rest of its regions had less than 0.5%. All regions in the four Atlantic provinces had job percentages less than 0.7%, except, Halifax in Nova Scotia that posted 1.3%. Finally, each of the three territories attracted about 0.1% of Canadian jobs.
Overall, Map 1 shows that except in Ontario and Québec, the proportions of total jobs rapidly declined when moving away from the employment hubs. Consequently, 66.0% of total jobs existed in 12 economic regions with job proportions between 2.0% and 19.3% (Table 2: A). Such an allocation can signal that some regional labour markets depend largely on workers from other regions of the country to meet their labour shortages. The next section will investigate this further.
4. Inter-regional movements of the labour force, 2021
In this section, the inter-regional movements of paid workers in 2021 are discussed. It will be shown that regions with high proportions of Canadian jobs are related to those that were the major net recipients or net donors of jobs in the labour force.
4.1 Net flows of paid workers jobs among economic regions, 2021
Because of regional job opportunities and regional labour shortages, many paid workers decide to commute on a daily basis or do one or more round trips every month to other regions for work. Such job dynamics can be illustrated for paid workers in 2021 (Map 2). The illustration distinguishes the economic regions with net inflows of jobs, those experiencing more workers 'moving in' than 'moving out' (positive net flow), from the regions with net outflows of jobs, those experiencing the reverse (negative net flow).
Each economic region that receives a large number of workers is surrounded by a cluster of economic regions that send a considerable workforce to different destinations. Quebec and Ontario have formed such clusters around Montréal with a net inflow of about 335,000 jobs, Toronto with a net inflow of 146,000 jobs, as well as Ottawa and Capitale-Nationale with net inflows of about 32,000 and 21,000 jobs respectively. Within these clusters, the main sources of labour are Montérégie with a net outflow of 144,000 jobs, Lanaudière with a net outflow of 78,000 jobs, Laurentides with a net outflow of 66,000 jobs and Hamilton - Niagara Peninsula with a net outflow of 61,000 jobs.
Table 2 (parts B and C) ranks the remaining regions with the largest net inflows and net outflows of jobs. After Capitale-Nationale and Wood Buffalo – Cold Lake with net inflows of about 20,000 jobs and Winnipeg with 18,000 jobs, the rest of the economic regions with positive net flows posted values less than 10,000 jobs. On the other hand, after Kitchener – Waterloo – Barrie with a net outflow of 53,000 jobs; Laval with a net outflow of 43,000 jobs; Outaouais with 31,000 jobs; Chaudière-Appalaches with 21,000 jobs; Muskoka – Kawarthas with 16,000 jobs and Southeast in Manitoba with a net outflow of 12,000 jobs, the rest of the economic regions with negative net flows of jobs recorded net outflows less than 10,000 jobs.
The next section examines whether economic regions with the high proportions of jobs are solely net receivers of jobs, solely net senders of jobs, or can be both.
4.2 Relation between job concentration and net flows of jobs, 2021
Table 2 shows that most of the economic regions with high proportions of total Canadian jobs (between 2.0% and 19.3%) can be either substantial recipients of labour from other regions or important suppliers of labour to other regions.
Parts A and B of the table identify the employment centers that received a large number of workers, such as Montréal, Toronto, Ottawa, Capitale-Nationale and Winnipeg. By contrast, Parts A and C highlight the employment centers that supplied a large number of workers compared to what they received, such as Montérégie, Hamilton – Niagara Peninsula and Kitchener – Waterloo – Barrie.
Four economic regions (Lower Mainland – Southwest, Vancouver Island and Coast, Calgary, and Edmonton) with high proportions of total jobs (between 4.6% and 9.0%) were neither major labour recipients nor major labour suppliers. The three latter regions had net outflows of jobs between about 2,000 and 6,000 jobs. On the other hand, Wood Buffalo – Cold Lake with a low job proportion of 0.5% in national jobs was ranked fifth among the labour recipients (with a net inflow of 20,000).
The next section will discuss the changes in regional jobs and inter-regional movements during the last decade.
5. Regional labour markets in the decade from 2010 to 2021
This section discusses which of the economic regions attracted more employment and which of them lost more labour during the period of 2010 to 2021. Also, it explores the long-run changes in net flows of jobs in these regions.
5.1 Average annual growth rates of jobs in the economic regions
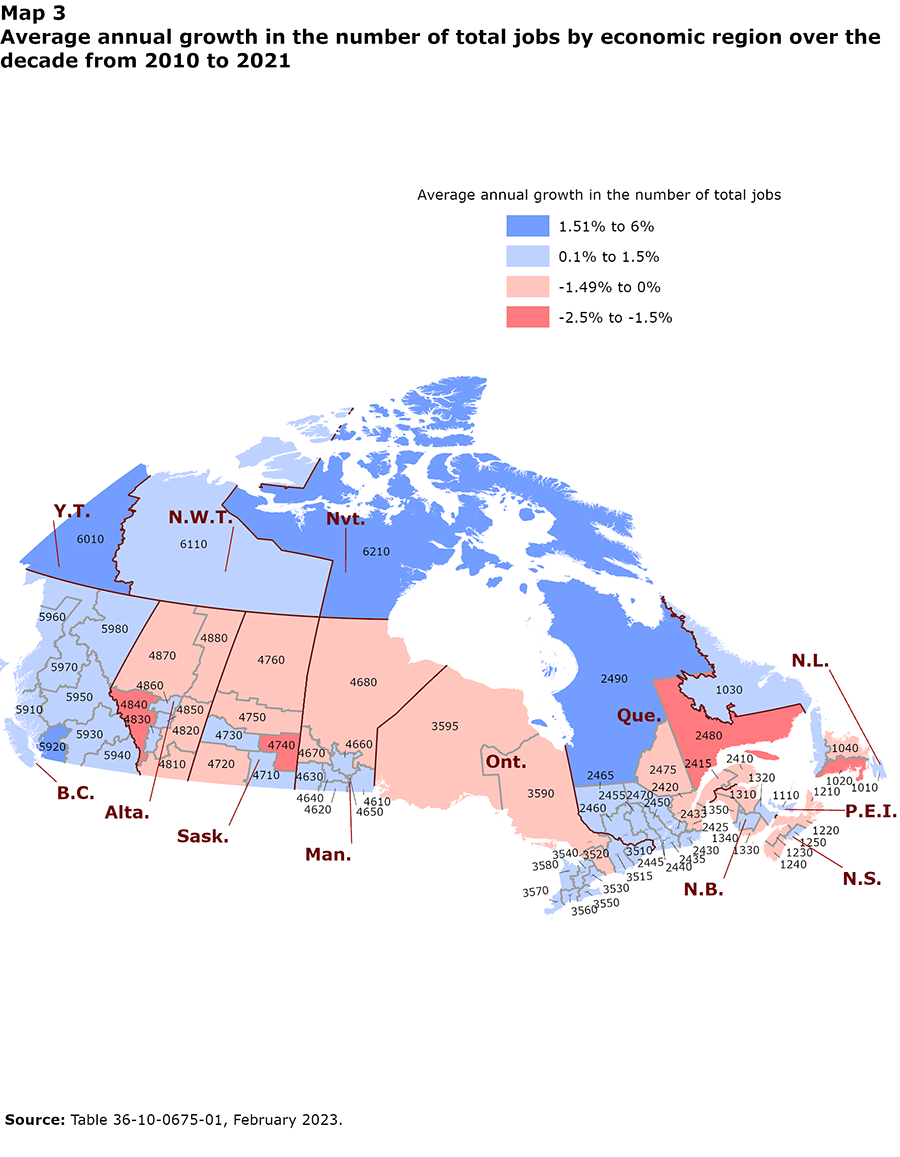
To estimate the long run trends in the regional distribution of employment, the annual growth rate of jobs between 2010 and 2021 was calculated like the compound interest rate. Among 76 economic regions, 47 regions had positive annual growth rates (between 0.1% and 6.0% a year on average). They include all the economic regions in British Columbia, Southern Ontario, all the regions in Québec except Eastern ones, Prince Edward Island and the three territories (Map 3). Among them, the highest growth rates belonged to Nord-du-Québec with 6.0% (from about 11,800 to 22,300 jobs), Nunavut with 3.5% (from about 15,000 to 22,000 jobs), Lower Mainland – Southwest with 2.0% (from about 1,380,000 to 1,717,000 jobs) and Yukon with about 1.9% (from about 22,000 to 27,000 jobs), see Table 3: A-1. The remaining regions with labour gains had growth rates less than 1.5%.
The economic regions with large gains in the number of jobs between 2010 and 2021 were among the ones with lower growth rates. The Toronto region with an average annual growth rate of 1.5% gained 510,000 in jobs (from about 3,166,000 to 3,675,000); the Montréal region with an average growth rate of 1.1% added 153,000 jobs (from about 1,250,000 to 1,403,000); Edmonton with a growth rate of 1.4% experienced about 115,000 in job gains (from about 688,000 to 802,000) and Calgary with a growth rate of 1.1% gained 96,000 in jobs (from about 775,000 to 870,000), see Table 3: A-2.
The remaining 29 economic regions had annual growth rates between -2.5% and -0.1%. These economic regions were mostly in Alberta, Saskatchewan, Northern Manitoba, Northern Ontario, Eastern Québec, the Atlantic provinces (except Prince Edward Island). Overall, reductions in the number of jobs over the decade were not very large. Côte-Nord in Québec, with an average annual growth rate of -2.5%, recorded 12,000 in job declines (from about 52,000 to 39,000); Banff – Jasper – Rocky Mountain House, with an average growth rate of -1.8%, lost 10,000 jobs (from about 54,000 to 45,000), see Table 3: B-1. The other economic regions with the largest reductions in jobs were Camrose – Drumheller with an average growth rate of -1.3%, which lost about 15,000 jobs, and the Northeast region in Ontario with an average growth rate of -0.4%, which lost about 12,000 jobs during the decade, see Table 3: B-2.
5.2 Long-run trends in the inter-regional movements of jobs
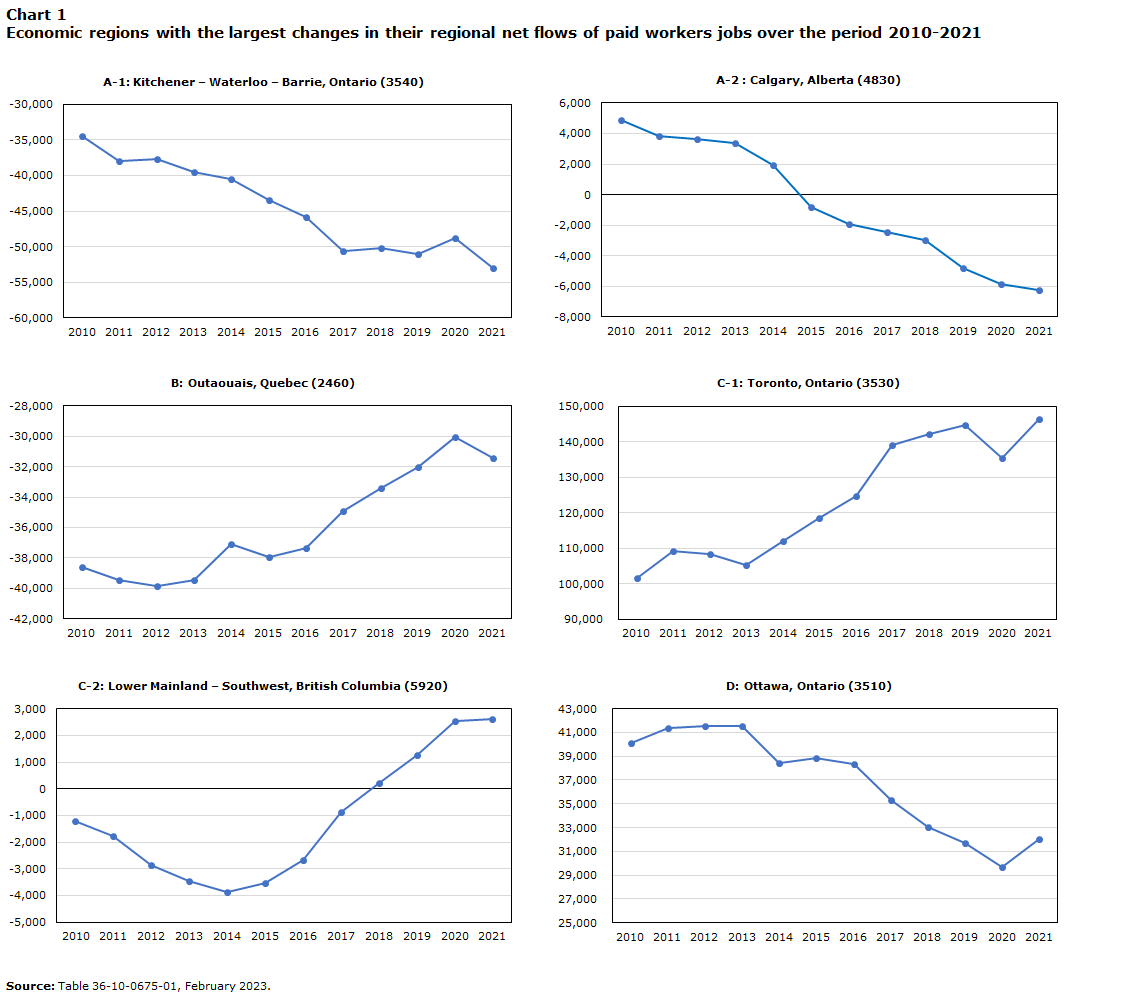
Although 64 regions preserved their status as either net suppliers or net recipients of jobs during the period 2010 to 2021 (Map 4), a few patterns can still be identified for the long-run movements in the net flows of jobs (Table 4 and Chart 1). The patterns are discussed for those regions with significant changes in their net flows of jobs.
There are three main movement patterns for the economic regions that ended with negative net flows of jobs in 2021. Some of them experienced a decade of steady increases in their net outflows of jobs (Table 4: A-1). For example, the net flows of jobs in Kitchener – Waterloo – Barrie experienced an accelerating negative trend, from approximately a net outflow of 34,000 jobs in 2010 to a net outflow of 53,000 jobs in 2021, an increase of 18,600 in net outflows of jobs. (Chart 1: A-1). A few regions with continuous reductions in their net inflows of jobs eventually became net suppliers of jobs (Table 4: A-2). Calgary started with a net inflow of about 4,900 jobs in 2010, switched to a net job supplier in 2015, and ended up with 6,300 in net outflows of jobs by 2021 (Chart 1: A-2). Regions such as Edmonton and London had similar scenarios. Other regions had steady decreases in their net outflows of jobs (Table 4: B). The net outflows of jobs in Outaouais continuously decreased from a net outflow of 38,600 jobs in 2010 to 31,400 jobs in 2021 (Chart 1: B).
Similarly, there are three main patterns for the economic regions that ended with positive net inflows of jobs in 2021. Some regions experienced continuous increases in their net inflows of jobs (Table 4: C-1). For example, the net inflows in the Toronto region went up from about 102,000 jobs in 2010 to about 146,000 jobs in 2021, resulting in an increase of 44,700 jobs (Chart 1: C-1). A few regions switched from net suppliers of jobs to net recipients of jobs (Table 4: C-2). Among them, Lower Mainland – Southwest had a U-shape trend for its net flows of jobs: it started with a net outflow of roughly 1,200 jobs in 2010, reached a maximum of net outflows of about 4,000 jobs in 2014, and then experienced continuous reductions in its net outflows until 2018 when it started to become a net job recipient with a net inflow of about 3,800 jobs by 2021 (Chart 1: C-2). Other regions had steady decreases in their net inflows of jobs (Table 4: D). In 2010, the Ottawa region started with a net inflow of 40,000 jobs that continuously declined to reach a net inflow of 32,000 jobs in 2021 (Chart 1: D).
The next section details the resilience of the regional labour market during the period of the COVID-19 pandemic.
6. Impacts of the COVID-19 pandemic and public health measures on regional employment and inter-regional movements, 2019 — 2021
In this section, the labour statistics for 2019 (the year before the start of the COVID-19 pandemic) are compared with the statistics in 2020 and 2021 to investigate the impacts of the restrictions resulting from the pandemic and the related public health measures on both the regional labour markets and the inter-regional labour movements. The calculated recovery ratesNote discussed in this section will show what percentages of the regional jobs lost in 2020 (compared with 2019) were recovered in 2021.
6.1 Big regional job cuts belonged to employment hubs
A comparison of the number of total jobs between 2019 and 2020 shows that all the economic regions lost jobs in 2020 (Map 5). The economic regions with the largest proportions of Canadian jobs also recorded the greatest job losses in 2020. All the regional employment hubs experienced between 90,000 and 400,000 job reductions during the first year of the pandemic. The job declines in the Toronto region were about 392,600 jobs; roughly 193,600 jobs in Lower Mainland – Southwest, about 133,200 jobs in Montréal, and around 95,000 jobs in Calgary and Edmonton. Moreover, the regional job markets around the first three employment hubs mentioned lost between 40,000 and 90,000 jobs in 2020 (Table 5). In terms of percentage changes, all these regions lost between 9.0% and 12.0% of jobs.
However, some other regions had job reductions above 15.0% in 2020: Windsor – Sarnia in Ontario with 19.0% (58,200 job losses); Banff – Jasper – Rocky Mountain House in Alberta with 17.0% (8,900 job losses) and Gaspésie – Îles-de-la-Madeleine in Québec with 15.0% (5,000 job losses).
Overall, the regions that lost approximately 10,000 or more jobs were all regions located in Ontario; all the regions in Québec, except four; all the regions in Alberta, except two; three regions in the south and southwest of British Columbia; two regions in Saskatchewan; Winnipeg in Manitoba, and two regions in the Atlantic provinces (Map 5).
6.2 Regional job recovery rates, 2021
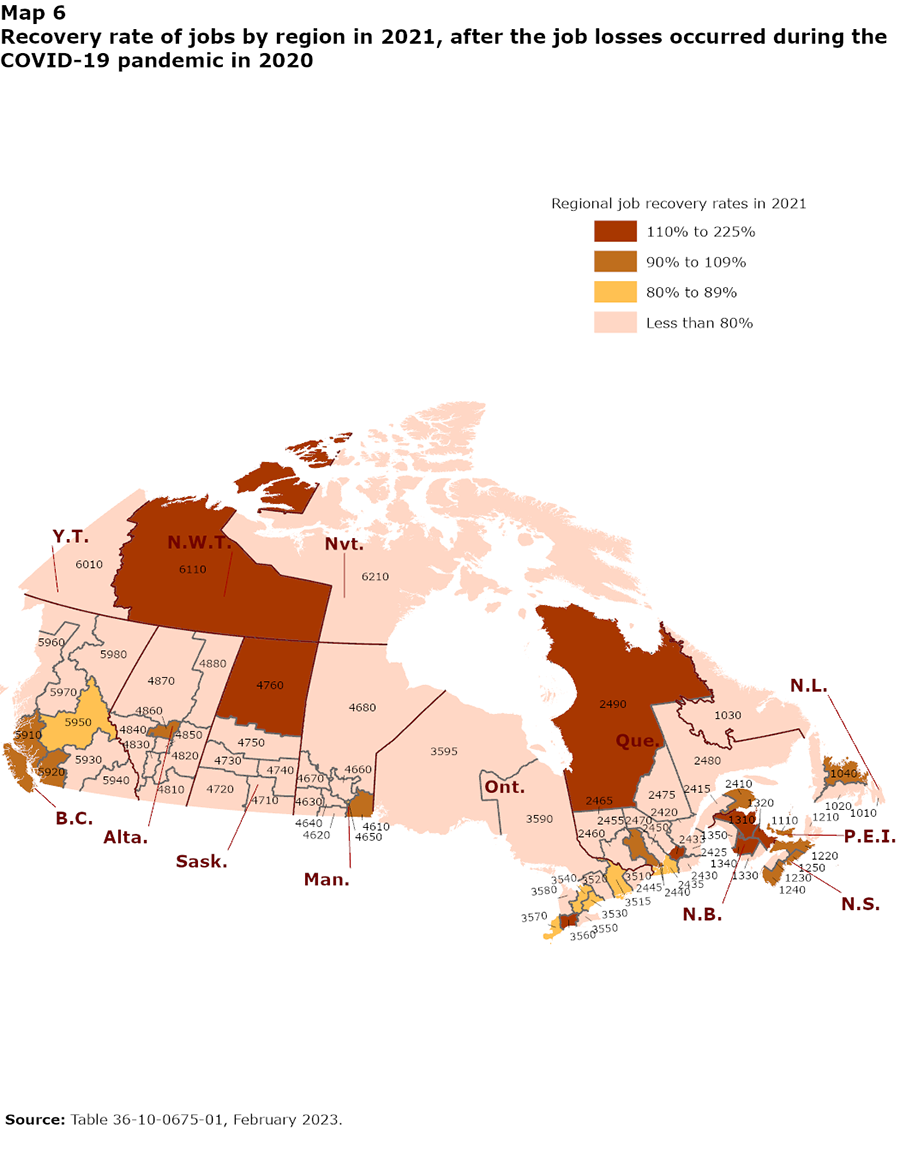
Although the impact of COVID-19 pandemic and the related public health measures on labour market were mitigated in 2021, most of the regional job markets still possessed a smaller number of total jobs in 2021 than in 2019. A recovery rate that is less than 100% indicates the portion of the regional job losses (occurring during 2020) that were refilled in 2021. A recovery rate greater than 100% indicates that the number of jobs in 2021 surpassed the level in 2019. If the rate is negative, it means that the region recorded further job losses in 2021 and thus ended up with even fewer jobs than 2019.
There are not very specific recovery patterns among the regions in Canada (see Map 6). Firstly, eleven out of 15 economic regions with the highest job losses in 2020 (between 30,000 and 400,000) had job recovery rates between 80.0% and 95.0% (Table 5). Also, most of the economic regions with recovery rates above 90.0% were in the Atlantic Provinces (eight regions), in Québec (Montréal, Laval and four other regions), the London region in Ontario, three regions in Prairies, two regions in southwest of British Columbia and the Northwest Territories. The list of all the economic regions with more than 90.0% recovery rates can be found in Table 6.
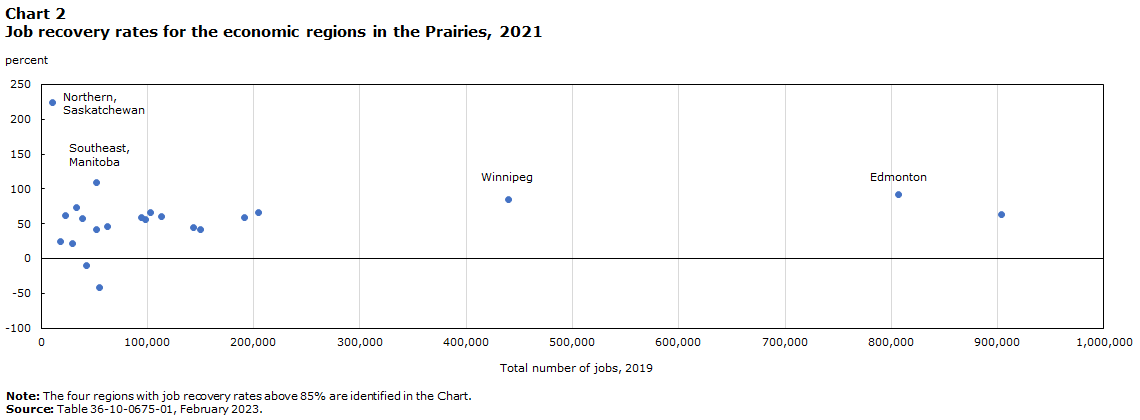
Most of the economic regions in Southern Ontario had milder recovery rates between 80.0% to 90.0%. In the Prairies, except for Edmonton, Winnipeg, and two other regions that had recovery rates above 85.0%, the other 18 regions had weak recovery rates - even those with relatively large initial labour markets (i.e., high number of total jobs in 2019) (Chart 1). In contrast, 6 out of 11 regions located in Prince Edward Island, Nova Scotia and New Brunswick had full or more than 100% recovery rates (Chart 2).
There were two regions with strong negative recovery rates that lost further jobs in 2021.Note South Coast – Burin Peninsula in Newfoundland and Labrador had a negative recovery rate (-120.0%), from 11,370 jobs in 2019 to 10,830 in 2020 and then 10,160 jobs in 2021, and Swift Current – Moose Jaw in Saskatchewan had a negative recovery rate (-40.0%), from 54,850 jobs in 2019 to about 52,770 in 2020 and then 51,920 jobs in 2021.
7. Average hours workedNote by economic region, 2021
The annual average hours worked in Canada was 1,685 hours in 2021. In what follows, the hours worked for economic regions will be compared with the national level based on the average weekly hours worked of 32 hours.Note
The economic regions where workforce, on average, worked at least one week less than the national level were Muskoka – Kawarthas in Ontario, almost all the economic regions in Central and Southern Québec and all the economic regions in Southern British Columbia (Map 7). On the other hand, most of the economic regions in the Prairies, the Toronto region as well as the northern regions in both Newfoundland and New Brunswick recorded average-hours worked that were at least one week more than the national level. The economic regions with average-hours worked that were four weeks above the national level were West Coast – Northern Peninsula – Labrador, Nunavut and Wood Buffalo – Cold Lake.
In general, for a given region, average-hours worked increase when there are more full-time workers.
8. Conclusion
The movement of labour between regions is economically efficient because it allows workers to move to where they are most needed. It can also be an acceptable public policy objective at the local and provincial level, if it supports justified social and economic interests such as encouraging local development. To improve policies on inter-regional labour mobility, high quality and relevant data are needed. This paper explores the new, experimental regional labour statistics for the period from 2001 to 2021 in which labour force information is adjusted to reflect the economic regions where people work. This new database readily facilitates the analyses of regional labour markets and allows users to examine regional distributions of jobs and hours worked and to track inter-regional labour movements.
In 2021, the economic regions that were either substantial net recipients or net suppliers of labour were among the regions with the highest proportions of total Canadian jobs. There were 12 out of 76 economic regions with job proportions between 2.0% and 19.3%, and these represented 66.0% of the national jobs. Except in Ontario and Québec, the proportions of total jobs in the economic regions rapidly dropped by moving away from the main employment hubs. Also, most of the regions in Prairies and in the Atlantic provinces were net recipients of jobs.
During the first year of the COVID-19 pandemic in 2020, the subsequent public health measures meant many Canadians were unable to work, especially in the regional employment hubs such as Toronto, Lower Mainland – Southwest, Montréal, Calgary, and Edmonton. From 2010 to 2021, 64 out of 76 economic regions preserved their directions as being either the net suppliers or the net recipients of labour force. Some of the principal labour-supplying regions had steady increases in their net outflows of jobs during the last decade.
In the future, inter-regional movements can be linked to more demographic factors and regional macroeconomic variables such as income, Gross Domestic Product (GDP) and unemployment rates to better understand the dynamics of regional economies. For example, the rapid aging of the population in one region, which is explained by its different relative age structure, can contribute to a significant decline in the unemployment rate of that region. This should help retain workers in that region while limiting labour outflows, but may also result in tightening local labour conditions and increased labour costs.
Experimental estimates of regional labour data were recently included as part of the release of annual labour statistics data. As the database is experimental, feedback is welcomed on these regional labour statistics as this product is improved in future iterations.
References
Laporte, C., & Lu, Y. (2013). Inter-provincial employees in Canada. Ottawa: Statistics Canada.
Morissette, R. (2018). The Effect of Labour Demand on Regional Demographics. Statistics Canada.
Morissette, R., Ci, W., & Schellenberg, G. (2016). Hiring and Layoff Rates by Economic Region of Residence: Data Quality, Concepts and Methods. Statistics Canada.
Siman, E. (2019). Labour Force Participation in London Economic Region–Follow-up study. Elgin Middlesex Oxford Workforce Planning and Development Board & Local Employment Planning Council.
Statistics Canada. (2023). Table 36-10-0675-01. Labour statistics consistent with the System of Provincial and Territorial Economic Accounts, by economic regions, job category and work schedule.
Turcotte, M., & Vézina, M. (2010). Migration from central to surrounding municipalities in Toronto, Montréal and Vancouver. Canadian Social Trends, 90, 3-24.
Appendix A
Building up the number of paid workers jobs based on a region of work
This appendix explains the process to estimate the number of jobs based on the region of work. For simplicity, we ignore the schedule dimension (full-time and part-time) of labour statistics in what follows. Also, the procedure applies other adjustments to take into account strikes, net international flows of workers and the population not covered by LFS, such as military personnel and workers on indigenous reserves.
Proportion of paid workers jobs (based on census information)
Census data contain the number of workers from region who worked in region (2001, 2006, 2011 and 2016 census). For each region like that received workers from region , the job ratio can be calculated for each year of census as follows:
is calculated for paid workers jobs. By changing the numerator from region to region , the job ratios for paid workers of region who worked in region are obtained. The sum of these ratios must be equal to 1.
To create annual time series for the proportion of residents of who worked in , , available ratios from census years are mapped to the interval of by a logistic distribution. The resulting values are expanded with a cubic spline function to get a flexible times series . Then the time series created for each ratio, such as , is mapped back to the interval of . After that, all of the resulting job proportions related to region in a specific year are renormalized, , to make sure that they add up to 1:
Estimating the number of paid workers who work in an economic region
For year , multiplying normalized by the number of paid workers jobs from LFS (based on place of residence), , the number of paid workers who lived in region but went to work in region is estimated as:
By repeating equation (3) but changing region to in the formula, the number of other workers who worked in region B but were residents of other regions (or residents of region (itself)) in year are calculated. By adding them up, the total number of workers who worked in region in year is obtained.
The above procedure can be repeated for other economic regions that are in the same province with region to obtain total number of paid workers who worked in those regions. The sum of these regional jobs gives the number of paid workers who worked in that province.
The estimated provincial and territorial jobs for paid workers need to be equal to their provincial and territorial benchmarks (based on place of work). However, such equalities are not necessarily guaranteed. A “Raking” procedure, which restores additivity in a system of time series measured at the same frequency, is used to update the estimated number of paid workers for each economic region in a province. The resulting provincial and territorial jobs will match with provincial and territorial benchmarks (based on the place of work).
Appendix B
Tables, Charts and Maps
| Provinces, territories and economic regionsTable 1: Proportions of total jobs and net flows of paid workers jobs by province and economic region, 2021 Note 1 | Economic region unique identifier | Net flows of paid workers jobsTable 1: Proportions of total jobs and net flows of paid workers jobs by province and economic region, 2021 Note 2 | Percentage of total Canadian jobs |
|---|---|---|---|
| Newfoundland and Labrador | 10 | -3,610 | 1.1 |
| Avalon Peninsula, Newfoundland and Labrador | 1010 | 515 | 0.7 |
| South Coast – Burin Peninsula, Newfoundland and Labrador | 1020 | -930 | 0.1 |
| West Coast – Northern Peninsula – Labrador, Newfoundland and Labrador | 1030 | -90 | 0.2 |
| Notre Dame – Central Bonavista Bay, Newfoundland and Labrador | 1040 | -3,105 | 0.2 |
| Prince Edward Island | 11 | -1,305 | 0.4 |
| Nova Scotia | 12 | -3,125 | 2.5 |
| Cape Breton, Nova Scotia | 1210 | -1,050 | 0.3 |
| North Shore, Nova Scotia | 1220 | -1,810 | 0.4 |
| Annapolis Valley, Nova Scotia | 1230 | -8,110 | 0.3 |
| Southern, Nova Scotia | 1240 | -795 | 0.3 |
| Halifax, Nova Scotia | 1250 | 8,640 | 1.3 |
| New Brunswick | 13 | -2,195 | 1.9 |
| Campbellton – Miramichi, New Brunswick | 1310 | -1,100 | 0.3 |
| Moncton – Richibucto, New Brunswick | 1320 | -595 | 0.6 |
| Saint John – St. Stephen, New Brunswick | 1330 | -170 | 0.4 |
| Fredericton – Oromocto, New Brunswick | 1340 | -560 | 0.4 |
| Edmundston – Woodstock, New Brunswick | 1350 | 230 | 0.2 |
| Quebec | 24 | -33,005 | 22.1 |
| Gaspésie – Îles-de-la-Madeleine, Quebec | 2410 | -320 | 0.2 |
| Bas-Saint-Laurent, Quebec | 2415 | -1,095 | 0.5 |
| Capitale-Nationale, Quebec | 2420 | 21,235 | 2.1 |
| Chaudière-Appalaches, Quebec | 2425 | -21,120 | 1.0 |
| Estrie, Quebec | 2430 | -2,585 | 0.8 |
| Centre-du-Québec, Quebec | 2433 | -1,255 | 0.7 |
| Montérégie, Quebec | 2435 | -143,960 | 3.5 |
| Montréal, Quebec | 2440 | 335,080 | 7.4 |
| Laval, Quebec | 2445 | -42,545 | 1.0 |
| Lanaudière, Quebec | 2450 | -78,290 | 0.9 |
| Laurentides, Quebec | 2455 | -66,400 | 1.3 |
| Outaouais, Quebec | 2460 | -31,445 | 0.9 |
| Abitibi-Témiscamingue, Quebec | 2465 | -1,420 | 0.4 |
| Mauricie, Quebec | 2470 | -2,670 | 0.6 |
| Saguenay – Lac-Saint-Jean, Quebec | 2475 | -1,540 | 0.6 |
| Côte-Nord, Quebec | 2480 | 1,380 | 0.2 |
| Nord-du-Québec, Quebec | 2490 | 3,945 | 0.1 |
| Ontario | 35 | 34,725 | 38.8 |
| Ottawa, Ontario | 3510 | 32,055 | 4.1 |
| Kingston – Pembroke, Ontario | 3515 | 675 | 1.2 |
| Muskoka – Kawarthas, Ontario | 3520 | -16,450 | 0.8 |
| Toronto, Ontario | 3530 | 146,315 | 19.3 |
| Kitchener – Waterloo – Barrie, Ontario | 3540 | -53,040 | 3.7 |
| Hamilton – Niagara Peninsula, Ontario | 3550 | -60,580 | 3.6 |
| London, Ontario | 3560 | -6,645 | 1.9 |
| Windsor – Sarnia, Ontario | 3570 | -1,860 | 1.5 |
| Stratford – Bruce Peninsula, Ontario | 3580 | -4,630 | 0.8 |
| Northeast, Ontario | 3590 | -3,085 | 1.3 |
| Northwest, Ontario | 3595 | 1,970 | 0.6 |
| Manitoba | 46 | -1,450 | 3.6 |
| Southeast, Manitoba | 4610 | -11,740 | 0.3 |
| South Central, Manitoba | 4620 | -425 | 0.2 |
| Southwest, Manitoba | 4630 | -390 | 0.3 |
| North Central, Manitoba | 4640 | -1,285 | 0.1 |
| Winnipeg, Manitoba | 4650 | 18,125 | 2.3 |
| Interlake, Manitoba | 4660 | -8,045 | 0.2 |
| Parklands, Manitoba | 4670 | -35 | 0.1 |
| North, Manitoba | 4680 | 2,345 | 0.1 |
| Saskatchewan | 47 | -6,270 | 3.0 |
| Regina – Moose Mountain, Saskatchewan | 4710 | 315 | 1.0 |
| Swift Current – Moose Jaw, Saskatchewan | 4720 | -1,165 | 0.3 |
| Saskatoon – Biggar, Saskatchewan | 4730 | -1,975 | 1.0 |
| Yorkton – Melville, Saskatchewan | 4740 | 440 | 0.2 |
| Prince Albert, Saskatchewan | 4750 | -4,435 | 0.5 |
| Northern, Saskatchewan | 4760 | 550 | 0.1 |
| Alberta | 48 | 6,585 | 12.0 |
| Lethbridge – Medicine Hat, Alberta | 4810 | -1,315 | 0.7 |
| Camrose – Drumheller, Alberta | 4820 | -1,190 | 0.5 |
| Calgary, Alberta | 4830 | -6,275 | 4.6 |
| Banff – Jasper – Rocky Mountain House, Alberta | 4840 | 1,945 | 0.2 |
| Red Deer, Alberta | 4850 | -700 | 0.6 |
| Edmonton, Alberta | 4860 | -4,340 | 4.2 |
| Athabasca – Grande Prairie – Peace River, Alberta | 4870 | -1,355 | 0.7 |
| Wood Buffalo – Cold Lake, Alberta | 4880 | 19,815 | 0.5 |
| British Columbia | 59 | 720 | 14.1 |
| Vancouver Island and Coast, British Columbia | 5910 | -2,495 | 2.2 |
| Lower Mainland – Southwest, British Columbia | 5920 | 2,605 | 9.0 |
| Thompson – Okanagan, British Columbia | 5930 | -3,175 | 1.6 |
| Kootenay, British Columbia | 5940 | 410 | 0.4 |
| Cariboo, British Columbia | 5950 | 620 | 0.5 |
| North Coast, British Columbia | 5960 | 915 | 0.1 |
| Nechako, British Columbia | 5970 | 295 | 0.1 |
| Northeast, British Columbia | 5980 | 1,545 | 0.2 |
| Yukon, Yukon | 6010 | -65 | 0.1 |
| Northwest Territories, Northwest Territories | 6110 | 1,920 | 0.1 |
| Nunavut, Nunavut | 6210 | 7,075 | 0.1 |
|
|||
| Jobs | |
|---|---|
| A) Largest proportions of total jobs (19.3% to 2.0%) | percent |
| Toronto (3530) | 19.3 |
| Lower Mainland – Southwest (5920) | 9.0 |
| Montréal (2440) | 7.4 |
| Calgary (4830) | 4.6 |
| Edmonton (4860) | 4.2 |
| Ottawa (3510) | 4.1 |
| Kitchener – Waterloo – Barrie (3540) | 3.7 |
| Hamilton – Niagara Peninsula (3550) | 3.6 |
| Montérégie (2435) | 3.5 |
| Winnipeg (4650) | 2.3 |
| Vancouver Island and Coast (5910) | 2.2 |
| Capitale-Nationale (2420) | 2.1 |
| B) Largest positive net flows of jobs (net inflows, net recipients of jobs) (335,000 to 10,000) | number |
| Montréal (2440) | 335,000 |
| Toronto (3530) | 146,000 |
| Ottawa (3510) | 32,000 |
| Capitale-Nationale (2420) | 21,000 |
| Wood Buffalo – Cold Lake (4880) | 20,000 |
| Winnipeg (4650) | 18,000 |
| Others with positive net flows | <+10,000 |
| C) Largest negative net flows of jobs (net outflows, net supplier of jobs) (-144,000 to -10,000) | number |
| Montérégie (2435) | -144,000 |
| Lanaudière (2450) | -78,000 |
| Laurentides (2455) | -66,000 |
| Hamilton–Niagara Peninsula (3550) | -61,000 |
| Kitchener–Waterloo–Barrie (3540) | -53,000 |
| Laval (2445) | -43,000 |
| Outaouais (2460) | -31,000 |
| Chaudière-Appalaches (2425) | -21,000 |
| Muskoka Kawarthas (3520) | -16,000 |
| Southeast, Manitoba (4610) | -12,000 |
| Others with negative net flows | >-10,000 |
| Source: Table 36-10-0675-01, February 2023. | |
| Economic regions | Average annual growth | Jobs | ||
|---|---|---|---|---|
| 2010 | 2021 | Difference (rounded) | ||
| percent | number | |||
| A) Job increases | ||||
| A-1) High average growth rates | ||||
| Nord-du-Québec, Quebec (2490) | 6.0 | 11,800 | 22,300 | 11,000 |
| Nunavut (6210) | 3.5 | 14,910 | 21,870 | 7,000 |
| Lower Mainland – Southwest, British Columbia (5920) | 2.0 | 1,380,015 | 1,717,390 | 337,000 |
| Yukon (6010) | 1.9 | 21,510 | 26,520 | 5,000 |
| Southeast, Manitoba (4610) | 1.5 | 44,745 | 52,630 | 8,000 |
| Kootenay, British Columbia (5940) | 1.5 | 68,515 | 80,365 | 12,000 |
| A-2) High positive changes in jobs | ||||
| Toronto, Ontario (3530) | 1.4 | 3,165,635 | 3,675,270 | 510,000 |
| Lower Mainland – Southwest, British Columbia (5920) | 2.0 | 1,380,015 | 1,717,390 | 337,000 |
| Montréal, Quebec (2440) | 1.1 | 1,249,840 | 1,402,855 | 153,000 |
| Edmonton, Alberta (4860) | 1.4 | 687,670 | 802,190 | 115,000 |
| Calgary, Alberta (4830) | 1.1 | 774,870 | 870,485 | 96,000 |
| Kitchener – Waterloo – Barrie, Ontario (3540) | 1.2 | 627,475 | 712,415 | 85,000 |
| Montérégie, Quebec (2435) | 1.1 | 588,690 | 660,420 | 72,000 |
| B) Job decreases | ||||
| B-1) Strong negative average growth rates | ||||
| Côte-Nord, Quebec (2480) | -2.5 | 51,795 | 39,350 | -12,000 |
| Banff – Jasper – Rocky Mountain House, Alberta (4840) | -1.8 | 54,295 | 44,665 | -10,000 |
| South Coast – Burin Peninsula, Newfoundland and Labrador (1020) | -1.7 | 12,495 | 10,325 | -2,000 |
| Yorkton – Melville, Saskatchewan (4740) | -1.6 | 44,490 | 37,400 | -7,000 |
| B-2) Strong negative changes in jobs (other regions) | ||||
| Camrose – Drumheller, Alberta (4820) | -1.3 | 110,435 | 95,235 | -15,000 |
| Northeast, Ontario (3590) | -0.4 | 256,665 | 244,705 | -12,000 |
| Source: Table 36-10-0675-01, February 2023. | ||||
| Economic regions | Switch year | Trend | Net flows of paid workers | ||
|---|---|---|---|---|---|
| 2010 | 2021 | Difference (rounded) | |||
| number | |||||
| A) The main economic regions with a decade tendency toward sending out more jobs | |||||
| A-1) Net flow of jobs: Always (-) | |||||
| Kitchener – Waterloo – Barrie, Ontario (3540) | Note ...: not applicable | Downward | -34,430 | -53,040 | -18,600 |
| Laval, Quebec (2445) | Note ...: not applicable | Downward | -32,050 | -42,545 | -10,500 |
| Laurentides, Quebec (2455) | Note ...: not applicable | Downward | -56,725 | -66,400 | -9,700 |
| Lanaudière, Quebec (2450) | Note ...: not applicable | Downward | -70,520 | -78,290 | -7,800 |
| Hamilton – Niagara Peninsula, Ontario (3550) | Note ...: not applicable | Downward | -54,740 | -60,580 | -5,800 |
| A-2) Net flow of jobs: Changed (+ to -) | |||||
| Calgary, Alberta (4830) | 2015 | Downward | 4,875 | -6,275 | -11,200 |
| Edmonton, Alberta (4860) | 2016 | Downward | 2,445 | -4,340 | -6,800 |
| London, Ontario (3560) | 2012 | Downward | 505 | -6,645 | -7,200 |
| B) The main economic regions with a decade tendency toward sending out fewer jobs | |||||
| Net flow of jobs: Always (-) | |||||
| Outaouais, Quebec (2460) | Note ...: not applicable | Upward | -38,600 | -31,445 | 7,200 |
| Interlake, Manitoba (4660) | Note ...: not applicable | Upward | -13,485 | -8,045 | 5,400 |
| Chaudière-Appalaches, Quebec (2425) | Note ...: not applicable | Upward | -26,000 | -21,120 | 4,900 |
| C) The main economic regions with a decade tendency toward receiving more jobs | |||||
| C-1) Net flow of jobs: Always (+) | |||||
| Toronto, Ontario (3530) | Note ...: not applicable | Upward | 101,625 | 146,315 | 44,700 |
| Montréal, Quebec (2440) | Note ...: not applicable | Upward | 309,325 | 335,080 | 25,800 |
| Nunavut (6210) | Note ...: not applicable | Upward | 2,675 | 7,075 | 4,400 |
| C-2) Net flow of jobs: Changed (- to +) | |||||
| Lower Mainland – Southwest, British Columbia (5920) | 2018 | U shape | -1,225 | 2,605 | 3,800 |
| Banff – Jasper – Rocky Mountain House, Alberta (4840) | 2012 | Upward | -195 | 1,945 | 2,100 |
| D) The main economic regions with a decade tendency toward receiving fewer jobs | |||||
| Net flow of jobs: Always (+) | |||||
| Ottawa, Ontario (3510) | Note ...: not applicable | Downward | 40,135 | 32,055 | -8,100 |
| Winnipeg, Manitoba (4650) | Note ...: not applicable | Downward | 24,890 | 18,125 | -6,800 |
| Capitale-Nationale, Quebec (2420) | Note ...: not applicable | Downward | 26,850 | 21,235 | -5,600 |
|
... not applicable Source: Table 36-10-0675-01, February 2023. |
|||||
| Economic regions | Total jobs | 2019 versus 2020 Job losses |
2021 Jobs recoveredTable 5 Note 1 |
|||
|---|---|---|---|---|---|---|
| 2019 | 2020 | 2021 | ||||
| number | difference (rounded) | percent | percent | |||
| Toronto, Ontario (3530) | 3,742,485 | 3,349,885 | 3,664,105 | -392,600 | -10 | 80 |
| Lower Mainland – Southwest, British Columbia (5920) | 1,730,275 | 1,536,675 | 1,723,165 | -193,600 | -11 | 96 |
| Montréal, Quebec (2440) | 1,417,005 | 1,283,795 | 1,403,785 | -133,200 | -9 | 90 |
| Calgary, Alberta (4830) | 903,750 | 805,640 | 867,240 | -98,100 | -11 | 63 |
| Edmonton, Alberta (4860) | 806,250 | 715,590 | 798,630 | -90,700 | -11 | 92 |
| Hamilton – Niagara Peninsula, Ontario (3550) | 706,810 | 618,795 | 680,450 | -88,000 | -12 | 70 |
| Ottawa, Ontario (3510) | 807,320 | 730,280 | 784,530 | -77,000 | -10 | 70 |
| Kitchener – Waterloo – Barrie, Ontario (3540) | 722,325 | 653,440 | 710,930 | -68,900 | -10 | 83 |
| Montérégie, Quebec (2435) | 668,435 | 605,510 | 657,105 | -62,900 | -9 | 82 |
| Windsor – Sarnia, Ontario (3570) | 309,605 | 251,405 | 299,740 | -58,200 | -19 | 83 |
| Capitale-Nationale, Quebec (2420) | 441,310 | 387,875 | 404,780 | -53,400 | -12 | 32 |
| Vancouver Island and Coast, British Columbia (5910) | 430,235 | 390,630 | 427,335 | -39,600 | -9 | 93 |
| Laurentides, Quebec (2455) | 247,865 | 213,115 | 245,250 | -34,800 | -14 | 92 |
| Winnipeg, Manitoba (4650) | 439,515 | 406,845 | 434,595 | -32,700 | -7 | 85 |
| Kingston – Pembroke, Ontario (3515) | 240,750 | 210,725 | 236,130 | -30,000 | -12 | 85 |
|
||||||
| Economic regions | Total jobs | 2019 versus 2020 Job losses |
2021 Jobs recoveredTable 6 Note 1 |
|||
|---|---|---|---|---|---|---|
| 2019 | 2020 | 2021 | ||||
| number | difference (rounded) | percent | percent | |||
| Northern, Saskatchewan (4760) | 10,230 | 9,570 | 11,050 | -700 | -6 | 224 |
| London, Ontario (3560) | 342,810 | 321,210 | 363,415 | -21,600 | -6 | 195 |
| Northwest Territories, Northwest Territories (6110) | 26,765 | 25,505 | 27,820 | -1,300 | -5 | 184 |
| Moncton – Richibucto, New Brunswick (1320) | 110,065 | 105,700 | 112,630 | -4,400 | -4 | 159 |
| Fredericton – Oromocto, New Brunswick (1340) | 73,245 | 68,915 | 75,225 | -4,300 | -6 | 146 |
| Centre-du-Québec, Quebec (2433) | 125,005 | 116,935 | 128,550 | -8,100 | -6 | 144 |
| Nord-du-Québec, Quebec (2490) | 22,725 | 20,935 | 23,310 | -1,800 | -8 | 133 |
| Campbellton – Miramichi, New Brunswick (1310) | 57,920 | 57,145 | 58,075 | -800 | -1 | 120 |
| Prince Edward Island (1110) | 78,835 | 73,795 | 79,265 | -5,000 | -6 | 109 |
| Southeast, Manitoba (4610) | 52,345 | 48,470 | 52,705 | -3,900 | -7 | 109 |
| Halifax, Nova Scotia (1250) | 252,280 | 237,445 | 253,345 | -14,800 | -6 | 107 |
| Southern, Nova Scotia (1240) | 48,875 | 44,825 | 48,860 | -4,100 | -8 | 100 |
| Laval, Quebec (2445) | 184,385 | 163,225 | 183,740 | -21,200 | -11 | 97 |
| Lower Mainland – Southwest, British Columbia (5920) | 1,730,275 | 1,536,675 | 1,723,165 | -193,600 | -11 | 96 |
| North Shore, Nova Scotia (1220) | 66,925 | 59,970 | 66,490 | -7,000 | -10 | 94 |
| Vancouver Island and Coast, British Columbia (5910) | 430,235 | 390,630 | 427,335 | -39,600 | -9 | 93 |
| Notre Dame – Central Bonavista Bay, Newfoundland and Labrador (1040) | 34,730 | 30,690 | 34,405 | -4,000 | -12 | 92 |
| Laurentides, Quebec (2455) | 247,865 | 213,115 | 245,250 | -34,800 | -14 | 92 |
| North, Manitoba (4860) | 806,250 | 715,590 | 798,630 | -90,700 | -11 | 92 |
| Gaspésie – Îles-de-la-Madeleine, Quebec (2410) | 33,300 | 28,265 | 32,800 | -5,000 | -15 | 90 |
| Montréal, Quebec (2440) | 1,417,005 | 1,283,795 | 1,403,785 | -133,200 | -9 | 90 |
|
||||||
Data table for Chart 1
| Year | Net flows of paid workers jobs | Economic region |
|---|---|---|
| A-1: Kitchener – Waterloo – Barrie, Ontario (3540) | ||
| 2010 | -34,430 | 3540 |
| 2011 | -37,995 | 3540 |
| 2012 | -37,650 | 3540 |
| 2013 | -39,495 | 3540 |
| 2014 | -40,465 | 3540 |
| 2015 | -43,425 | 3540 |
| 2016 | -45,835 | 3540 |
| 2017 | -50,590 | 3540 |
| 2018 | -50,220 | 3540 |
| 2019 | -51,095 | 3540 |
| 2020 | -48,740 | 3540 |
| 2021 | -53,040 | 3540 |
| A-2 : Calgary, Alberta (4830) | ||
| 2010 | 4,875 | 4830 |
| 2011 | 3,860 | 4830 |
| 2012 | 3,625 | 4830 |
| 2013 | 3,375 | 4830 |
| 2014 | 1,925 | 4830 |
| 2015 | -780 | 4830 |
| 2016 | -1,950 | 4830 |
| 2017 | -2,435 | 4830 |
| 2018 | -2,980 | 4830 |
| 2019 | -4,785 | 4830 |
| 2020 | -5,830 | 4830 |
| 2021 | -6,275 | 4830 |
| B: Outaouais, Quebec (2460) | ||
| 2010 | -38,600 | 2460 |
| 2011 | -39,440 | 2460 |
| 2012 | -39,855 | 2460 |
| 2013 | -39,450 | 2460 |
| 2014 | -37,050 | 2460 |
| 2015 | -37,925 | 2460 |
| 2016 | -37,370 | 2460 |
| 2017 | -34,905 | 2460 |
| 2018 | -33,405 | 2460 |
| 2019 | -32,055 | 2460 |
| 2020 | -30,060 | 2460 |
| 2021 | -31,445 | 2460 |
| C-1: Toronto, Ontario (3530) | ||
| 2010 | 101,625 | 3530 |
| 2011 | 109,135 | 3530 |
| 2012 | 108,300 | 3530 |
| 2013 | 105,255 | 3530 |
| 2014 | 111,910 | 3530 |
| 2015 | 118,395 | 3530 |
| 2016 | 124,705 | 3530 |
| 2017 | 139,160 | 3530 |
| 2018 | 142,025 | 3530 |
| 2019 | 144,555 | 3530 |
| 2020 | 135,255 | 3530 |
| 2021 | 146,315 | 3530 |
| C-2: Lower Mainland – Southwest, British Columbia (5920) | ||
| 2010 | -1,225 | 5920 |
| 2011 | -1,785 | 5920 |
| 2012 | -2,875 | 5920 |
| 2013 | -3,460 | 5920 |
| 2014 | -3,865 | 5920 |
| 2015 | -3,540 | 5920 |
| 2016 | -2,685 | 5920 |
| 2017 | -885 | 5920 |
| 2018 | 210 | 5920 |
| 2019 | 1,275 | 5920 |
| 2020 | 2,555 | 5920 |
| 2021 | 2,605 | 5920 |
| D: Ottawa, Ontario (3510) | ||
| 2010 | 40,135 | 3510 |
| 2011 | 41,405 | 3510 |
| 2012 | 41,570 | 3510 |
| 2013 | 41,570 | 3510 |
| 2014 | 38,465 | 3510 |
| 2015 | 38,880 | 3510 |
| 2016 | 38,310 | 3510 |
| 2017 | 35,350 | 3510 |
| 2018 | 33,030 | 3510 |
| 2019 | 31,680 | 3510 |
| 2020 | 29,705 | 3510 |
| 2021 | 32,055 | 3510 |
| Source: Table 36-10-0675-01, February 2023. | ||
Data table for Chart 2
| Economic regions in the Prairies | Total number of jobs, 2019 | Job recovery rate (percent), 2021 | |
|---|---|---|---|
| Southeast, Manitoba | 4610 | 52,345 | 109 |
| South Central, Manitoba | 4620 | 33,585 | 73 |
| Southwest, Manitoba | 4630 | 62,110 | 46 |
| North Central, Manitoba | 4640 | 22,735 | 62 |
| Winnipeg, Manitoba | 4650 | 439,515 | 85 |
| Interlake, Manitoba | 4660 | 38,800 | 58 |
| Parklands, Manitoba | 4670 | 18,035 | 25 |
| North, Manitoba | 4680 | 29,360 | 21 |
| Regina – Moose Mountain, Saskatchewan | 4710 | 191,215 | 59 |
| Swift Current – Moose Jaw, Saskatchewan | 4720 | 54,850 | -41 |
| Saskatoon – Biggar, Saskatchewan | 4730 | 204,210 | 66 |
| Yorkton – Melville, Saskatchewan | 4740 | 42,625 | -10 |
| Prince Albert, Saskatchewan | 4750 | 94,090 | 59 |
| Northern, Saskatchewan | 4760 | 10,230 | 224 |
| Lethbridge – Medicine Hat, Alberta | 4810 | 149,680 | 41 |
| Camrose – Drumheller, Alberta | 4820 | 97,760 | 56 |
| Calgary, Alberta | 4830 | 903,750 | 63 |
| Banff – Jasper – Rocky Mountain House, Alberta | 4840 | 51,735 | 41 |
| Red Deer, Alberta | 4850 | 113,180 | 61 |
| Edmonton, Alberta | 4860 | 806,250 | 92 |
| Athabasca – Grande Prairie – Peace River, Alberta | 4870 | 143,535 | 44 |
| Wood Buffalo – Cold Lake, Alberta | 4880 | 102,775 | 66 |
|
Note: The four regions with job recovery rates above 85% are identified in the Chart. Source: Table 36-10-0675-01, February 2023. |
|||

Data table for Chart 3
| Economic regions in the Atlantic provinces | Job recovery rate (percent), 2021 |
|---|---|
| Avalon Peninsula, Newfoundland and Labrador (1010) | 52 |
| South Coast – Burin Peninsula, Newfoundland and Labrador (1020) | -123 |
| West Coast – Northern Peninsula – Labrador, Newfoundland and Labrador (1030) | 77 |
| Notre Dame – Central Bonavista Bay, Newfoundland and Labrador (1040) | 92 |
| Prince Edward Island (1110) | 109 |
| Cape Breton, Nova Scotia (1210) | 32 |
| North Shore, Nova Scotia (1220) | 94 |
| Annapolis Valley, Nova Scotia (1230) | 60 |
| Southern, Nova Scotia (1240) | 100 |
| Halifax, Nova Scotia (1250) | 107 |
| Campbellton – Miramichi, New Brunswick (1310) | 120 |
| Moncton – Richibucto, New Brunswick (1320) | 159 |
| Saint John – St. Stephen, New Brunswick (1330) | 21 |
| Fredericton – Oromocto, New Brunswick (1340) | 146 |
| Edmundston – Woodstock, New Brunswick (1350) | 32 |
| Source: Table 36-10-0675-01, February 2023. | |

Description for Map 1
This is a map of Canada showing the distribution of total number of jobs among 76 economic regions in Canada in 2021. The inset highlights the economic regions in Southern Ontario and Southern Québec. “ER” followed by a four-digit code below denotes the Economic Region unique identifier.
On the map, darker shades of blue indicate a higher proportion of jobs in an economic region, while lighter shades of blue indicate a lower proportion of jobs in a region. Overall, the proportions are classified by five categories.
Some of the economic regions with high proportions of jobs at national level are considered as employment hubs: ER3530 (Toronto), ER5920 (Lower Mainland – Southwest), ER2440 (Montréal), ER4830 (Calgary) and ER4860 (Edmonton).
Category 1 (darkest blue) represents economic regions where the proportion of total jobs is between 5.1% and 19.3%. The economic regions in this category are ER3530 (Toronto, 19.3%), ER5920(Lower Mainland – Southwest, 9.0%) and ER2440 (Montréal, 7.4%).
Category 2 represents economic regions where the proportion of jobs is between 3.1% and 5.0%. The economic regions in this category are ER4830 (Calgary, 4.6%), ER4860 (Edmonton, 4.2%), ER3510 (Ottawa, 4.1%), ER3540 (Kitchener – Waterloo – Barrie, 3.7%), ER3550 (Hamilton – Niagara Peninsula, 3.6%) and ER2435 (Montérégie, 3.5%).
Category 3 represents economic regions where the proportion of jobs is between 1.1% and 3.0%. Most of the regions in this category are located in Ontario (4 regions), Québec (3 regions) and British Columbia (2 regions).
Category 4 represents economic regions where the proportion of jobs is between 0.5% and 1.0%. Most of the regions in this category are located in Québec (7 regions), Ontario (3 regions) and Alberta (3 regions).
Category 5 (lightest blue) represents economic regions where the proportion of jobs is less than 0.5%. The economic regions in this category are most of the regions in Prairies and the Atlantic provinces, the three territories, and the regions in Northern Québec and Northern British Columbia.
For more detailed information about this map and the economic region codes, please consult Table 1 and its note 1.
Source: Table 36-10-0675-01, February 2023.

Description for Map 2
This is a map of Canada showing the net flows of paid workers jobs by economic region in 2021. The inset highlights the economic regions in Southern Ontario and Southern Québec. For a given economic region, a net flow is positive when the number of jobs provided by other regions is greater than the number of jobs provided to other regions. In the opposite situation, the net flow is negative.
The economic regions in blue are the regions with positive net flows of jobs, those experiencing more workers moving in than moving out (i.e., net inflows of jobs or net recipients of jobs).
The economic regions in red are the regions with negative net flows of jobs, those experiencing more workers moving out than moving in (i.e., net outflows of jobs or net suppliers of jobs).
On the map, darker shades of blue indicate a larger net inflow of jobs into an economic region, while lighter shades of blue indicate a smaller net inflow of jobs. “ER” followed by a four-digit code below denotes the Economic Region unique identifier.
Overall, the flows of jobs are classified by six categories:
Category 1 (darkest blue) represents economic regions with a substantial net flow of jobs between 40,001 and 336,000. This category includes ER2440 (Montréal, +335,000 jobs) and ER3530 (Toronto, +146,000 jobs).
Category 2 represents economic regions with a net flow of jobs between 10,001 and 40,000. Some of the regions in this category are ER3510 (Ottawa, +32,000 jobs), ER2420 (Capitale-Nationale, +21,000), ER4880 (Wood Buffalo–Cold Lake, + 20,000) and ER4650 (Winnipeg, +18,000).
Category 3 (lightest blue) represents economic regions with a net flow of jobs between 1 and 10,000 jobs. This category includes regions in Central and Northern British Columbia, Northwest Territories and Nunavut.
In contrast, darker shades of red indicate a larger negative net flow (net supplier) of jobs to other regions, while lighter shades of red indicate a smaller net outflow (net supplier) of jobs.
Category 4 (lightest red) represents economic regions with a negative net flow of jobs between -9,999 and 0 jobs. Most of regions in Prairies and the Atlantic Provinces are in this category.
Category 5 represents economic regions with a negative net flow of jobs between -69,999 and -10,000. Some of the regions in this category are ER2455 (Laurentides, -66,000 jobs), ER3550 (Hamilton–Niagara Peninsula, -61,000 jobs), ER3540 (Kitchener–Waterloo–Barrie, -53,000 jobs) and ER2445 (Laval, -42,000 jobs).
Category 6 (darkest red) represents economic regions with the strongest negative net flows of jobs between -144,000 and -70,000 jobs. The principal net suppliers of jobs to other regions are ER2435 (Montérégie, -144,000 jobs) and ER2450 (Lanaudière, -78,000 jobs).
For more information about this map and detailed information on the economic region codes, please consult Table 1 and its note 1.
Source: Table 36-10-0675-01, February 2023.
Description for Map 3
This is a map of Canada showing the average annual growth rate of total jobs by economic region for the period 2010 to 2021. The map delineates economic regions with positive average growth rates (regions in blue) from the economic regions with negative average growth rates (regions in red). “ER” followed by a four-digit code below denotes the Economic Region unique identifier.
Overall, the average growth rates of jobs are classified by four categories:
Category 1 (darker blue) represents economic regions with an average growth rate of jobs between 1.51% and 6.0% over the decade. The economic regions in this category are ER2490 (Nord-du-Québec, 6.0%, from about 11,800 jobs in 2010 to 22,300 jobs in 2021), ER6210 (Nunavut, 3.5%, from about 15,000 to 22,000 jobs), ER5920 (Lower Mainland – Southwest, 2.0%, from about 1,380,000 to 1,717,000 jobs) and ER6010 (Yukon, 1.9%, from about 22,000 to 27,000 jobs).
Category 2 (lighter blue) represents economic regions with an average growth rate of jobs between 0.1% and 1.5% over the decade. Economic regions in this category are almost all the regions in British Columbia, Southern regions in Ontario, all Southern and Central regions in Québec and Northwest Territories.
Category 3 (lighter red) represents economic regions with an average growth rate of jobs between -1.49% and 0.0% over the decade. Most of the regions in Prairies and the Atlantic Provinces are in this category.
Category 4 (darker red) represents economic regions with an average growth rate of jobs between -2.5% and -1.5% over the decade. Some of the regions in this category are ER2480 (Côte-Nord, -2.5%, from about 52,000 jobs in 2010 to 39,000 jobs in 2021) and ER4840 (Banff – Jasper – Rocky Mountain House, -1.8%, from about 54,000 to 45,000 jobs).
For more information about this map, please consult Table 3.
For more detailed information on the economic region codes, please consult note 1 in Table 1.
Source: Table 36-10-0675-01, February 2023.

Description for Map 4
This is a map of Canada that distinguishes economic regions that preserved their status from 2010 to 2020 as a solely net recipient of jobs (light blue), as a solely net supplier of jobs (light red), as a changer from a net supplier to a net recipient of jobs (dark blue) or as a changer from a net recipient to a net supplier of jobs (dark brown). “ER” followed by a four-digit code below denotes the Economic Region unique identifier.
There are four categories:
Category 1 (light blue) represents economic regions that were always a net recipient of jobs between 2010 and 2021. Among economic regions in this category are Northern regions in all provinces (except Atlantic provinces), ER3510 (Ottawa), ER3515 (Kingston – Pembroke), ER3530 (Toronto), ER5940 (Kootenay), Northwest Territories and Nunavut.
Category 2 (light brown) represents economic regions that were always a net supplier of jobs between 2010 and 2021. Among economic regions in this category are almost all the regions in the Atlantic Provinces, Sothern regions in Québec and Prairies, Southwest of Ontario, ER5930 (Thompson – Okanagan) and ER5910 (Vancouver Island and Coast)
Category 3 (dark blue) represents economic regions that changed their status from a net supplier to a net recipient of jobs between 2010 and 2021. Economic regions in this category are ER1010 (Avalon Peninsula, changed in 2015), ER1350 (Edmundston – Woodstock, changed in 2021), ER4740 (Yorkton, changed in 2014), ER4840 (Banff – Jasper – Rocky Mountain House, changed in 2012), ER5920 (Lower Mainland – Southwest, changed in 2018) and ER5950 (Cariboo, changed in 2018).
Category 4 (dark brown) represents economic regions that changed their status from a net recipient to a net supplier of jobs between 2010 and 2021. Economic regions in this category are ER1330 (Saint John – St. Stephen, changed in 2012), ER1340 (Fredericton – Oromocto, changed in 2013), ER3560 (London, changed in 2012), ER4620 (South Central, changed in 2017), ER4830 (Calgary, changed in 2015), ER4860 (Edmonton, changed in 2016), ER6010 (Northwest Territories, changed in 2020).
For more information about this map, please consult Table 4.
For more detailed information on the economic region codes, please consult note 1 in Table 1.
Source: Table 36-10-0675-01, February 2023.

Description for Map 5
This is a map of Canada that describes economic regions based on the number of jobs that they lost in the first year of the COVID-19 pandemic in 2020. The numbers were calculated by comparing the number of jobs in 2020 with the number of jobs in 2019. The inset highlights the economic regions in Southern Ontario and Southern Québec.
On the map, darker shades of brown indicate a substantial decline of total jobs in an economic region, while lighter shades of brown indicate a smaller decline of total jobs in an economic region. “ER” followed by a four-digit code below denotes the Economic Region unique identifier.
There are five categories:
Category 1 (darkest brown) represents economic regions that had a substantial change in the number of jobs between -393,000 to -100,000 in 2020. Regions in this category are ER3530 (Toronto, -392,600), ER5920 (Lower Mainland – Southwest, -193,600) and ER2440 (Montréal, -133,200).
Category 2 (red) represents economic regions with a change in the number of jobs between -99,999 and -50,000. Some regions in this category are ER4830 (Calgary, -98,100), ER4860 (Edmonton, -90,700), ER3550 (Hamilton – Niagara Peninsula, -88,000), ER3510 (Ottawa, -77,000) and ER3540 (Kitchener – Waterloo – Barrie, -68,900)
Category 3 represents economic regions with a change in the number of jobs between -49,999 and -25,000. Some of the regions in this category are ER5910 (Vancouver Island and Coast, -39,600), ER2455 (Laurentides, -34,800), ER4650 (Winnipeg, -32,700) and ER3515 (Kingston – Pembroke, -30,000)
Category 4 represents economic regions with a change in the number of jobs between -24,999 and -10,000. Regions in this category are mostly in Alberta, Ontario and Western Québec.
Category 5 (light yellow) represents economic regions with a change in the number of jobs between -9,999 and 0. Regions in this category are located in the Atlantic provinces, Manitoba, Northern British Columbia, Northern Saskatchewan and the three territories.
For more information about this map, please consult Table 5.
For more detailed information on the economic region codes, please consult note 1 in Table 1.
Source: Table 36-10-0675-01, February 2023.
Description for Map 6
This is a map of Canada that shows economic regions based on recovery rates of jobs in 2021 (the second year of the COVID-19 pandemic). A recovery rate less than 100% indicates the portion of the regional job losses (occurring during 2020) that were refilled in 2021. A recovery rate greater than 100% indicates that the number of jobs in 2021 surpassed the level in 2019.
On the map, darker shades of brown indicate a strong recovery rate of total jobs in an economic region in 2021, while lighter shades of brown indicate a smaller recovery rate of total jobs. “ER” followed by a four-digit code below denotes the Economic Region unique identifier.
There are five categories:
Category 1 (darkest brown) represents economic regions with recovery rates above 110.0%. Almost half of the regions in the Atlantic provinces are in this category. Some the regions with the highest recovery rates are ER3560 (London, 195.0%), ER6110 (Northwest Territories, 184.0%), ER1320 (Moncton – Richibucto, 159.0%) and ER1340 (Fredericton – Oromocto, 146.0%).
Category 2 represents economic regions that fully or almost fully recovered, with recovery rates between 90.0% and 110.0%. Some of the regions in this category are ER1110 (Prince Edward Island, 109.0%), ER4610 (Southeast in Manitoba, 109.0%), ER1250 (Halifax, 107.0%), ER5910 (Vancouver Island and Coast, 96.0%), ER4860 (Edmonton, 92.0%) and ER2440 (Montréal, 90.0%).
Category 3 represents economic regions with relatively high recovery rates between 80.0% and 89.0%. Some of the regions in this category are ER3515 (Kingston – Pembroke, 85.0%), ER5950 (Cariboo, 84.0%), ER3540(Kitchener – Waterloo, 83.0%), ER2435 (Montérégie, 82.0%) and ER3530 (Toronto, 80.0%).
Category 4 (lightest brown) represents economic regions with weak recovery rates, less than 80.0%. Regions in this category are almost all the regions located in Prairies and Québec, regions in Northern Ontario and Northern British Colombia.
For more information about this map, please consult Table 6.
For more detailed information on the economic region codes, please consult note 1 in Table 1.
Source: Table 36-10-0675-01, February 2023.

Description for Map 7
This is a map of Canada that classifies economic regions based on average hours worked in 2021. The average hours worked in Canada was 1,685 hours. The average weekly hours worked of 32 hours was used to find out the number of weeks that labour force in a region worked above or below national average hours. “ER” followed by a four-digit code below denotes the Economic Region unique identifier.
There are four categories:
Category 1 (pink) represents economic regions where workforce worked, on average, at least one week less than national average hours. This category includes economic regions in Southern British Columbia and Southern Québec.
Category 2 (blue) represents economic regions where workforce worked, on average, close to national average hours. Among them are Yukon, Northwest Territories, regions in Nova Scotia and Ontario, Northern Quebec and Northern British Columbia.
Category 3 (light green) represents economic regions where workforce worked, on average, one to two weeks more than national average hours. Some of the regions in this category are ER1110 (Prince Edward Island), ER3530 (Toronto), ER4830 (Calgary) and ER4860 (Edmonton).
Category 4 (dark green) represents economic regions where workforce worked, on average, more than two weeks above the national average hours. Economic regions in this category are Nunavut, almost all the regions in Newfoundland and Labrador and Prairies and Northern regions in New Brunswick
For more detailed information on the economic region codes, please consult note 1 in Table 1.
Source: Table 36-10-0675-01, February 2023.
- Date modified: