
Latest Developments in the Canadian Economic Accounts
The 2018 to 2020 Revisions of the Income and Expenditure Accounts
Text begins
Introduction
This article presents revisions to the Gross Domestic Product (GDP) by Income and by Expenditure from the Income and Expenditure Accounts (IEA) for the 2018 to 2020 period. These revisions were reflected in the 2020 Provincial and Territorial Economic Accounts estimates, released on November 9, 2021.
The first and second quarters of 2021 have also been revised. In accordance with standard revision practice, these estimates will continue to be revised in upcoming cycles, and therefore, are excluded from the analysis in this article.
Revision process and phases
GDP estimates by IEA are subject to various types of revisions that take place with each quarterly release depending on the availability of data and the practicality of implementation. The first-quarter release includes revisions to all quarters of the previous year; the second-quarter release revises only the first quarter of the same year; the third-quarter release (the annual revision) includes revisions to all quarters back three years; and the fourth-quarter release includes revisions to all quarters of the same year.
Occasionally, substantial changes that are made to incorporate new concepts or methods (for example, integration of new SNA concepts) result in comprehensive revisions (back to 1961), and can occur with the annual revision. Appendix A illustrates the revision cycle for GDP, including an explanation of the open period and the vintages.
In this release, new benchmark values from the supply-use tables (SUTs) for the 2018 reference year have been incorporated into the GDP by IEA. SUTs integrate data from a wide range of sources into a balanced accounting framework. They represent the most detailed, coherent accounting system for the structure of the Canadian economy and are considered the most accurate benchmarks on which to base estimates.
Revisions for the 2019 and 2020 reference years incorporated up-to-date information from the Annual Survey of Manufacturing and Logging, the Annual Survey of Research and Development in Canadian Industry, the Annual Census of Mines, government public accounts, and administrative data. These revisions also reflect incorporation of T4 data for 2019 and preliminary T4 data for 2020. Appendix B contains the timeline for data source integration into the IEA by major component of income-based GDP and expenditure-based GDP, using 2018Q1 as an example.
Revisions for the 2020 reference year also reflect pandemic-related disruptions. The pandemic meant suspension of several surveys and other data sources in the spring of 2020, with gradual resumption starting in the summer. As a result, some initial estimates contained assumptions about data, and revisions were necessary in subsequent releases.
This article summarizes the combined impact of revisions from all sources on annual and quarterly GDP, on a nominal and a real basis.
Revisions to growth of nominal gross domestic product
| Previously published | Revised nominal GDP | Revision | Previously published average growth in annual GDP | Revised average growth in annual GDP | Mean absolute revision to the growth in annual GDP | |
|---|---|---|---|---|---|---|
| billions of dollars | percentage | percentage points | ||||
| 2018 to 2020 | 2,248.93 | 2,251.24 | 2.31 | 1.07 | 1.10 | 0.03 |
| 2018 | 2,231.17 | 2,235.68 | 4.51 | 4.23 | 4.44 | 0.21 |
| 2019 | 2,310.71 | 2,311.29 | 0.58 | 3.57 | 3.38 | 0.19 |
| 2020 | 2,204.91 | 2,206.76 | 1.85 | -4.58 | -4.52 | 0.06 |
| Source: Statistics Canada, "The 2018 to 2020 revisions of the Income and Expenditure Accounts", Latest Developments in the Canadian Economic Accounts (13-605-X), 2021. | ||||||
With incorporation of new benchmark data from the supply-use tables, the level of nominal GDP was revised up by $4.5 billion in 2018. The nominal GDP growth rate was revised up 0.21 percentage points, largely because of revised business gross fixed capital formation, household spending, and inventories.
In 2019, nominal GDP was revised down by 0.19 percentage points. Upward revisions in business gross fixed capital formation and exports were largely offset by downward revisions in government fixed capital formation and upward revisions in imports.
In 2020, the decline in revised nominal GDP (-4.52%) was slightly less than the previously published decline (-4.58%); nominal GDP was revised up by $1.8 billion. Upward revisions from higher business gross fixed capital formation and exports were partly offset by downward revisions in household spending and government gross fixed capital formation.
The absolute revision to the growth rate—the difference between the revised average growth rate and the previously published average growth rate—was 0.03 percentage points for the 2018-to-2020 period.
| Previously published average growth in quarterly GDP | Revised average growth in quarterly GDP | Mean absolute revision to the growth in quarterly GDP | |
|---|---|---|---|
| percentage | percentage points | ||
| 2018 to 2020 | 0.62 | 0.62 | 0.00 |
| 2018 | 0.57 | 0.62 | 0.05 |
| 2019 | 1.22 | 1.21 | 0.01 |
| 2020 | 0.06 | 0.02 | 0.04 |
| Source: Statistics Canada, "The 2018 to 2020 revisions of the Income and Expenditure Accounts", Latest Developments in the Canadian Economic Accounts (13-605-X), 2021. | |||
On a quarterly basis, the absolute revision to the growth rate was near zero percentage point for the 2018-to-2020 period, as upward revisions in some quarters offset downward revisions in other quarters. These revisions are consistent with historical averages. Throughout the period, the quarterly trend remained similar to the trend based on previously published estimates.
Revisions to growth of real gross domestic product
| Previously published average growth in annual real GDP | Revised average growth in annual real GDP | Mean absolute revision to the growth in annual real GDP | |
|---|---|---|---|
| percentage | percentage points | ||
| 2018 to 2020 | -0.34 | -0.19 | 0.15 |
| 2018 | 2.43 | 2.78 | 0.35 |
| 2019 | 1.86 | 1.88 | 0.02 |
| 2020 | -5.31 | -5.23 | 0.08 |
| Source: Statistics Canada, "The 2018 to 2020 revisions of the Income and Expenditure Accounts", Latest Developments in the Canadian Economic Accounts (13-605-X), 2021. | |||
The mean absolute percentage-point revision to the annual average growth rate of real GDP for the 2018-to-2020 period was 0.15. The revision was lowest in 2019 (+0.02 percentage points) and highest in 2018 (+0.35 percentage points). The growth rate was revised up (+0.08 percentage points) in 2020.

Data table for Chart 1
| Previous estimate | Revised estimate | |
|---|---|---|
| percent change, chained (2012) dollars | ||
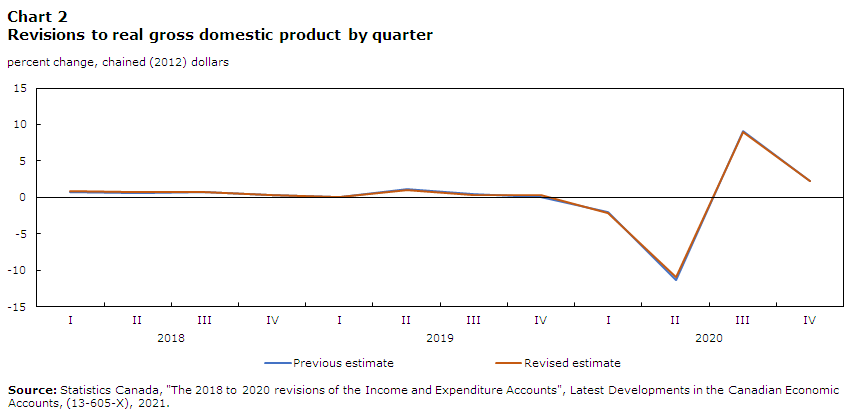
| 2018 | 2.4 | 2.8 |
| 2019 | 1.9 | 1.9 |
| 2020 | -5.3 | -5.2 |
| Source: Statistics Canada, "The 2018 to 2020 revisions of the Income and Expenditure Accounts"Latest Developments in the Canadian Economic Accounts, (13-605-X), 2021. | ||
Based on chained dollars, the growth rate of real GDP was revised up 0.40 percentage points in 2018; unchanged in 2019 and up by 0.10 percentage point in 2020.
| Previously published average growth in quarterly real GDP | Revised average growth in quarterly real GDP | Mean absolute revision to the growth in quarterly real GDP | |
|---|---|---|---|
| percentage | percentage points | ||
| 2018 to 2020 | 0.17 | 0.20 | 0.03 |
| 2018 | 0.57 | 0.68 | 0.11 |
| 2019 | 0.43 | 0.43 | 0.00 |
| 2020 | -0.50 | -0.51 | 0.01 |
| Source: Statistics Canada, "The 2018 to 2020 revisions of the Income and Expenditure Accounts", Latest Developments in the Canadian Economic Accounts (13-605-X), 2021. | |||
The mean absolute percentage-point revision to the annual average growth rate of quarterly real GDP for the 2018-to-2020 period was 0.03. The largest revision was in 2018 (+0.11 percentage points) and the smallest in 2019 (+0.00 percentage point). The growth rate was revised down (-0.01 percentage point) in 2020. The extent of these revisions was minimal and well within historical limits, ranging from -0.33 to 0.43 percentage points over the last decade.
Data table for Chart 2
| Previous estimate | Revised estimate | |
|---|---|---|
| percent change, chained (2012) dollars | ||
| 2018 | ||
| I | 0.7 | 0.9 |
| II | 0.6 | 0.8 |
| III | 0.7 | 0.7 |
| IV | 0.3 | 0.3 |
| 2019 | ||
| I | 0.1 | 0.1 |
| II | 1.1 | 1.0 |
| III | 0.5 | 0.3 |
| IV | 0.1 | 0.3 |
| 2020 | ||
| I | -2.0 | -2.2 |
| II | -11.3 | -11.0 |
| III | 9.1 | 9.0 |
| IV | 2.2 | 2.2 |
| Source: Statistics Canada, "The 2018 to 2020 revisions of the Income and Expenditure Accounts", Latest Developments in the Canadian Economic Accounts, (13-605-X), 2021. | ||
Based on chained dollars, the movement of real GDP between 2018 and 2020 was very similar to the previously published estimates. In 2018, real GDP was revised up in the first (+0.02 percentage points) and second quarters (+0.02 percentage points) and remained unchanged in the next two quarters.
In 2019, real GDP growth rates underwent slight revisions: no revision in the first quarter and a minor (-0.1 percentage points) in the second quarter, down 0.2 percentage points in the third quarter and up 0.2 percentage points in the fourth quarter. In 2020, the real GDP growth rate was revised down (-0.2 percentage points) in the first quarter, followed by an upward revision of 0.3 percentage points in the second and a downward revision (-0.1 percentage point) in the third quarter. The growth rate was unchanged in the fourth quarter. At this point in the revision cycle for 2020, revisions are within range of the historical average.
Appendix A
GDP revision cycle
Description for Image 1
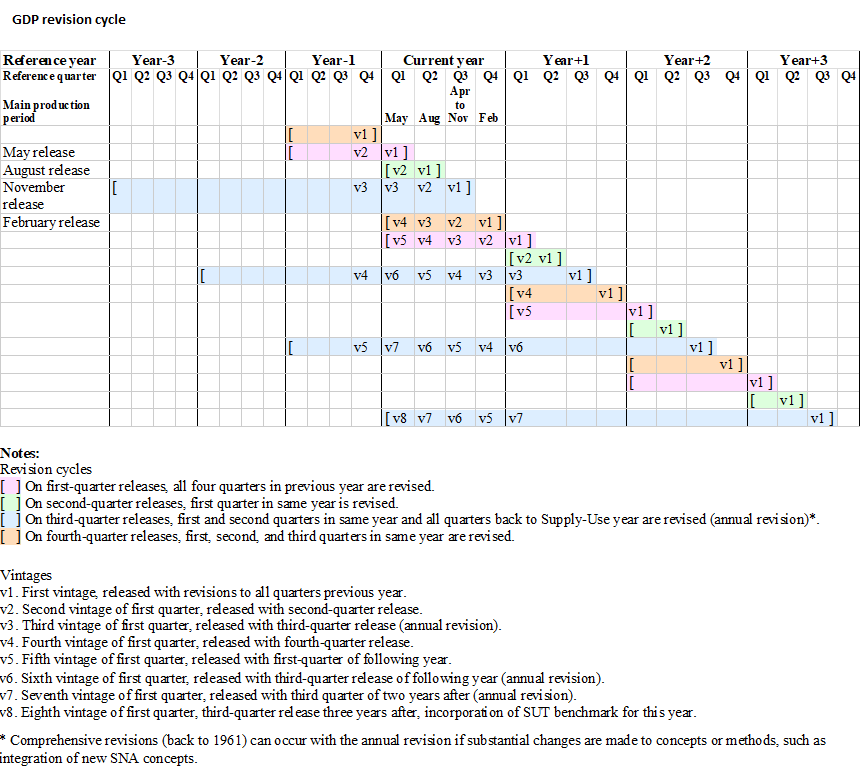
GDP revision cycle
The GDP revisions cycle is a set cycle year-to-year. Revisions occur to previously released quarters based on the reference period open with each release. For the first quarter of GDP by income and by expenditure, the release includes revisions to all quarters of the previous year; a second quarter release includes revisions to only the first quarter of the same year; a third quarter release is the annual revision and includes revisions to all quarters back three years (due to incorporation of the Supply-Use Table (SUT) for three years prior); and a fourth quarter release includes revisions to all quarters of the same year.
Comprehensive revisions (quarterly, back to 1961) can occur with the annual revision when there are significant changes to concepts or methods, such as integration of new System of National Accounts concepts.
The table illustrates the main production period for each quarter, the corresponding reference quarter/year and the release date. Using the first quarter of a year as an example: the first vintage of those estimates is released in May of the same reference year with revisions to all quarters previous year. The second vintage of the first quarter is released in August with the second quarter release. The third vintage of the first quarter is released with the third quarter release (annual revision) in November. The fourth vintage of the first quarter is released in February of the following year with the fourth quarter release. The fifth vintage of the first quarter is released in May with the first quarter of the following year. The sixth vintage of the first quarter is released with the third quarter release of the following year (annual revision) in November. The seventh vintage of the first quarter is released with the third quarter of two years after (annual revision) in November. The eighth vintage of the first quarter and the last revision vintage (excluding comprehensive revisions) is released in November with the third quarter release three years after, and reflects the incorporation of the SUT benchmark for that year.
Appendix B
Revisions due to different vintages of source data
| Initial quarterly estimate | First annual revision | Second annual revision | Third annual revision | Fourth annual revision | |
|---|---|---|---|---|---|
| Release | 2018q1 (May 2018) | 2018q3 (November 2018) | 2019q3 (November 2019) | 2020q3 (November 2020) | 2021q3 (November 2021) |
| General notes | Incorporation of monthly surveys | Revisions to monthly surveys | - | Incorporation of annual surveys | Incorporation of Supply-use table |
| Compensation of employees | Survey of Employment, Payroll and Hours (SEPH), Labour Force Survey (LFS), Employment and Social Development Canada data | - | T4 preliminary (RY2018) for provincial/territorial (PT) aggregates | T4 final (RY2018) by PT and by industry | SUT industry refinements (RY2018) |
| Gross operating surplus | Quarterly Survey of Financial Statements (QSFS), Regulatory data (for banks); GFS for Government Business Enterprises | - | Third party data | Annual Financial and Taxation Statistics | SUT benchmark |
| Gross mixed income: | SEPH, LFS, Monthly Retail Trade Survey, Monthly Survey of Manufacturing, gross output by industry | - | Tax data (T1 and T5013) | Tax data updates | SUT benchmark |
| Rent portion | Consumer Price Index, Stock in units | - | - | - | - |
| Farm portion | Farm cash receipts | Crop data | - | - | SUT benchmark |
| Taxes less subsidiesTable A1 GDP by income components, example reference period 2018q1 Note 1 |
Government Finance Statistics (GFS): preliminary/modelled | Updated GFS: late filers, Public Accounts (PA) | Revised GFS: late PA, local government first estimate | Revised GFS: local government updates | SUT benchmark |
|
|||||
| Initial quarterly estimate | First annual revision | Second annual revision | Third annual revision | Fourth annual revision | |
|---|---|---|---|---|---|
| Release | 2018q1 (May 2018) | 2018q3 (November 2018) | 2019q3 (November 2019) | 2020q3 (November 2020) | 2021q3 (November 2021) |
| General notes | Incorporation of monthly surveys | Revisions to monthly surveys | - | Incorporation of annual surveys | Incorporation of Supply-use table |
| Household Final consumption expenditure: | |||||
| Goods | Monthly retail trade (MRTS), New motor vehicle survey, trade in goods, vehicle registrations | Retail commodity survey | - | Survey of Household Spending (SHS)Table A2 GDP by expenditure components, example reference period 2018q1 Note 1 |
SUT benchmark by product |
| Services | GST remittances, trade in services, Canadian Radio-television and Telecommunications Commission, monthly GDP by industry | - | - | SHS; Food services & drinking places; accommodation services | SUT benchmark by product |
| Government Final Consumption | Government Finance Statistics (GFS): preliminary/modelled | Updated GFS: late filers, Public Accounts (PA) | Revised GFS: late PA, local government first estimate | Revised GFS: local government updates | SUT benchmark |
| NPISH Final Consumption | Forecast | - | - | Tax data (T3010 and Non-Profit Organizations) | - |
| Business Capital Investment: | |||||
| Residential: new, renovations, ownership transfer costs | Labour estimates, Investment in Building Construction (IBC), CMHC, Wholesale/retail sales, Survey of Building Permits, Canadian Real Estate Association (CREA) | - | - | SHSTable A2 GDP by expenditure components, example reference period 2018q1 Note 2, Real Estate Agents and Brokers survey |
- |
| Non-residential buildings | IBC, CREA | Annual Capital and Repair Expenditures (CAPEX) intentions | CAPEX preliminary | CAPEX actual | SUT benchmark by asset |
| Non-residential engineering | Quarterly Oil and Gas CAPEX, labour indicators, drilling and rigging activities, financial reports | ||||
| Machinery and equipment | Imports, inventories, Monthly Survey of Manufacturing (MSM) | ||||
| Intellectual Property Products | Labour estimates, Research and development intentions, imports, drilling and rigging activities | - | Gross Domestic Expenditures on Research and Development | Research and Development in Canadian Industry | |
| Government capital investment | Similar to business for first vintage, by asset | CAPEX intentions: provincial government | CAPEX preliminary: provincial government; GFS: federal | CAPEX actual: provincial; GFS local government; Provincial housing corporations | |
| Change in inventories: | |||||
| Non-farm | MSM, MRTS, Monthly Wholesale Trade, energy surveys, QSFS | - | - | Annual Survey of Manufacturing and Logging, Annual Wholesale Trade Survey, Annual Census of Mines, Annual Retail Trade Survey | SUT benchmark |
| Farm | Farm cash receipts | Crop data | - | - | SUT benchmark |
| International trade: | |||||
| Goods | Canadian International Merchandise Trade, Canadian Energy Regulator | - | - | - | SUT benchmark |
| Services | Preliminary Balance of Payments (BOP) surveys | BOP commercial services surveys | Tourism/education surveys | - | |
|
|||||
- Date modified: