
Latest Developments in the Canadian Economic Accounts
Employment at multinational enterprises in Canada

Archived Content
Information identified as archived is provided for reference, research or recordkeeping purposes. It is not subject to the Government of Canada Web Standards and has not been altered or updated since it was archived. Please "contact us" to request a format other than those available.
Introduction
Multinational enterprises (MNEs) are corporations with majority-owned operations in more than one country. In Canada, foreign MNEs (enterprises operating in Canada that are controlled by a foreign parent) and Canadian MNEs (Canadian-controlled enterprises with a foreign affiliate) together comprise around one percent of all corporate enterprises. Despite their relatively small number, MNEs play an important role in the Canadian economy as sources of jobs, capital and new technologies.
Statistics on activities of MNEs complement the already existing statistics on Foreign Direct Investment (FDI) by providing additional insights on the impact of such investment in domestic and foreign economies by identifying and analyzing the characteristics, activity, financial position and performance of MNEs. This year, Statistics Canada is publishing a comprehensive, provincial-level dataset on the domestic activities of Canadian MNEs in addition to those of foreign MNEs. Along with the Activities of Canadian Multinational Enterprises Abroad, Statistics Canada now has full coverage of MNE activities.Note 1
At the national level, the domestic activities of MNEs covered include financial position and performance, research and development activity, various trading activities, as well as employment and gross domestic product (also referred to as value added). At the provincial level, the domestic activities of MNEs measured are employment, gross domestic product and the imports and exports of goods.
This study focuses specifically on the employment characteristics in Canada, by province and industry, of foreign MNEs, Canadian MNEs and non-MNE corporations.
Identifying multinational enterprises in Canada
Foreign MNEs
Foreign MNEs are corporations operating in Canada that are controlled by a foreign parent. They are identified based on a majority ownership concept under the FDI framework. The ownership of more than 50% of voting shares is used to identify foreign MNEs. While the FDI concept of influence also includes ownership of 10% to 50% of the voting shares, this segment is excluded from the statistics on MNEs.
Canadian MNEs
In 2019, Statistics Canada expanded its coverage of Inward Foreign Affiliates Statistics by developing data on the domestic activities of Canadian MNEs. This expansion allows for analysis of the activities of all MNEs in Canada.
Like foreign MNEs, Canadian MNEs are identified using a majority ownership concept. Canadian MNEs are defined as enterprises based in Canada that own more than 50% of the voting shares of an enterprise abroad.
Non-MNEs
MNEs cannot be analyzed in isolation. Their activities should be compared with those of non-MNEs, which are Canadian-owned organizations without a controlling interest abroad.
Non-MNEs in Canada are separated into two groups: corporations and non-corporate organizations. This serves to nuance the analyses of MNEs, which reside entirely in the corporate sector and are best compared with other corporations only.
Together, Canadian MNEs, foreign MNEs and all other domestic corporations make up the Canadian corporate sector as defined in this study. The corporate sector and the residual non-corporate sector jointly comprise the total Canadian economy.
As an exercise undertaken for this program, the distribution of firms into corporate and non-corporate sectors is made using variables on the Statistics Canada Business Register that correspond to the Canadian Classification of Institutional Units and Sectors 2012.Note 2 Table 1 presents the total economy by institutional and economic sector:
| Institutional sector | Economic sector |
|---|---|
| Non-financial and financial corporationsTable 1 Note 1 | Corporate |
| General government | Non-corporate |
| Households | Non-corporate |
| Non-profit institutions serving households | Non-corporate |
|
|
This paper concerns employment within the corporate sector only, unless otherwise mentioned. All figures are for 2017, the most recent available year. Jobs totals by sector and by province are estimated at the establishment statistical unit, the level at which accounting data required to measure production are available (principal inputs, revenues, salaries and wages).
Summary of results
Multinationals employ one in three Canadian corporate sector workers
In 2017, MNEs employed 4.36 million Canadians. This was one-third (34.5%) of Canada’s 12.6 million corporate sector workforce and was split between foreign MNEs (18.2%) and Canadian MNEs (16.3%). Within the full economy, MNEs employed 23.2% of Canadian workers, where foreign MNEs accounted for 12.2% and Canadian MNEs for 11.0%.
The Organisation for Economic Co-operation and Development (OECD) notes that, unlike in Canada, domestically-owned MNEs often account for a larger part of economic activity than foreign MNEs.Note 3 The OECD estimates that in 2014, using the OECD analytical Activities of Multinational Enterprises database, MNEs on average employed 23% of workers in the total economy, with domestic MNEs at 16% and foreign MNEs at 7%.
By province, Ontario had the largest share of its corporate workforce employed by an MNE at 39.6%, with Alberta the second highest (36.2%) and Prince Edward Island the lowest (20.3%).
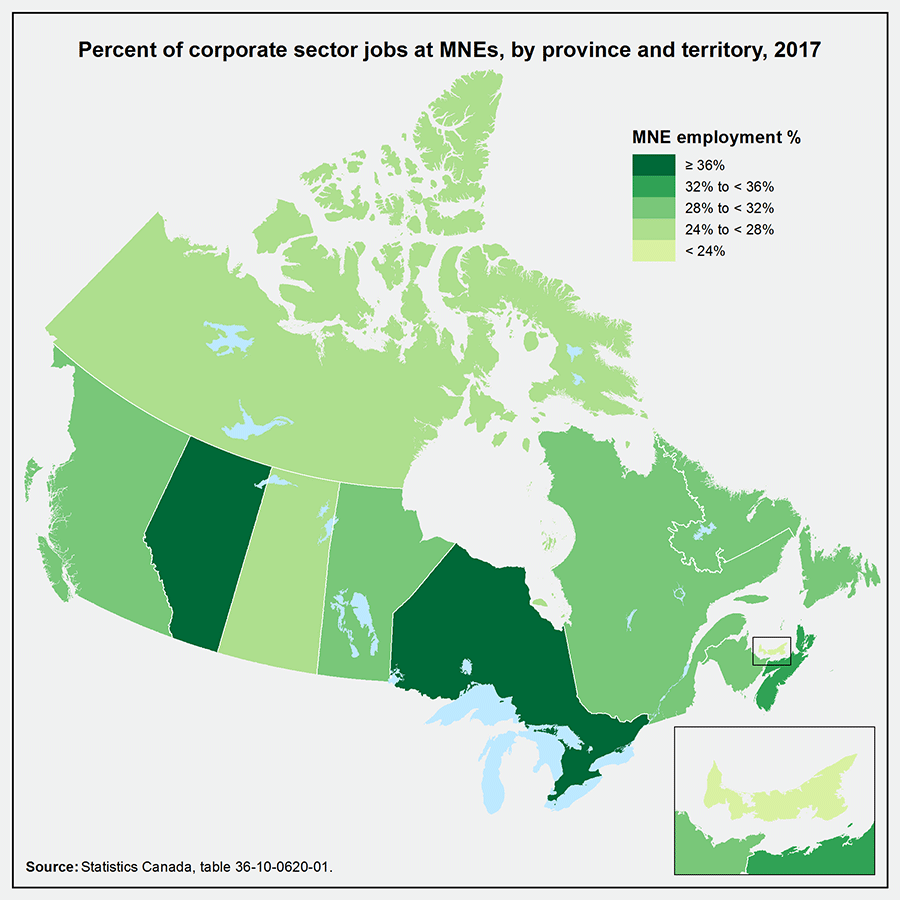
Map 1 Description
The title of the map is “Percent of corporate sector jobs at MNEs, by province and territory, 2017.” MNE stands for multinational enterprise.
The map is of Canada with provincial boundaries drawn. The Territories are treated as one unit. There is an inset for Prince Edward Island in the bottom right.
The map’s legend is “MNE employment %,” which indicates the share of each province’s corporate sector workforce that is employed at a multinational enterprise in 2017. On this map, darker shades of green indicate a higher share of jobs at multinational enterprises, while lighter shades of green indicate a lower share.
Category 1 (darkest green) represents provinces where the share of corporate sector employment at multinational enterprises is greater than or equal to 36%. There are two provinces in this category: Ontario and Alberta.
Category 2 represents provinces where the share is between 32% and 36%. Nova Scotia is the only province in this category.
Category 3 represents provinces where the share of corporate sector employment at multinational enterprises is between 28% and 32%. New Brunswick, Manitoba, British Columbia, Quebec and Newfoundland and Labrador are in this category.
Category 4 represents provinces where the share is between 24% and 28%. Saskatchewan and the Territories are in this category.
Category 5 (lightest green) represents provinces where the share of corporate sector employment at multinational enterprises is less than 24%. Prince Edward Island is the only province in this category.
Source: Statistics Canada, table 36-10-0620-01.
| Provinces and territories | percent |
|---|---|
| Newfoundland and Labrador | 28.7 |
| Prince Edward Island | 20.3 |
| Nova Scotia | 33.6 |
| New Brunswick | 31.9 |
| Quebec | 29.5 |
| Ontario | 39.6 |
| Manitoba | 31.4 |
| Saskatchewan | 26.9 |
| Alberta | 36.2 |
| British Columbia | 30.0 |
| Territories | 26.7 |
Canadian and foreign MNEs have different provincial employment patterns
Canadian MNEs were responsible for similar shares of employment across most provinces. Canadian MNEs employed between 13.9% and 18.8% of the corporate workforce in each province except Prince Edward Island (10.6%).
On the other hand, employment by foreign MNEs was clustered in several provinces, notably Ontario. Nearly one in four (23.2%) workers in Ontario were employed by a foreign MNE. It was the only province whose share of jobs at foreign MNEs was above the national average (18.2%). Alberta was the second highest at 17.5%, while Prince Edward Island was the lowest at 9.7%.

Map 2 Description
The title of the map is “Percent of corporate sector job at foreign MNEs, by province and territory, 2017.” MNE stands for multinational enterprise.
The map is of Canada with provincial boundaries drawn. The Territories are treated as one unit. There is an inset for Prince Edward Island in the bottom right.
The map’s legend is “Foreign MNE employment %,” which indicates the share of each province’s corporate sector workforce that is employed at a foreign multinational enterprise in 2017. On this map, darker shades of green indicate a higher share of jobs at foreign multinational enterprises, while lighter shades of green indicate a lower share.
Category 1 (darkest green) represents provinces where the share of corporate sector employment at foreign multinational enterprises is greater than or equal to 18%. Ontario is the only province in this category.
Category 2 represents provinces where the share is between 16% and 18%. Alberta is the only province in this category.
Category 3 represents provinces where the share of corporate sector employment at foreign multinational enterprises is between 14% and 16%. Nova Scotia, British Columbia, Newfoundland and Labrador, Manitoba and Quebec are in this category.
Category 4 represents provinces where the share is between 12% and 14%. New Brunswick is the only province in this category.
Category 5 (lightest green) represents provinces where the share of corporate sector employment at foreign multinational enterprises is less than 12%. Saskatchewan, the Territories and Prince Edward Island are in this category.
Source: Statistics Canada, table 36-10-0620-01.
| Provinces and territories | percent |
|---|---|
| Newfoundland and Labrador | 14.8 |
| Prince Edward Island | 9.7 |
| Nova Scotia | 15.5 |
| New Brunswick | 13.9 |
| Quebec | 14.0 |
| Ontario | 23.2 |
| Manitoba | 14.6 |
| Saskatchewan | 11.4 |
| Alberta | 17.5 |
| British Columbia | 15.1 |
| Territories | 11.3 |
More manufacturing jobs at foreign MNEs than at Canadian MNEs
In 2017, MNEs employed similar shares of the corporate sector workforce of both goods- (35.6%) and services-producing (34.2%) industries.Note 4
Around one in five (20.1%) jobs in Canada’s goods-producing industries were at foreign MNEs, while 15.5% were at Canadian MNEs.
Foreign MNEs accounted for almost one-third (32.2%) of manufacturing jobs in Canada, compared with one-fifth (19.2%) for Canadian MNEs. In Ontario alone, two-fifths (39.8%) of manufacturing jobs were at foreign-owned firms. The manufacturing sector is the highest recipient of foreign direct investment in Canada. This sector accounted for more than one-fifth ($185 billion) of the total stock of inward direct investment in 2017, a share that has been generally declining in recent years.
The other goods-producing sector with significant foreign presence was mining, quarrying and oil and gas extraction, in which employment was split between foreign MNEs (31.7%), Canadian MNEs (37.1%) and non-MNEs (31.1%).
Utilities was the only goods-producing sector with a low foreign MNE presence (4.2%) but a high Canadian MNE employment share at 44.3%. By nature, there are relatively few firms in the utilities sector, some of which are government business enterprises.

Data table for Chart 1
| Canadian multinational enterprises | Foreign multinational enterprises | Non-multinational enterprises | |
|---|---|---|---|
| number of jobs | |||
| Agriculture, forestry, fishing and hunting | 7,351 | 7,042 | 186,179 |
| Construction | 86,596 | 94,140 | 1,106,341 |
| Manufacturing | 297,851 | 498,905 | 753,144 |
| Mining, quarrying, and oil and gas extraction | 83,426 | 71,254 | 69,885 |
| Utilities | 45,065 | 4,314 | 52,440 |
| Source: Statistics Canada, table 36-10-0620-01. | |||
Canadian MNEs employ half of workers in the finance and insurance sector
Similar to goods-producing industries, a slightly greater share of people in services-producing industries worked for foreign MNEs (17.5%) than for Canadian MNEs (16.6%).
Canadian MNEs were focused in certain services-producing industries. Finance and insurance was the sector with the highest Canadian MNE employment at 455,000 people. They also employed a majority of Canadians in the information and cultural industries sector (55.3%). Both sectors have or have had restrictions on foreign ownership in Canada.
In contrast, there were no sectors in which foreign MNEs employed a majority of people—their largest share was in wholesale trade, where 32.6% of workers were employed by a foreign MNE.

Data table for Chart 2
| Canadian multinational enterprises | Foreign multinational enterprises | Non-multinational enterprises | |
|---|---|---|---|
| number of jobs | |||
| Finance and insurance | 454,574 | 99,180 | 306,353 |
| Information and cultural industries | 174,027 | 48,204 | 92,481 |
| Professional, scientific and technical services | 119,552 | 199,447 | 589,656 |
| Retail trade | 279,827 | 448,913 | 1,212,403 |
| Transportation and warehousing | 210,484 | 113,446 | 412,877 |
| Wholesale trade | 92,294 | 258,850 | 443,468 |
|
Note: Excludes real estate and rental and leasing; management of companies and enterprises; administrative and support, waste management and remediation services; educational services; health and social assistance; arts, entertainment and recreation; accommodation and food services; other services; and public administration. Source: Statistics Canada, table 36-10-0620-01. |
|||
Foreign MNEs active in producing and selling goods
Foreign firms were relatively focused on producing goods (manufacturing) and selling goods (wholesale trade and retail trade). These sectors comprised half (52.5%) of all foreign firms’ jobs in Canada, compared with one-third (32.5%) of all Canadian MNEs’ jobs.
With respect to foreign firms, this pattern is similar in the United States. The Bureau of Economic Analysis reported that in 2017, manufacturing, wholesale trade and retail trade made up 54.2% of employment at foreign firms operating in the United States.Note 5 However, unlike in Canada, these three sectors comprised a similar percent (53.1%) of all jobs at American MNEs in the United States.Note 6
MNEs employ five times more people per establishment than non-MNEs
It is expected that MNEs have more employees per establishment than non-MNEs because their larger size is generally associated with operations in multiple countries.
In 2017, an MNE employed five times as many people (14.3) per establishment as a non-MNE (2.7), while the average Canadian MNE employed slightly more people per establishment than did a foreign MNE.
| Non-multinational enterprises | All multinational enterprises | Foreign multinational enterprises | Canadian multinational enterprises | |
|---|---|---|---|---|
| Total | 2.7 | 14.3 | 13.8 | 14.6 |
| Goods-producing industries | 3.0 | 40.0 | 37.9 | 43.2 |
| Services-producing industries | 2.5 | 12.8 | 12.2 | 13.4 |
Source: Statistics Canada, custom tabulation. |
||||
Majority of foreign MNE employment in Canada at U.S.-owned firms, especially in western Canada
Of the 2.30 million jobs at foreign firms, 1.47 million of them were at U.S.-owned firms. The second-largest foreign source of employment was the United Kingdom, whose firms employed 145,000 people, followed by France with 108,000 workers.
In goods-producing industries, U.S. enterprises employed half (51.6%) of workers at foreign enterprises. The next highest country was France at 6.0%.
In the services-producing industries, enterprises from the United States employed over two-thirds (69.7%) of workers at foreign enterprises, with the United Kingdom second at 7.3%.
Ontario and all provinces west of it (except for the Territories) had an above average share (>63.8%) of their foreign firms’ jobs at U.S. businesses. Each province east of Ontario was below average.
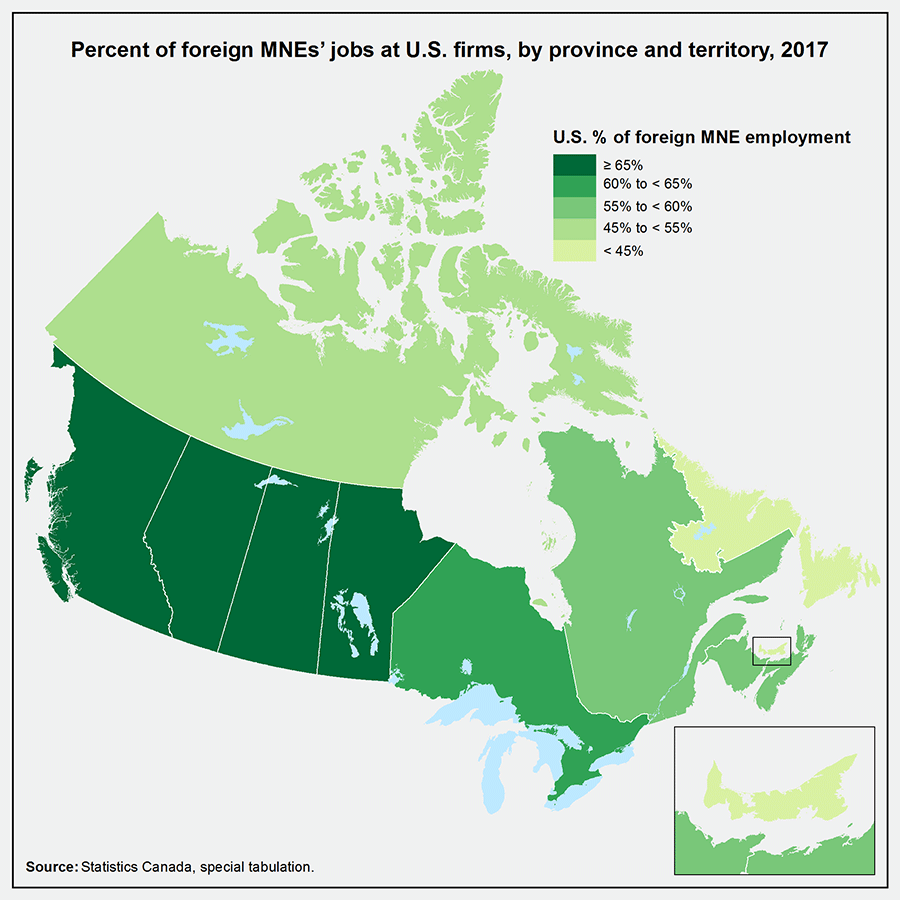
Map 3 Description
The title of the map is “Percent of foreign MNEs’ jobs at U.S. firms, by province and territory, 2017.” MNE stands for multinational enterprise.
The map is of Canada with provincial boundaries drawn. The Territories are treated as one unit. There is an inset for Prince Edward Island in the bottom right.
The map’s legend is “U.S. % of foreign MNE employment,” which indicates, within each province, the number of jobs at U.S. owned firms as a share of the number of jobs at foreign owned multinational enterprises. On this map, darker shades of green indicate that, within the province, American owned firms make up a larger share of the total number of jobs at foreign owned multinational enterprises, while lighter shades of green indicate a lower share.
Category 1 (darkest green) represents provinces where the U.S. share of employment at foreign multinational enterprises is greater than or equal to 65%. Manitoba, Saskatchewan, Alberta and British Columbia are in this category.
Category 2 represents provinces where the share is between 60% and 65%. Ontario is the only province in this category.
Category 3 represents provinces where the U.S. share of employment at foreign multinational enterprises is between 55% and 60%. New Brunswick, Nova Scotia and Quebec are in this category.
Category 4 represents provinces where the share is between 45% and 55%. The Territories are the only region in this category.
Category 5 (lightest green) represents provinces where the U.S. share of employment at foreign multinational enterprises is less than 45%. Newfoundland and Labrador and Prince Edward Island are in this category.
Source: Statistics Canada, special tabulation.
| Provinces and territories | percent |
|---|---|
| Newfoundland and Labrador | 42.9 |
| Prince Edward Island | 38.8 |
| Nova Scotia | 59.7 |
| New Brunswick | 59.9 |
| Quebec | 55.7 |
| Ontario | 64.1 |
| Manitoba | 75.2 |
| Saskatchewan | 70.6 |
| Alberta | 69.3 |
| British Columbia | 68.6 |
| Territories | 52.3 |
Conclusion
This study demonstrates the importance of MNEs in Canada’s corporate sector and how employment characteristics in the country differ between foreign and Canadian MNEs, by province and industry.
In 2017, MNEs employed one-third of Canada’s corporate workers in both goods- and services-producing industries. Foreign MNEs employed slightly more people than Canadian MNEs, but each employed around one-sixth of Canadian workers.
Foreign MNEs were concentrated in goods-producing industries as well as in wholesale and retail trade, while Canadian MNEs had a large absolute and relative presence in certain services-producing industries such as finance and insurance or information and cultural industries. MNEs employed by far more people per establishment than non-MNEs. In turn, Canadian MNEs were slightly larger, per firm, than foreign MNEs.
| Canadian multinational enterprises | Foreign multinational enterprises | All multinational enterprises | Non-multinational enterprises | Corporate sector | Canadian multinational enterprises | Foreign multinational enterprises | All multinational enterprises | Non-multinational enterprises | |
|---|---|---|---|---|---|---|---|---|---|
| number of jobs | percent | ||||||||
| All sectors | 2,059,621 | 2,299,751 | 4,359,371 | 8,265,624 | 12,624,996 | 16.3 | 18.2 | 34.5 | 65.5 |
| Agriculture, forestry, fishing and hunting | 7,351 | 7,042 | 14,393 | 186,179 | 200,572 | 3.7 | 3.5 | 7.2 | 92.8 |
| Mining, quarrying, and oil and gas extraction | 83,426 | 71,254 | 154,680 | 69,885 | 224,565 | 37.1 | 31.7 | 68.9 | 31.1 |
| Utilities | 45,065 | 4,314 | 49,379 | 52,440 | 101,818 | 44.3 | 4.2 | 48.5 | 51.5 |
| Construction | 86,596 | 94,140 | 180,736 | 1,106,341 | 1,287,077 | 6.7 | 7.3 | 14.0 | 86.0 |
| Manufacturing | 297,851 | 498,905 | 796,756 | 753,144 | 1,549,900 | 19.2 | 32.2 | 51.4 | 48.6 |
| Wholesale trade | 92,294 | 258,850 | 351,144 | 443,468 | 794,612 | 11.6 | 32.6 | 44.2 | 55.8 |
| Retail trade | 279,827 | 448,913 | 728,740 | 1,212,403 | 1,941,143 | 14.4 | 23.1 | 37.5 | 62.5 |
| Transportation and warehousing | 210,484 | 113,446 | 323,930 | 412,877 | 736,807 | 28.6 | 15.4 | 44.0 | 56.0 |
| Information and cultural industries | 174,027 | 48,204 | 222,232 | 92,481 | 314,712 | 55.3 | 15.3 | 70.6 | 29.4 |
| Finance and insurance | 454,574 | 99,180 | 553,754 | 306,353 | 860,107 | 52.9 | 11.5 | 64.4 | 35.6 |
| Real estate and rental and leasing | 31,826 | 39,408 | 71,234 | 194,346 | 265,580 | 12.0 | 14.8 | 26.8 | 73.2 |
| Professional, scientific and technical services | 119,552 | 199,447 | 318,998 | 589,656 | 908,654 | 13.2 | 21.9 | 35.1 | 64.9 |
| Management of companies and enterprisesTable 3 Note 1 | 29,251 | 26,023 | 55,274 | 71,760 | 127,034 | 23.0 | 20.5 | 43.5 | 56.5 |
| Administrative and support, waste management and remediation services | 74,401 | 183,923 | 258,324 | 539,065 | 797,389 | 9.3 | 23.1 | 32.4 | 67.6 |
| Educational services | 1,718 | 4,160 | 5,879 | 67,526 | 73,405 | 2.3 | 5.7 | 8.0 | 92.0 |
| Health care and social assistance | 17,683 | 15,852 | 33,535 | 453,591 | 487,127 | 3.6 | 3.3 | 6.9 | 93.1 |
| Arts, entertainment and recreation | 17,575 | 27,637 | 45,212 | 194,233 | 239,445 | 7.3 | 11.5 | 18.9 | 81.1 |
| Accommodation and food services | 31,025 | 116,015 | 147,041 | 1,095,130 | 1,242,170 | 2.5 | 9.3 | 11.8 | 88.2 |
| Other services | 5,093 | 43,036 | 48,130 | 424,748 | 472,878 | 1.1 | 9.1 | 10.2 | 89.8 |
Source: Statistics Canada, table 36-10-0620-01. |
|||||||||
| Canadian multinational enterprises | Foreign multinational enterprises | All multinational enterprises | Non-multinational enterprises | Corporate sector | Canadian multinational enterprises | Foreign multinational enterprises | All multinational enterprises | Non-multinational enterprises | |
|---|---|---|---|---|---|---|---|---|---|
| number of jobs | percent | ||||||||
| Canada | 2,059,621 | 2,299,751 | 4,359,371 | 8,265,624 | 12,624,996 | 16.3 | 18.2 | 34.5 | 65.5 |
| Newfoundland and Labrador | 18,472 | 19,583 | 38,056 | 94,633 | 132,688 | 13.9 | 14.8 | 28.7 | 71.3 |
| Prince Edward Island | 4,541 | 4,154 | 8,695 | 34,214 | 42,909 | 10.6 | 9.7 | 20.3 | 79.7 |
| Nova Scotia | 49,460 | 42,554 | 92,014 | 181,903 | 273,917 | 18.1 | 15.5 | 33.6 | 66.4 |
| New Brunswick | 41,131 | 31,627 | 72,758 | 155,559 | 228,317 | 18.0 | 13.9 | 31.9 | 68.1 |
| Quebec | 434,615 | 393,409 | 828,024 | 1,983,310 | 2,811,334 | 15.5 | 14.0 | 29.5 | 70.5 |
| Ontario | 820,983 | 1,161,026 | 1,982,009 | 3,028,458 | 5,010,467 | 16.4 | 23.2 | 39.6 | 60.4 |
| Manitoba | 66,317 | 57,708 | 124,025 | 271,467 | 395,492 | 16.8 | 14.6 | 31.4 | 68.6 |
| Saskatchewan | 55,170 | 40,280 | 95,450 | 259,058 | 354,508 | 15.6 | 11.4 | 26.9 | 73.1 |
| Alberta | 318,281 | 295,761 | 614,043 | 1,080,056 | 1,694,099 | 18.8 | 17.5 | 36.2 | 63.8 |
| British Columbia | 246,547 | 250,622 | 497,169 | 1,157,370 | 1,654,539 | 14.9 | 15.1 | 30.0 | 70.0 |
| Territories | 4,103 | 3,026 | 7,129 | 19,597 | 26,726 | 15.4 | 11.3 | 26.7 | 73.3 |
|
Note: Figures may not add up to totals due to rounding. Source: Statistics Canada, table 36-10-0620-01. |
|||||||||
References
Bureau of Economic Analysis (2019). Activities of U.S. Affiliates of Foreign Multinational Enterprises, 2017.
Bureau of Economic Analysis (2019). Activities of U.S. Multinational Enterprises: 2017.
Organisation for Economic Co-operation and Development (2005). Measuring Globalisation: OECD Economic Globalisation Indicators. OECD Publishing, Paris.
Organisation for Economic Co-operation and Development (2008). OECD Benchmark Definition of Foreign Direct Investment, Fourth Edition. OECD Publishing, Paris.
Organisation for Economic Co-operation and Development (2018). Policy Note: Multinational Enterprises in the Global Economy. OECD Publishing, Paris.
Schaffter, Claire and Fortier-Labonte, A. (2019). Multinational enterprises in Canada. Analysis in Brief. Catalogue no. 11621M2019001. Statistics Canada, Ottawa.
Statistics Canada (2016). Canadian Classification of Institutional Units and Sectors (CCIUS), 2012. Statistics Canada, Ottawa.
Statistics Canada (2019). Activities of Canadian majority-owned affiliates abroad, 2017. The Daily, September 24, Catalogue no. 190924a.
Statistics Canada (2018). Activities of foreign majority-owned affiliates in Canada, 2016. The Daily, November 14, Catalogue no. 181114a.
Notes
- Date modified: