
Latest Developments in the Canadian Economic Accounts
A preview of the 2019 revision of the Canadian System of Macroeconomic Accounts
Executive summary
- The annual revision of the Canadian System of Macroeconomic Accounts (CSMA) is scheduled for November 2019. This revision will improve the accuracy and enhance the exhaustiveness of Canada’s gross domestic product (GDP) as well as the Balance of international payments (BOP).
- The 2018 legalization of cannabis in Canada, as well as improvements in international travel surveys and the availability of new data on education-related travel, created the need to conduct revisions as far back as 1961.
- The revision consists of conceptual revisions as well as statistical revisions. The conceptual revisions expand the production boundary and integrate illegal cannabis into the accounts.
- The statistical revisions are a result of expanded travel survey coverage, the use of more accurate data on education-related international travel, and other improvements in methodology related to international travel services of the Balance of International Payments Account.
- The statistical revisions in international travel services are related to two areas, education-related travel and non-education related travel, which covers revisions to other business travel and other personal travel.
- Both the conceptual and statistical revisions will result in a marginal upward shift in gross domestic product (GDP) and lower the current account deficit during the reference years as international receipts are revised up by more than payments. The travel services revision will also lead to an increase in the share of both exports and imports of services in GDP during the in-scope years.
Introduction
This article describes the upcoming revisions (November 2019) to the Canadian System of Macroeconomic Accounts (CSMA) resulting from the inclusion of illegal cannabis production, consumption and distribution as well as statistical revisions of international travel services. The paper highlights the impact of these revisions on gross domestic product (GDP) and the Balance of international payments (BOP).
Revised estimates of Canada’s GDP that include illegal cannabis production, consumption and distribution have already been published with the fourth quarter 2018 release of the National Economic Accounts. Revisions to the Provincial and Territorial Economic Accounts related to travel services and illegal cannabis will be published in November 2019. The revisions related to travel services for the most recent reference period will be published in October 2019 with the release of annual data on International Trade in Services and will be further integrated in Canada’s BOP account in November 2019. Revisions related to travel services will be integrated into Canada’s national accounts in November 2019.
This article provides an indication of the size and direction of the revisions but the data presented are not final and are subject to further processing. Therefore, there may be slight differences between the results presented in this paper and the final revisions published in October and November 2019.
Revision policy
The CSMA is subject to three types of revisions. The first type refers to the in-year revisions where the current year quarterly data are subject to revision. The second type represents annual revisions in which data are generally revised for the previous three years to incorporate more complete source data such as data obtained from annual surveys or taxation records. The revision referred to in this paper is of the third type, which is to say it extends more than three years back. It may include changes to concepts, methods, classification systems and accounting standards as well as significant statistical improvements.
The planned October and November 2019 revisions to the CSMA are of the third type in nature and will result in revisions to key aggregates for the period 1961 to the present. This revision is minor when compared with previous comprehensive revisions undertaken in 1986, 1997, 2012 and 2015 where significant conceptual and statistical changes were implemented.
Since the sources and methods used to integrate the production, distribution and consumption of cannabis into the CSMA have already been extensively covered in an earlier article, only a condensed summary will be presented here.Note The remainder of the article will focus on the statistical revision of travel services.
In addition to summarizing the revision of the CSMA, this article is also meant to provide advanced information to BOP data users so that they can prepare for the November 2019 quarterly data release that covers data going back to the first quarter of 1981.
Scope of the revision
Integration of illegal cannabis into the National Economic Accounts
Estimates of illegal cannabis have been incorporated into the official estimates of GDP as of February 2019, for the period 1961 to 2018. Bill C-45, the Cannabis Act, was approved by Parliament and given royal assent on June 21, 2018. The drug’s new status came into effect on October 17, 2018.
Statistics Canada follows the recommendations for macroeconomic accounting laid out in the international manual, System of National Accounts 2008 (2008 SNA), which recommends the inclusion of illegal activities when measuring GDP. However, Statistics Canada had not implemented this recommendation with respect to illegal cannabis until the fourth quarter of 2018. Illegal cannabis production, distribution and consumption are now included in Canada’s official national estimates of GDP. The Provincial and Territorial Economic Accounts for the period 1981 to 2018 still need to be updated.
While illegal cannabis production, distribution and consumption were incorporated into estimates of GDP at the time of the fourth quarter 2018 release (February 2019), cannabis estimates were not yet integrated into the BOP’s historical data. As such, this article will provide the first glimpse of historical BOP data including illegal cannabis.
Statistical revision related to travel services in the international trade in services of the current account and expenditure-based gross domestic product
Within the current account of the Canadian BOP, international transactions in services cover travel services, transportation services, commercial services and government services. Based on the purpose of travel classification, the expenditure on international travel services covers business travel and personal travel. Business travel is further sub-classified into two categories: crew spending and other business travel. Personal travel is sub-classified into three categories: health-related, education-related and other personal travel.Note
Historically, both on the export and import side, travel services accounted for the second largest share of international trade in services, after commercial services. Travel services represent travelers’ expenditure on goods and services purchased for their own use or to give away, acquired from the economy of a destination country by a non-resident visitor to that country, with the duration of the visit lasting less than a year. For example, export represents the expenditure of a non-resident visiting Canada, while import represents the expenditure of a Canadian visiting a foreign country.
The statistical revision in travel services is related to two areas, education-related travel and non-education related travel, which covers revisions to other business travel and other personal travel.
The revisions to Canada’s BOP will be incorporated into Canada’s estimates of expenditure-based GDP. These revisions will result in changes to Canada’s imports and exports of travel services for the period 1981 to 2018.
Start of text box
What is the Balance of international payments?
The Balance of international payments covers all economic transactions between Canadian residents and non-residents in two accounts, the current account and the capital and financial account.
The current account covers transactions in goods and services as well as in primary income and secondary income between residents and non-residents.
The capital account shows credit and debit entries for non-produced non-financial assets and capital transfers between residents and non-residents.
The financial account shows net acquisition and disposal of financial assets and liabilities in international financial transactions of residents with non-residents.
The sum of the balances on the current account and capital account represents the net lending (surplus) or net borrowing (deficit) by the economy with the rest of the world. This is conceptually equal to the net balance of the financial account. In other words, the financial account measures how the net lending or borrowing from non-residents is financed. In practice, however, as international transaction data are compiled from multiple sources, an exact balancing of the two sides is rarely the case; rather, it gives rise to measurement error, known as statistical discrepancy.
Statistical discrepancy is the unobserved net inflow or outflow.
Source: Adapted from Balance of Payments and International Investment Position Manual, sixth edition (BPM6).
End of text box
Revision to education-related travel
The revision of education-related travel addressed the underestimation caused by enrollment figures that were originally lower due to limited survey coverage. This mostly pertained to the export side where the use of more accurate data led to an increase in enrollment statistics of foreign students in Canada’s colleges and universities. The update also included coverage of elementary and secondary school enrollments that were not previously covered. Growth in recent years has been updated using study permits. On the import side, data from United Nations Education, Scientific and Cultural Organization (UNESCO) on Canadian students abroad has been primarily used to improve enrollment statistics.
Other areas of revision to education-related travel included tuition fees and other non-tuition areas of spending, such as food, lodging, etc. On the export side, international undergraduate and graduate tuition fees from the Tuitions and Living Accommodation Costs Survey, as well as estimated spending for other types of expenses, have been used to improve the tuition fee estimates. On the import side, average spending in Canada has been used as an indicator for average spending by Canadian students abroad. With respect to other areas of spending (i.e. other than tuition fees), such as food, lodging, etc., more up-to-date foreign price indices were used to improve education-related travel statistics.
Revision to non-education related travel
The revision to non-education related travel covered other business travel and other personal travel. It mainly resulted from the introduction of the new Canadian tourism surveys. This was followed by the application or implementation of adjustments to address outliers and breaks in the time series caused by the introduction of the new surveys.
Starting with the 2013 reference year, the International Travel Survey (ITS) program, which is a major data source of the international travel services statistics, has been modernized with updated questionnaires, expanded coverage (larger distribution of questionnaires on the U.S.-Canada border) and improved imputation methods. The revisions have resulted in increased export and import values as well as breaks in the time series that required further adjustments. BOP travel data were linked to ITS growth rates and not levels, which has limited the impact on the revisions in terms of a break in the series.
As of January 2018, the ITS was replaced by two new surveys. The first is the Visitor Travel Survey, which includes the U.S. and overseas visitors to Canada component of the ITS. The second is the National Travel Survey, which includes the Canadian residents travelling abroad component of the ITS as well as domestic travel within Canada, formerly covered by the Travel Survey of Residents of Canada.Note Data from the new surveys have not yet been integrated into BOP. However, once data from these new surveys are integrated, that may trigger further revisions in travel services.
Results and analysis
Impact on gross domestic product
Impact of the inclusion of illegal cannabis on gross domestic product
Illegal cannabis estimates were first published as part of official national GDP in the fourth quarter 2018 release of the National Economic Accounts. The release covered estimates of the newly-legalized and illegal economic activities related to cannabis production, distribution and consumption for non-medical and medical use. The production, distribution and consumption activities related to the legal use of medical cannabis were already incorporated in the official estimates of GDP as of 2014.
Economic activities related to illegal cannabis cover a whole range of economic transactions and therefore impact a number of aspects of GDP, such as production, distribution and consumption as well as exports and imports. Cannabis growers produce the product. These businesses purchase intermediate inputs such as electricity, fertilizer, water, and rentals; grow, process and distribute products; invest in plants and equipment; and earn income. Households purchase illegal cannabis for consumption.
The estimates of illegal cannabis have been incorporated in all three GDP accounts, namely, production-based, income-based and expenditure-based. As a result, adjustments have been incorporated to account for both newly-legalized recreational cannabis and illegal cannabis activities, revising the previously-published GDP estimates. While several adjustments were made due to the expansion of the production boundary to include illegal cannabis estimates, this has resulted in a minimal upward shift in GDP with no significant change in growth.

Data table for Chart 1
| Previously-published estimates of gross domestic product | Revised estimates of gross domestic product | |
|---|---|---|
| billions of dollars | ||
| 2010 | 1,662 | 1,666 |
| 2011 | 1,770 | 1,774 |
| 2012 | 1,823 | 1,827 |
| 2013 | 1,898 | 1,903 |
| 2014 | 1,990 | 1,995 |
| 2015 | 1,986 | 1,991 |
| Source: Statistics Canada, table 36-10-0222-01. | ||
The expenditure-based GDP estimates shown in Chart 1 represent the previously-published GDP that did not include illegal cannabis estimates, versus the revised GDP. The difference between the two ranged from $3.9 billion to $4.7 billion. The following table presents the impact as a percentage revision to GDP.
| Gross value added related to cannabis | Previously-published estimates of GDP | Revised estimates of GDP | Percentage revision to GDP | |
|---|---|---|---|---|
| billions of dollars | % | |||
| 2015 | 4.61 | 1,986 | 1,991 | 0.23 |
| 2014 | 4.71 | 1,990 | 1,995 | 0.24 |
| 2013 | 4.72 | 1,898 | 1,903 | 0.25 |
| 2012 | 4.40 | 1,823 | 1,827 | 0.24 |
| 2011 | 4.14 | 1,770 | 1,774 | 0.23 |
| 2010 | 3.92 | 1,662 | 1,666 | 0.24 |
|
Note: Revised estimates are for expenditure-based, annual GDP. Source: Statistics Canada, table 36-10-0222-01. |
||||
Impact of travel services revisions on expenditure-based gross domestic product, exports and imports
The travel services revisions have led to a marginal increase in GDP, which ranged from $98 million to $627 million annually between 2010 and 2015, in current dollars. This represented 0.01% to 0.03% of the published GDP during the same period. This discussion focusses only on expenditure-based GDP.
| Revisions in travel services integrated into GDP | Previously-published estimates of GDP | Revised estimates of GDP | Percentage revision to GDP | |
|---|---|---|---|---|
| billions of dollars | % | |||
| 2015 | 0.14 | 1,990 | 1,991 | 0.01 |
| 2014 | 0.61 | 1,995 | 1,996 | 0.03 |
| 2013 | 0.53 | 1,902 | 1,903 | 0.03 |
| 2012 | 0.63 | 1,827 | 1,828 | 0.03 |
| 2011 | 0.35 | 1,774 | 1,774 | 0.02 |
| 2010 | 0.10 | 1,666 | 1,666 | 0.01 |
|
Note: Revised estimates are for expenditure-based, quarterly GDP. Source: Statistics Canada, table 36-10-0104-01. |
||||
The export and import revisions were virtually offset resulting in a minimal overall increase in GDP. On a gross basis, both the export and import revisions of travel services were individually significant. Following the revision of travel services, the share of exports of services in GDP went up from an average of 4.9% to 5.1% while the share of imports of services went up from 6.2% to 6.3% on average during the years in scope.
With the revision in exports of services ranging from $1.8 million to $4.8 million annually, it represented an increment of 2.3% to 4.7%, or an average of 3.4%, in the published exports of services during the six reference years. The revisions in imports of services were also relatively strong, they ranged from a 1.7% to 3.6% increase annually.

Data table for Chart 2
| Exports of goods and services – published | Exports of goods and services – revised | |
|---|---|---|
| millions of dollars | ||
| 2010 | 484,100 | 485,943 |
| 2011 | 541,943 | 544,253 |
| 2012 | 551,863 | 554,611 |
| 2013 | 573,651 | 576,987 |
| 2014 | 628,937 | 633,114 |
| 2015 | 629,116 | 633,956 |
| Source: Statistics Canada, table 36-10-0104-01. | ||

Data table for Chart 3
| Imports of goods and services – published | Imports of goods and services – revised | |
|---|---|---|
| millions of dollars | ||
| 2010 | 515,408 | 517,153 |
| 2011 | 562,548 | 564,513 |
| 2012 | 587,015 | 589,136 |
| 2013 | 603,995 | 606,800 |
| 2014 | 647,612 | 651,176 |
| 2015 | 678,322 | 683,020 |
| Source: Statistics Canada, table 36-10-0104-01. | ||
Impact on the Balance of international payments
Impact of cannabis and travel services revision on the Balance of international payments’ current account
The BOP revisions covered those related to illegal imports and exports of cannabis as well as international travel services. The previously-published article on illegal cannabis did not discuss the impact on BOP. The combined impact of both revisions lowered the current account deficit in each of the reference periods shown in Table 3. The revision ranged from $649 million to $1.5 billion between 2010 and 2015.

Data table for Chart 4
| Current account balance – published | Current account balance – revised | |
|---|---|---|
| millions of dollars | ||
| 2010 | -59,998 | -59,350 |
| 2011 | -49,081 | -48,111 |
| 2012 | -65,680 | -64,295 |
| 2013 | -61,121 | -59,688 |
| 2014 | -47,780 | -46,260 |
| 2015 | -70,536 | -69,511 |
| Source: Statistics Canada, table 36-10-0014-01 and special tabulation. | ||
| Previously published | Revised estimates | |||||||||||
|---|---|---|---|---|---|---|---|---|---|---|---|---|
| 2010 | 2011 | 2012 | 2013 | 2014 | 2015 | 2010 | 2011 | 2012 | 2013 | 2014 | 2015 | |
| millions of dollars | ||||||||||||
| Current account | ||||||||||||
| Receipts | ||||||||||||
| Total current account | 555,107 | 619,808 | 632,436 | 657,855 | 724,390 | 731,231 | 557,834 | 623,092 | 636,312 | 662,483 | 729,863 | 737,336 |
| Goods and services | 483,213 | 540,969 | 550,735 | 572,361 | 627,640 | 627,849 | 485,941 | 544,253 | 554,610 | 576,989 | 633,113 | 633,955 |
| Goods | 403,967 | 456,613 | 461,511 | 479,225 | 529,334 | 524,046 | 404,852 | 457,586 | 462,638 | 480,517 | 530,629 | 525,313 |
| Services | 79,247 | 84,356 | 89,223 | 93,136 | 98,307 | 103,803 | 81,089 | 86,667 | 91,972 | 96,471 | 102,484 | 108,642 |
| Payments | ||||||||||||
| Total current account | 615,105 | 668,889 | 698,116 | 718,976 | 772,170 | 801,767 | 617,185 | 671,204 | 700,606 | 722,170 | 776,123 | 806,849 |
| Goods and services | 515,074 | 562,198 | 586,645 | 603,607 | 647,222 | 677,939 | 517,153 | 564,513 | 589,136 | 606,800 | 651,175 | 683,020 |
| Goods | 413,670 | 456,045 | 474,800 | 487,370 | 524,661 | 548,682 | 414,003 | 456,395 | 475,171 | 487,759 | 525,051 | 549,064 |
| Services | 101,404 | 106,153 | 111,845 | 116,236 | 122,561 | 129,257 | 103,149 | 108,118 | 113,965 | 119,041 | 126,124 | 133,955 |
| Balance | ||||||||||||
| Total current account | -59,999 | -49,081 | -65,680 | -61,121 | -47,780 | -70,537 | -59,350 | -48,111 | -64,295 | -59,688 | -46,260 | -69,511 |
| Goods and services | -31,861 | -21,229 | -35,911 | -31,246 | -19,582 | -50,090 | -31,212 | -20,260 | -34,525 | -29,812 | -18,063 | -49,065 |
| Goods | -9,703 | 567 | -13,289 | -8,145 | 4,673 | -24,636 | -9,151 | 1,190 | -12,533 | -7,242 | 5,578 | -23,751 |
| Services | -22,157 | -21,797 | -22,622 | -23,100 | -24,255 | -25,454 | -22,061 | -21,450 | -21,992 | -22,570 | -23,641 | -25,314 |
| Difference due to revision | ||||||||||||
| Difference due to revision - millions of dollars | Difference due to revision - % | |||||||||||
| Current account | ||||||||||||
| Receipts | ||||||||||||
| Total current account | 2,727 | 3,284 | 3,876 | 4,628 | 5,473 | 6,105 | 0.49 | 0.53 | 0.61 | 0.70 | 0.76 | 0.83 |
| Goods and services | 2,728 | 3,284 | 3,875 | 4,628 | 5,473 | 6,106 | 0.56 | 0.61 | 0.70 | 0.81 | 0.87 | 0.97 |
| Goods | 885 | 973 | 1,127 | 1,292 | 1,295 | 1,267 | 0.22 | 0.21 | 0.24 | 0.27 | 0.24 | 0.24 |
| Services | 1,842 | 2,311 | 2,749 | 3,335 | 4,177 | 4,839 | 2.32 | 2.74 | 3.08 | 3.58 | 4.25 | 4.66 |
| Payments | ||||||||||||
| Total current account | 2,080 | 2,315 | 2,490 | 3,194 | 3,953 | 5,082 | 0.34 | 0.35 | 0.36 | 0.44 | 0.51 | 0.63 |
| Goods and services | 2,079 | 2,315 | 2,491 | 3,193 | 3,953 | 5,081 | 0.40 | 0.41 | 0.42 | 0.53 | 0.61 | 0.75 |
| Goods | 333 | 350 | 371 | 389 | 390 | 382 | 0.08 | 0.08 | 0.08 | 0.08 | 0.07 | 0.07 |
| Services | 1,745 | 1,965 | 2,120 | 2,805 | 3,563 | 4,698 | 1.72 | 1.85 | 1.90 | 2.41 | 2.91 | 3.63 |
| Balance | ||||||||||||
| Total current account | 649 | 970 | 1,385 | 1,433 | 1,520 | 1,026 | ... | ... | ... | ... | ... | ... |
| Goods and services | 649 | 969 | 1,386 | 1,434 | 1,519 | 1,025 | ... | ... | ... | ... | ... | ... |
| Goods | 552 | 623 | 756 | 903 | 905 | 885 | ... | ... | ... | ... | ... | ... |
| Services | 96 | 347 | 630 | 530 | 614 | 140 | ... | ... | ... | ... | ... | ... |
|
... not applicable
Source: Statistics Canada, table 36-10-0014-01. |
||||||||||||
Most of the revisions to the current account balance came from the integration of illegal cannabis imports and exports. On average, cannabis exports outweighed imports by a ratio of nearly 3 to 1 during the six-year period.

Data table for Chart 5
| Cannabis-related revision | Travel services-related revision | |
|---|---|---|
| millions of dollars | ||
| 2010 | 552 | 96 |
| 2011 | 623 | 347 |
| 2012 | 756 | 630 |
| 2013 | 903 | 530 |
| 2014 | 905 | 614 |
| 2015 | 885 | 140 |
| Source: Statistics Canada, special tabulation. | ||
However, on a gross basis, revisions to travel services had a larger impact than cannabis throughout the period.

Data table for Chart 6
| Cannabis-related revision | Travel services-related revision | |
|---|---|---|
| millions of dollars | ||
| 2010 | 885 | 1,842 |
| 2011 | 973 | 2,311 |
| 2012 | 1,127 | 2,749 |
| 2013 | 1,292 | 3,335 |
| 2014 | 1,295 | 4,177 |
| 2015 | 1,267 | 4,839 |
| Source: Statistics Canada, special tabulation. | ||
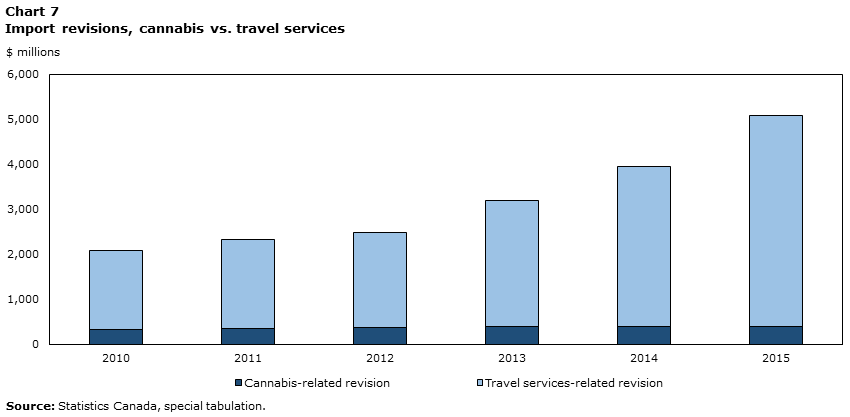
Data table for Chart 7
| Cannabis-related revision | Travel services-related revision | |
|---|---|---|
| millions of dollars | ||
| 2010 | 333 | 1,745 |
| 2011 | 350 | 1,965 |
| 2012 | 371 | 2,120 |
| 2013 | 389 | 2,805 |
| 2014 | 390 | 3,563 |
| 2015 | 382 | 4,698 |
| Source: Statistics Canada, special tabulation. | ||
Impact of travel services revisions on international trade in services
Total international trade in services covers travel services, transportation services and other services, which consist of commercial services and government services. During the reference years 2010 to 2015, the revisions in travel services lowered the trade deficit of trade in services by a range of $96 to $630 million each year, with an average of $393 million per year. Travel services remained the second-highest contributor to total trade in services following other services, both before and after the revisions. However, its contribution to total trade in services increased both on the export and import sides. On average, during the 2010 to 2015 period, export’s contribution increased from 20% to 23%, while import’s contribution rose from 31% to 32%.
Impact of education-related and non-education related travel revisions on international travel services
Historically, education-related travel has been the only travel category that has consistently brought in a trade surplus compared to all other categories of travel services. The remaining categories of travel services, such as business travel, including crew spending and other business travel, health-related travel, personal travel, and other personal travel have always had trade deficit.
Among the two sources of revisions in exports of travel services, the share of education-related travel increased from 27% in 2010 to 50% in 2015. This indicated the growing significance of education-related travel exports.
According to the latest figures, the countries of origin for the majority of foreign students in Canada were China, France, India and the United States.
Conclusion
The paper has summarized the upcoming revision of the CSMA and the impact on GDP and BOP. The revision consists of a conceptual component and a statistical component. The conceptual revision expands the production boundary and integrates illegal cannabis into the accounts, while the statistical revision is the result of an expanded survey coverage and other improvements in the processing of survey data related to international travel services of the Balance of International Payments Account. The statistical revision in international travel services is related to two areas, education-related travel, and non-education related travel which covers revisions to other business travel and other personal travel. Both the conceptual and statistical revisions will result in a marginally-upward shift in GDP and lower the current account deficit in BOP as international receipts are revised up by more than payments. The travel services revision will lead to an increase in the share of both exports and imports of services in GDP during the in-scope years.
- Date modified: