
Latest Developments in the Canadian Economic Accounts
Measuring digital economic activities in Canada: Initial estimates

Archived Content
Information identified as archived is provided for reference, research or recordkeeping purposes. It is not subject to the Government of Canada Web Standards and has not been altered or updated since it was archived. Please "contact us" to request a format other than those available.
Correction Notice
The breakdown of digital economy jobs by domain (found in Tables 2.1 to 2.14) were incorrectly ordered. The issue did not affect the estimates of total jobs nor did it affect any of the estimates for output and gross domestic product (GDP).
Acknowledgements
This paper was prepared by Amanda Sinclair of the National Economic Accounts Division, Statistics Canada.
This work would not have been possible without the invaluable contributions of Catherine Ayotte, and Andrew Barclay as well as support from Monique Deschambault, Demi Kotsovos, Denise Lafleur, Emmanuel Manolikakis, Julie Smith, Catherine Van Rompaey, James Tebrake and Mark Uhrbach.
Statistics Canada would also like to thank the staff from the U.S. Bureau of Economic Analysis (BEA) for sharing their knowledge and experience with us.
Introduction
Advancements in technology and the Internet have fundamentally changed how people and businesses interact and how they produce, distribute and consume goods and services. Not long ago people would typically hire a travel agent to book a vacation, or go to a store to buy a new pair of shoes or rent a movie. Today we can search and compare hundreds of hotel prices ourselves, rent someone else’s home for our vacation, buy products from all over the world and stream a seemingly endless supply of videos—all from the comforts of our home.
As technological advancement continues and digitalization rapidly expands to affect more segments of the economy, there is an increasing need to accurately measure and assess its impacts. Statistics Canada is responding to this challenge by working towards defining and measuring the economic value of digital economic activities in Canada, the provinces and territories.
This paper presents Statistics Canada’s working definition of the digital economy as well as initial estimates on the output, gross domestic product (GDP) and jobs associated with those activities. The first section provides an overview of the methodology and data sources used to compile the estimates. From there the initial estimates are presented and analysed in context of the total Canadian economy. Finally, the paper outlines some of the limitations of these initial estimates as well as next steps in improving measures of the digitalization of the economy in the Canadian System of Macroeconomic Accounts (CMEA).
Methodology
The estimates presented in this paper were derived within the Canadian Supply and Use Framework following the same methods used by Statistics Canada for deriving other satellite accounts. The Supply and Use Tables (SUTs) capture and present the production of products by domestic industries, imports of products as well as their use, either ad inputs, final consumption, investment or exports. However, at times, the classifications that are used in the SUTs hide economic activity that may be important for analytical purposes. Satellite accounting involves disaggregating and recompiling the information from the SUTs into new categories in order to better understand an activity or sector, such as digital transactions.
While built with the Canadian SUTs, this paper applies the same concepts and definitions of the digital economy as used by the U.S. BEA in “Defining and Measuring the Digital Economy”.Note These estimates build upon the work done by U.S. BEA by including some “partial” digital products where data was available.
This work also borrows heavily from the digital economy measurement literature from the Organisation of Economic Co-operation and Development (OECD), including its proposed framework for a satellite account for measuring the digital economy.Note However, due to limitations in available data on the nature of all digital economy transactions, it was not feasible at this time to do a full breakdown of the Canadian SUTs into the recommended digitally-ordered, digitally-delivered and platform-enabled transactions. As a first step we have identified products within the SUTs that either primarily or partially fall into one of the above transaction categories.
The methodology for deriving the estimates of the digital economy in Canada consisted of the following three steps:
- Developing a product framework for the digital economy;
- Identifying ‘full’ and ‘partial’ digital products, based on the above definition, within the Canadian SUTs;
- Estimating the economic value of digital economic activities, in terms of output, GDP and jobs.
Using this methodology, estimates of the digital economy were derived for Canada and the provinces and territories for the period from 2010 to 2015. Estimates for reference years 2016 and 2017 relied on projections of GDP by industry to derive preliminary estimates of gross output and GDP by industry. These preliminary estimates assume the same production function and output distribution as the latest available SUT benchmark year. The output and GDP estimates presented in this paper are valued in nominal basic prices.
1. Product framework for the digital economy
Perhaps the biggest challenge with measuring the digital economy is the lack of a clear and agreed upon definition as to what it should include. As technology and business models continue to evolve at a rapid pace so too should a definition of the digital economy. For this reason, rather than attempting to solidify a complete definition of the digital economy, this paper presents a working list of products that reflect activities within a digitalized economy. The list of products is based on the OECD’s digital economy measurement framework and can be broken down into the following categories: 1) digitally-enabled infrastructure, 2) digitally-ordered transactions (e-commerce), and 3) digitally-delivered products.Note
Digitally-enabled infrastructure
Technology is the foundation for digitalization and therefore computers and their networks should be captured in estimates of the digital economy. Digital-enabling infrastructure includes the information technology equipment, systems, software, services, and structures upon which the digital economy relies to function (OECD 2011). The U.S. BEA proposed the following categorization of digital-enabling infrastructureNote :
- Computer hardware: The manufactured physical elements that constitute a computer system.
- Software: The programs and other operating information used by computing devices and servers.
- Telecommunications equipment and services: The equipment and services required for the digital transmission of information over a distance by cable, telegraph, telephone, broadcasting, or satellite.
- Support services: Services necessary for the function of digital infrastructure such as education services, consulting services and computer repair services.
- Structures: The construction of buildings where digital economy producers create digital economy goods or supply digital economy services. This category also includes buildings that provide support services to digital products, including data centers, semiconductor fabrication plants, the installations of fiber optic cables, switches, repeaters, etc.
- The Internet of Things (IoT): Devices and objects whose state can be altered using the Internet, with or without active involvement from individuals.Note
Digitally-ordered transactions (e-commerce)
A defining feature of a digitalized economy is the ability to conduct transactions through digital channels, in other words e-commerce. In measuring e-commerce, Statistics Canada follows the OECD definition which is “the sale of goods or services where the order is received and the commitment to purchase is made via the Internet, even if payment is made by other means”.Note Some examples of e-commerce transactions include purchasing goods online and either picking them up in store or having them shipped to your house. E-commerce can also include buying a movie admission ticket via a mobile app, making a hotel reservation on the hotel’s website, or purchasing products that are delivered digitally (i.e. in digital format) such as music downloads or video streaming.
E-commerce, or digitally-ordered transactions, can be business-to-business (B2B), business-to-consumer (B2C) or peer-to-peer (P2P). B2B and B2C e-commerce transactions consist of the sale of goods and services over the Internet. While P2P transactions also use the Internet to sell goods and services, they can also be classified as platform-enabled as they often involve a third party to facilitate transactions via a digital platform.
The OECD proposed framework for a digital economy satellite account also recommends that platform-enabled transactions be distinguished from traditional e-commerce transactions. However, there are many challenges in identifying and measuring platform-enabled transactions.
Digitally-delivered products
Digitally-delivered products consists of content transmitted and consumed in digital format. It seems as though every day more and more products are being delivered and consumed in digital format, whether it is purchasing or renting music and videos, reading books and newspapers, storing photos and documents or accessing banking services online.
For the purposes of these estimates, Statistics Canada considers digitally-delivered products as those that are created, delivered, accessed or consumed in digital format. In addition to digital products themselves, any legal rights or licences that accompany the sale and distribution of digitally-delivered creative content are included.
This definition allows for the inclusion of free media, which is content accessed with no direct cost to consumers. For the time being, however, Statistics Canada has limited the estimates to direct sales of digitally-delivered content. The consumption of free digital content, while important for discussions about consumer surplus and social welfare, is not directly measured within the CMEA.
2. Identifying digital products within the Canadian Supply and Use Tables
Once the working definition of the digital economy was developed, products that fit within each domain were identified in the Canadian SUTs. The Canadian SUTs use the Supply and Use Product Classification (SUPC) system, a variant based on the North American Product Classification System (NAPCS), to classify products within the economy. Products within the SUPC were identified as either ‘full’ or ‘partial’ digital economy products and grouped into their corresponding digital economy domains. A complete list of the included products can be found in Annex A.
A product is classified as a ‘full’ digital economy product if its purpose is exclusively or primarily within one of the digital economy domains outlined above. Some examples of ‘full’ digital economy product include computers, computer peripherals and parts, general purpose software as well as mobile and fixed internet access services. The functions of these products are exclusively to enable digital computing, processing and communication and therefore are included in measures of the digital economy in their entirety.
Products are classified as ‘partial’ digital economy products if they are comprised of both digital and non-digital components. For example, books can either be in digital format (e-books) or in physical print format. These products were evaluated to determine if they could be split into digital and non-digital components. In the end, not all identified ‘partial’ products could be included as, in many cases, data was not available to identify the digital components.
Digitally-enabled infrastructure
Following this approach, nearly all computer hardware and software products, telecommunication goods and services and support services were identified as full digital economy products and included within the digitally-enabled infrastructure domain. One exception was in the support services category, where education services were identified as a partial digital economy product. Including education as a support service to the digital economy is based on the idea that for the digital economy to function it requires the necessary knowledge and skills to create, maintain and develop digitally-enabled infrastructure and other resulting digital products.
To meet this requirement, a portion of postsecondary education services, as well as trade, technical and professional training services assumed to support the digital economy, were included. Statistics Canada’s Postsecondary Student Information System (PSIS), a national survey providing information on student enrollments in Canadian public postsecondary institutions, was used to estimate the share of enrollments in identified digital-enabling education programs relative to total enrollments. The PSIS classifies enrollments using the Classification of Instructional Program (CIP) from which digital-enabling programs were identified. The complete list of digital-enabling programs identified and used can be found in Annex B.
While the PSIS only tracks enrollments in public postsecondary institutions, it was used to estimate the share of digital-enabling education services for both public and private education services. This was necessary due to a lack of data available on the types of education and training programs offered by private organizations in Canada.
Although arguments could be made to include a wider list of education programs supporting the digital economy, (for example business management), at this time, only programs that provide knowledge and skills directly related to the creation and use of digital technology were included. Additionally, it would make sense to include a portion of primary and secondary education services as the resulting knowledge and skills are necessary to pursue postsecondary education and in turn support the digital economy. However, due to data limitations, no primary or secondary education services could be included in the digital economy estimates.
Similarly, the production of government organizations and regulators supporting the digital economy were not included. Government finance statistics do not currently contain sufficient detail to support this analysis. Future releases of these estimates may identify these amounts.
Finally, within the digital-enabling infrastructure domain, Statistics Canada did not include structures and IoT because of the difficulty in determining an accurate split of these products into their digital and non-digital components.
Digitally-ordered transactions (e-commerce)
When it comes to digitally-ordered transactions, the portion of wholesale and retail margins attributable to e-commerce were included. Data from the e-commerce modules on the Annual Wholesale Trade Survey, the Annual Retail Trade Survey and the Annual Retail Non-store Survey were used to estimate the portion of sales attributable to e-commerce transactions for each wholesale and retail industry. These e-commerce ratios were then applied to each wholesale and retail margin by industry.
The only non-margin product included within the digitally-ordered domain was travel arrangements, reservation and planning services. This product category includes services associated with planning and booking transportation and accommodation services as well as entertainment and recreation services. Research identified that these types of services are primarily conducted via the Internet, even when there is an intermediary or travel agent facilitating the transaction. While the presence of intermediary platforms suggests this product be separated into its own category, there is a lack of detail to separate out those transactions that are platform enabled and those that are not. For the time being Statistics Canada decided to include this product within the digitally-ordered (e-commerce) domain.
Digitally-delivered products
Statistics Canada identified several full and a few partial digitally-delivered products to be included within the estimates. Most of the full digitally-delivered products were media products, such as movies, videos, music and other sound recordings, which today are most often created and delivered (either to intermediaries or final consumers) in digital format. In addition to the these digital media products, the associated licensing and broadcasting rights were included, as content creators typically sell rights to others to distribute their content. From the broadcasting side, fees for distribution as well as advertising revenue generated based on their distribution were included.
The identified partial digitally-delivered products include other media products sometimes created and delivered in digital format, such as books, newspapers and magazines. For these products digital ratios were derived using data from the corresponding service industry, which collect information on the proportion of sales attributable to the digitally-delivered version of the industries’ main products. For books, a ratio for sales of e-books was derived, while for newspapers and magazines, digital ratios were based on sales for digital versions of the products themselves, including advertising in the digitally-delivered products.
A limitation of these partial digitally-delivered media products is that data on the digital components were only available for the primary producing industry. For example, sales of e-books was only available for the book publishing industry. The result is that these partial digitally-delivered products could not be split between the digital and non-digital components for the entire economy.
As mentioned earlier, Statistics Canada does not directly measure the consumption of free media products, such as watching videos broadcasted on the Internet. Advertising revenue earned by platforms that distribute free media content are captured in the CMEA and included in digital economy estimates as internet advertising. Additionally, income earned by individuals from posting creative content on free distribution sites or social media ‘influencers’ is included in the CMEA. However, there are challenges in capturing this activity as with all household production, due to potential under-reporting and misclassification of revenuesNote . For these reasons, it is difficult to identify which products to include in this activity.
The final partial digitally delivered product included in these initial estimates is explicit banking service fees. Everyday more and more financial services, such as checking account balances, depositing cheques, transferring funds, paying bills or applying for credit, are provided online. In fact some financial institutions only offer online services and do not have a physical presence in the form of ‘bricks and mortar’ branches for consumers to access their services.
There are several challenges with including banking service fees within these estimates. First, financial institutions do not necessarily charge a direct fee for accessing or using their online services, but rather bundle access to online services within other charges. Moreover, some explicit banking service fees are charged for financial services that are not digitally delivered, for example, an overdrawn account or a non-sufficient fund charge on an account are not associated with online access to banking services. Despite these challenges it is important to include, at least partially, some of the explicit banking fees charges by financial institutions in estimates of the digital economy.
The portion of explicit banking fees included was derived using detailed information on the types of explicit service fees charged by banks and credit unions in Canada relative to their total revenue from explicit charges. Additional information on the proportion of Canadians who use online or mobile banking as their primary method of banking was also taken into considerationNote .
3. Estimating the economic value of digital economic activities
After identifying the full and partial digital products, the output of these products were aggregated by industry. As indicated above, all of the output is taken for those products identified as full while only a portion of the output for the partial products is included. The digital portions for each of the partial products were estimated using additional data from surveys and administrative sources, regarding the products components.
The aggregate output of all the identified digital products by industry was divided by the total output for each industry taken from the supply table. The resulting ratios were then used to estimate the GDP and jobs, by industry. Table 1 illustrates how the digital output ratios were calculated and applied to GDP and jobs by industry and for the entire economy.
| Industry A | Industry B | Total economy | |
|---|---|---|---|
| number | |||
| Output | |||
| Product A: fully digital product | 5,000 | 10,000 | 15,000 |
| Product B: partially digital product | 3,000 | 0 | 3,000 |
| Product B.1: digital portion | 2,000 | 0 | 2,000 |
| Product B.2: non-digital portion | 1,000 | 0 | 1,000 |
| Product C: all other products (non-digital) | 12,500 | 2,000 | 14,500 |
| Total output | 23,500 | 12,000 | 35,500 |
| Digital output (product A + product B.1) | 7,000 | 10,000 | 17,000 |
| Digital output ratio (digital output ÷ total output) | 0.29 | 0.83 | 0.48 |
| Total GDP | 12,750 | 8,000 | 20,750 |
| Digital economy GDP (total GDP × digital output ratio) | 3,570 | 6,640 | 10,210 |
| Total jobs | 1,000 | 2,500 | 3,500 |
| Digital economy jobs (total jobs × digital output ratio) | 280 | 2,075 | 2,355 |
|
Note: Above are some hypothetical data that are used as examples to illustrate the method used for calculating digital output, GDP, and jobs using the supply and use tables. Source: Statistics Canada. |
|||
The approach taken assumed that the relationship between an industry’s intermediate inputs and output for digital products was the same as its total output. The same assumption was applied when estimating jobs for the digital economy. The methodology used to derive the estimates in this paper assumed that the production function of an industry is the same for digital and non-digital output.
While this assumption is limiting, there is currently a lack of available data on the intermediate inputs associated with the production of digital products versus non-digital products. Incorporating more information on intermediate inputs and jobs attributable to the production of digital products is something that can be improved as Statistics Canada continues to refine estimates of the digital economy. This and other challenges are discussed later in the paper.
Results
The following estimates of the digital economy were derived according to the methods outlined previously. They represent a first attempt at estimating the size, growth and nature of digital economic activities in Canada. Digital economic activities, commonly referred to as the digital economy, include those activities that enable digitization or are highly affected by it. All dollar values are expressed in nominal basic prices. A complete set of tables, by province and territory, are available at the end of this report.
Gross domestic product
The nominal GDP associated with digital economic activities in Canada totalled $109.7 billion in 2017 or 5.5% of the total economy.
While the digital economy is not an industry, to give a scale of its importance, in 2015 it was larger than mining, quarrying and oil and gas extraction (4.8%), transportation and warehousing (4.6%) and utilities (2.4%).Note
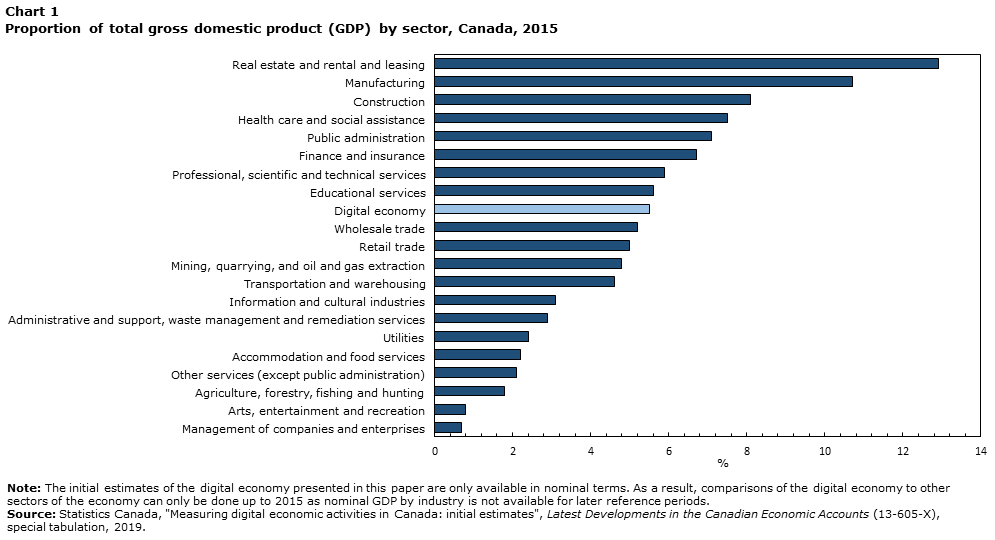
Data table for Chart 1
| Sector | Percent |
|---|---|
| Management of companies and enterprises | 0.7 |
| Arts, entertainment and recreation | 0.8 |
| Agriculture, forestry, fishing and hunting | 1.8 |
| Other services (except public administration) | 2.1 |
| Accommodation and food services | 2.2 |
| Utilities | 2.4 |
| Administrative and support, waste management and remediation services | 2.9 |
| Information and cultural industries | 3.1 |
| Transportation and warehousing | 4.6 |
| Mining, quarrying, and oil and gas extraction | 4.8 |
| Retail trade | 5.0 |
| Wholesale trade | 5.2 |
| Digital economy | 5.5 |
| Educational services | 5.6 |
| Professional, scientific and technical services | 5.9 |
| Finance and insurance | 6.7 |
| Public administration | 7.1 |
| Health care and social assistance | 7.5 |
| Construction | 8.1 |
| Manufacturing | 10.7 |
| Real estate and rental and leasing | 12.9 |
|
Note: The initial estimates of the digital economy presented in this paper are only available in nominal terms. As a result, comparisons of the digital economy to other sectors of the economy can only be done up to 2015 as nominal GDP by industry is not available for later reference periods. Source: Statistics Canada, "Measuring digital economic activities in Canada: Initial estimates", Latest Developments in the Canadian Economic Accounts (13-605-X), special tabulation, 2019. |
|
Between 2010 and 2017, nominal GDP for the digital economy (+40.2%) grew more than the total economy (+28%). On an annual basis, the digital economy increased more than the total economy every year except 2011 and 2017, which were years of strong growth in the energy sector.
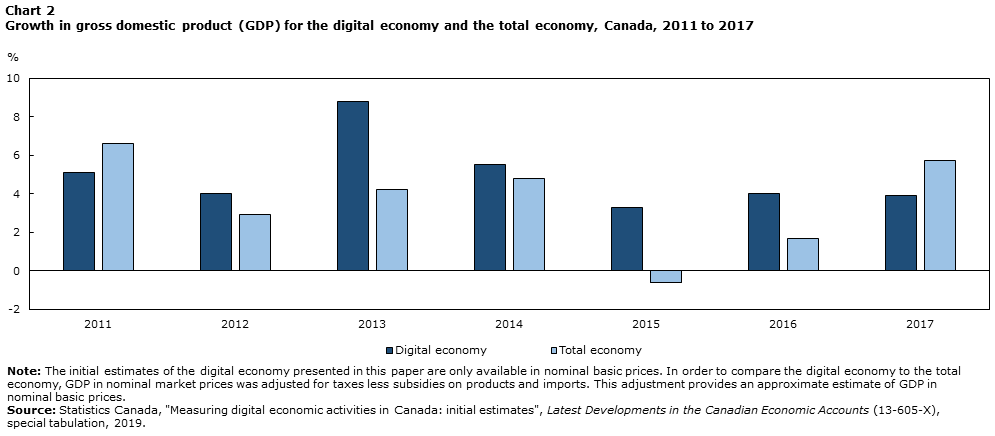
Data table for Chart 2
| 2011 | 2012 | 2013 | 2014 | 2015 | 2016 | 2017 | |
|---|---|---|---|---|---|---|---|
| % | |||||||
| Digital economy | 5.1 | 4.0 | 8.8 | 5.5 | 3.3 | 4.0 | 3.9 |
| Total economy | 6.6 | 2.9 | 4.2 | 4.8 | -0.6 | 1.7 | 5.7 |
|
Note: The initial estimates of the digital economy presented in this paper are only available in nominal basic prices. In order to compare the digital economy to the total economy, GDP in nominal market prices was adjusted for taxes less subsidies on products and imports. This adjustment provides an approximate estimate of GDP in nominal basic prices. Source: Statistics Canada, "Measuring digital economic activities in Canada: Initial estimates", Latest Developments in the Canadian Economic Accounts (13-605-X), special tabulation, 2019. |
|||||||
Telecommunications and support services, part of the digital-enabling infrastructure domain, were the largest contributors to the digital economy in Canada. However, between 2010 and 2017 the contribution of the telecommunications sub-domain declined from roughly 37% in 2010 to slightly under 30% by 2017. During the same period, the same period the contribution of e-commerce more than doubled, increasing from 5.5% of the digital economy in 2010 to 12.4% in 2017.

Data table for Chart 3
| 2010 | 2011 | 2012 | 2013 | 2014 | 2015 | 2016 | 2017 | |
|---|---|---|---|---|---|---|---|---|
| % | ||||||||
| E-commerce | 5.5 | 5.4 | 5.3 | 10.0 | 10.5 | 11.4 | 12.1 | 12.4 |
| Hardware | 8.1 | 7.3 | 6.3 | 5.7 | 5.9 | 5.7 | 5.8 | 5.9 |
| Digitally-delivered products | 11.0 | 11.0 | 11.0 | 11.7 | 11.7 | 10.5 | 10.6 | 10.5 |
| Software | 15.7 | 15.7 | 16.2 | 15.1 | 15.6 | 15.8 | 15.7 | 15.9 |
| Support services | 22.9 | 23.9 | 25.1 | 24.4 | 25.1 | 25.8 | 26.1 | 26.6 |
| Telecommunications | 36.9 | 36.6 | 36.1 | 33.1 | 31.2 | 30.9 | 29.7 | 28.7 |
| Source: Statistics Canada, "Measuring digital economic activities in Canada: Initial estimates", Latest Developments in the Canadian Economic Accounts (13-605-X), special tabulation, 2019. | ||||||||
On a regional basis, the nominal value added of the digital economy in 2017 was the largest in Ontario, Quebec and British Columbia. The three territories and Saskatchewan had the smallest digital economy GDP as a proportion of their total economies.
Between 2010 and 2017 the nominal GDP of digital economic activities grew in all provinces and territories. However, when compared to growth in the total economy, Manitoba, Yukon and Nunavut saw slower growth in digital economy GDP over the seven year period.
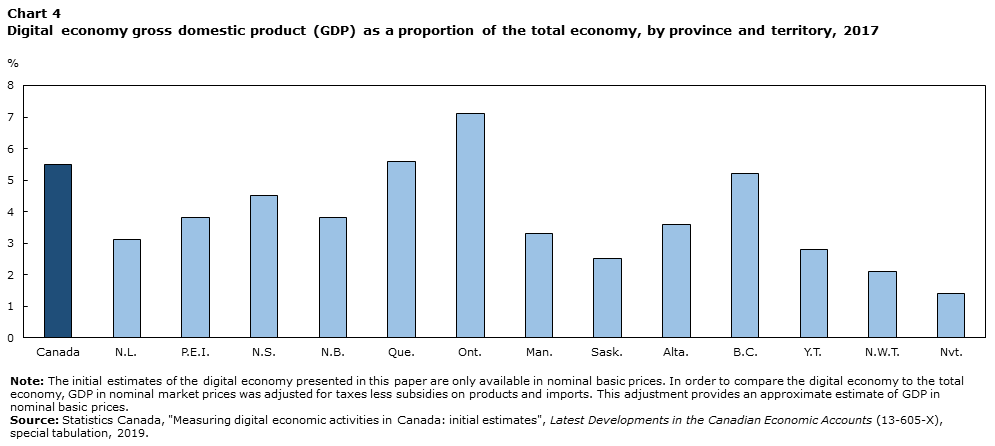
Data table for Chart 4
| Geography | Percent |
|---|---|
| Canada | 5.5 |
| N.L. | 3.1 |
| P.E.I. | 3.8 |
| N.S. | 4.5 |
| N.B. | 3.8 |
| Que. | 5.6 |
| Ont. | 7.1 |
| Man. | 3.3 |
| Sask. | 2.5 |
| Alta. | 3.6 |
| B.C. | 5.2 |
| Y.T. | 2.8 |
| N.W.T. | 2.1 |
| Nvt. | 1.4 |
|
Note: The initial estimates of the digital economy presented in this paper are only available in nominal basic prices. In order to compare the digital economy to the total economy, GDP in nominal market prices was adjusted for taxes less subsidies on products and imports. This adjustment provides an approximate estimate of GDP in nominal basic prices. Source: Statistics Canada, "Measuring digital economic activities in Canada: Initial estimates", Latest Developments in the Canadian Economic Accounts (13-605-X), special tabulation, 2019. |
|
Output
In 2017, the digital economy produced $207.7 billion of goods and services, an increase of 6.4% from the previous year. This growth was led by increased output of support services (+11.1%), followed by e-commerce (+9.2%).
Of all the provinces and territories, Ontario produced the most digital economy goods and services in 2017, while British Columbia saw the largest increase in digital economy output in 2017. Yukon and the Northwest Territories were the only two jurisdictions where output of the digital economy declined in 2017.
Jobs
In 2017 there were 886,114 jobsNote associated with digital economic activities, representing 4.7% of all jobs in Canada.
This estimate includes all jobs, paid and self-employed, associated with the production of digital economy output. For example, a custodian working in the telecommunications industry is captured in these estimates because they contribute to the output of telecommunications services. A data analyst or computer engineer working in the agriculture industry, however, is not reflected in these job estimates as the agriculture industry does not have any digital output, according to the definition used in this paper.
This proportion of digital economy jobs was smaller than the digital economy share of total GDP and output. Nevertheless, jobs associated with the digital economy (+37.0%) grew three times more than the total economy (+8.6%) between 2010 and 2017.
The largest contributors to digital economy jobs in 2017 were the support services domain (30.2%), followed by e-commerce (18.6%). The hardware domain (6.4%) had the smallest share of digital economy jobs in Canada.
On a regional basis, British Columbia (+49.1%) and Quebec (+41.0%) saw the largest gains in digital economy jobs between 2010 and 2017, while Newfoundland and Labrador (-9.1%) and the Northwest Territories (-3.5%) recorded losses in digital economy jobs over the same time period.
Future improvements
The estimates presented in this paper are an important first step towards measuring digital economic activities in Canada. They provide a working definition of the digital economy, which can be built upon as measurement frameworks progress and new data sources become available.
The methodology used to derive these initial estimates follows the same approach used for other satellite accounts, focusing on the output of certain products to estimate the economic importance of a desired sector. While this approach does provide useful information on, in this case, the digital economy, it comes with certain limitations.
First, as mentioned above, the assumption that an industry’s production function is the same for the production of digital and non-digital output, is not precise. However, a lack of data on the inputs specific to the production of digital output makes it a necessary assumption. The limitations of this assumption are less significant for those industries that primarily produce one type of output, in this case, digital products, as the production function would be more homogenous.
Another limitation of the approach is that it only measures the output, GDP and jobs of industries that produce digital economy goods and services. These initial estimates do not include the uses of digital products in the production process. For example, industries such as health care and agriculture, while users of digital technologies, do not produce digital goods and services. Expanding the estimates to include the uses of digital products would be more provide a more complete picture of the digitalization of the economy. The ability to include more partial digital products would also increase the representativeness of the estimates.
As discussed above, consumption of free media products are not included in initial estimates of the digital economy. As with official measures of GDP, advertising revenue earned by platforms in Canada that distribute free media are included. Income earned from posting creative content should be included according to existing concepts and recommended treatment, although it is difficult to evaluate the extent to which it is fully captured in available measures. Statistics Canada will continue to collaborate with international organizations and national statistics offices to advance concepts and measures in this area.
In addition to free media, data were not measured as a distinct product and/or asset in GDP. Statistics Canada is working jointly with the United States Bureau of Economic Analysis and other international organizations to develop a framework for defining and measuring data within the CMEA.
In order to enhance these initial estimates, as well as ensure that core economic measures, such as GDP, reflect our economic reality, Statistics Canada needs to look beyond traditional data sources. Digitalization is changing the way people interact and how goods and services are produced, delivered and consumed. Changing business models and new technologies mean that products can easily be produced by anyone and purchased from anywhere in the world. Many traditional household and business surveys are not well-suited to measure the globalization or digitalization of consumption, increasing household production or the role of digital intermediary platforms in economic transactions. New data sources, collection and estimation methods, such as crowdsourcing, web scrapping and machine learning, must be exploited so that new and emerging phenomenon related to the digitalization of the economy are captured in our economic and social statistics.
Tables, by province and territory
| 2010 | 2011 | 2012 | 2013 | 2014 | 2015 | 2016 | 2017 | |
|---|---|---|---|---|---|---|---|---|
| thousands of dollars | ||||||||
| Gross domestic product | 78,241,137 | 82,200,478 | 85,516,034 | 93,074,795 | 98,186,598 | 101,475,422 | 105,519,259 | 109,660,277 |
| Digitally-delivered products | 8,586,003 | 9,050,186 | 9,415,068 | 10,846,392 | 11,517,080 | 10,664,434 | 11,202,083 | 11,563,074 |
| E-commerce | 4,284,598 | 4,471,156 | 4,539,987 | 9,345,810 | 10,313,104 | 11,543,788 | 12,807,034 | 13,601,934 |
| Infrastructure - Hardware | 6,333,350 | 6,021,472 | 5,359,931 | 5,289,109 | 5,822,335 | 5,743,070 | 6,127,301 | 6,425,921 |
| Infrastructure - Software | 12,251,200 | 12,915,963 | 13,854,843 | 14,067,015 | 15,309,882 | 16,029,321 | 16,578,163 | 17,440,779 |
| Infrastructure - Support services | 17,939,011 | 19,649,060 | 21,505,328 | 22,694,132 | 24,597,061 | 26,171,741 | 27,488,529 | 29,184,800 |
| Infrastructure - Telecommunications | 28,846,975 | 30,092,641 | 30,840,877 | 30,832,336 | 30,627,137 | 31,323,067 | 31,316,150 | 31,443,768 |
| Output | 140,788,370 | 146,481,255 | 151,341,553 | 165,849,761 | 176,769,864 | 184,630,222 | 195,172,921 | 207,704,048 |
| Digitally-delivered products | 19,325,957 | 19,963,530 | 20,724,420 | 22,985,543 | 23,517,419 | 24,409,604 | 25,804,745 | 27,205,891 |
| E-commerce | 6,936,212 | 7,094,883 | 7,433,489 | 15,553,008 | 17,185,760 | 19,675,675 | 22,458,594 | 24,529,278 |
| Infrastructure - Hardware | 15,956,821 | 15,464,885 | 14,263,469 | 14,007,227 | 16,568,839 | 16,228,816 | 17,725,585 | 18,714,587 |
| Infrastructure - Software | 20,822,804 | 21,670,526 | 22,900,088 | 23,030,973 | 24,930,702 | 26,096,540 | 27,346,218 | 29,477,225 |
| Infrastructure - Support services | 29,831,690 | 32,089,663 | 34,539,355 | 37,568,746 | 40,413,547 | 43,111,149 | 45,763,561 | 50,830,033 |
| Infrastructure - Telecommunications | 47,914,886 | 50,197,768 | 51,480,733 | 52,704,265 | 54,153,596 | 55,108,438 | 56,074,219 | 56,947,034 |
| number of jobs | ||||||||
| Jobs | 646,729 | 664,970 | 678,029 | 765,367 | 781,698 | 811,590 | 852,012 | 886,114 |
| Digitally-delivered products | 88,644 | 91,385 | 93,687 | 115,787 | 116,782 | 124,959 | 134,599 | 135,908 |
| E-commerce | 66,407 | 66,298 | 66,821 | 127,893 | 134,426 | 149,223 | 160,469 | 164,549 |
| Infrastructure - Hardware | 57,361 | 55,515 | 51,349 | 51,823 | 56,179 | 52,962 | 56,439 | 56,995 |
| Infrastructure - Software | 127,401 | 132,242 | 136,212 | 130,213 | 137,494 | 138,658 | 144,017 | 152,170 |
| Infrastructure - Support services | 182,801 | 195,254 | 205,469 | 218,502 | 225,498 | 237,246 | 248,816 | 267,746 |
| Infrastructure - Telecommunications | 124,115 | 124,275 | 124,491 | 121,148 | 111,319 | 108,542 | 107,672 | 108,745 |
|
Note(s): All dollar values are expressed in nominal terms. Canada includes Canadian territorial enclaves abroad (that is, embassies, consulates, military bases, scientific stations, information or immigration offices, aid agency offices, and central bank representative offices with diplomatic immunity). Source: Statistics Canada, "Measuring digital economic activities in Canada: Initial estimates", Latest Developments in the Canadian Economic Accounts (13-605-X), special tabulation, 2019. |
||||||||
| 2010 | 2011 | 2012 | 2013 | 2014 | 2015 | 2016 | 2017 | |
|---|---|---|---|---|---|---|---|---|
| thousands of dollars | ||||||||
| Gross domestic product | 680,925 | 742,362 | 806,711 | 808,589 | 806,387 | 841,214 | 951,300 | 952,222 |
| Digitally-delivered products | 53,734 | 59,514 | 58,346 | 59,719 | 59,963 | 58,065 | 47,981 | 48,227 |
| E-commerce | 38,953 | 35,288 | 33,101 | 45,884 | 62,142 | 56,459 | 71,270 | 56,543 |
| Infrastructure - Hardware | 6,669 | 20,984 | 12,894 | 20,561 | 13,337 | 7,705 | 17,628 | 19,822 |
| Infrastructure - Software | 62,887 | 77,861 | 92,533 | 81,951 | 85,950 | 93,219 | 90,489 | 95,334 |
| Infrastructure - Support services | 73,507 | 81,529 | 71,507 | 61,149 | 61,875 | 79,207 | 81,440 | 87,891 |
| Infrastructure - Telecommunications | 445,175 | 467,186 | 538,331 | 539,327 | 523,120 | 546,559 | 642,493 | 644,406 |
| Output | 1,211,061 | 1,312,668 | 1,332,504 | 1,378,216 | 1,434,903 | 1,513,226 | 1,714,918 | 1,750,989 |
| Digitally-delivered products | 84,996 | 91,463 | 94,066 | 95,663 | 93,200 | 92,290 | 92,121 | 94,308 |
| E-commerce | 65,016 | 60,795 | 57,308 | 72,971 | 99,741 | 90,401 | 125,738 | 102,180 |
| Infrastructure - Hardware | 28,768 | 58,283 | 34,678 | 64,742 | 50,004 | 27,388 | 67,190 | 78,084 |
| Infrastructure - Software | 99,744 | 127,327 | 143,569 | 135,131 | 131,369 | 142,397 | 154,145 | 167,966 |
| Infrastructure - Support services | 105,389 | 122,897 | 103,123 | 89,028 | 86,849 | 112,863 | 126,625 | 143,052 |
| Infrastructure - Telecommunications | 827,147 | 851,903 | 899,760 | 920,681 | 973,740 | 1,047,887 | 1,149,098 | 1,165,400 |
| number of jobs | ||||||||
| Jobs | 4,727 | 4,858 | 4,753 | 4,425 | 4,479 | 4,478 | 4,789 | 4,297 |
| Digitally-delivered products | 596 | 637 | 638 | 613 | 605 | 622 | 626 | 542 |
| E-commerce | 746 | 717 | 706 | 804 | 1,097 | 892 | 1,265 | 892 |
| Infrastructure - Hardware | 67 | 194 | 121 | 176 | 90 | 60 | 110 | 119 |
| Infrastructure - Software | 726 | 828 | 979 | 881 | 805 | 818 | 813 | 773 |
| Infrastructure - Support services | 907 | 871 | 809 | 720 | 656 | 779 | 789 | 770 |
| Infrastructure - Telecommunications | 1,684 | 1,610 | 1,501 | 1,232 | 1,226 | 1,307 | 1,186 | 1,200 |
|
Note: All dollar values are expressed in nominal terms. Source: Statistics Canada, "Measuring digital economic activities in Canada: Initial estimates", Latest Developments in the Canadian Economic Accounts (13-605-X), special tabulation, 2019. |
||||||||
| 2010 | 2011 | 2012 | 2013 | 2014 | 2015 | 2016 | 2017 | |
|---|---|---|---|---|---|---|---|---|
| thousands of dollars | ||||||||
| Gross domestic product | 180,306 | 185,284 | 200,997 | 214,217 | 229,273 | 246,228 | 223,953 | 232,812 |
| Digitally-delivered products | 11,739 | 12,849 | 14,992 | 16,780 | 16,534 | 16,359 | 13,267 | 13,370 |
| E-commerce | 3,467 | 2,964 | 2,437 | 7,077 | 11,535 | 9,555 | 23,102 | 26,344 |
| Infrastructure - Hardware | 7,726 | 3,666 | 4,908 | 6,089 | 5,570 | 5,186 | 5,701 | 6,898 |
| Infrastructure - Software | 30,484 | 31,950 | 31,193 | 32,587 | 37,233 | 43,904 | 34,897 | 35,128 |
| Infrastructure - Support services | 26,092 | 28,699 | 29,295 | 29,940 | 29,888 | 34,878 | 34,310 | 34,858 |
| Infrastructure - Telecommunications | 100,798 | 105,156 | 118,171 | 121,744 | 128,513 | 136,346 | 112,676 | 116,215 |
| Output | 280,596 | 284,971 | 298,250 | 330,539 | 363,983 | 376,215 | 394,501 | 423,701 |
| Digitally-delivered products | 19,132 | 21,096 | 25,036 | 25,973 | 27,121 | 24,190 | 24,212 | 24,776 |
| E-commerce | 6,859 | 5,516 | 4,651 | 26,658 | 43,594 | 36,322 | 38,372 | 46,606 |
| Infrastructure - Hardware | 18,828 | 10,352 | 13,163 | 16,253 | 13,795 | 12,378 | 16,900 | 22,400 |
| Infrastructure - Software | 45,967 | 47,089 | 44,042 | 44,996 | 51,851 | 59,903 | 56,844 | 58,753 |
| Infrastructure - Support services | 40,580 | 44,483 | 43,617 | 45,088 | 46,827 | 53,148 | 56,664 | 61,007 |
| Infrastructure - Telecommunications | 149,231 | 156,435 | 167,741 | 171,571 | 180,795 | 190,274 | 201,510 | 210,159 |
| number of jobs | ||||||||
| Jobs | 1,387 | 1,403 | 1,608 | 1,635 | 1,710 | 1,771 | 1,678 | 1,876 |
| Digitally-delivered products | 138 | 155 | 189 | 220 | 205 | 195 | 188 | 174 |
| E-commerce | 82 | 66 | 60 | 150 | 218 | 195 | 194 | 279 |
| Infrastructure - Hardware | 144 | 80 | 95 | 120 | 90 | 85 | 105 | 150 |
| Infrastructure - Software | 402 | 425 | 440 | 417 | 473 | 559 | 523 | 554 |
| Infrastructure - Support services | 355 | 423 | 495 | 459 | 489 | 515 | 490 | 508 |
| Infrastructure - Telecommunications | 265 | 255 | 329 | 269 | 235 | 222 | 178 | 212 |
|
Note: All dollar values are expressed in nominal terms. Source: Statistics Canada, "Measuring digital economic activities in Canada: Initial estimates", Latest Developments in the Canadian Economic Accounts (13-605-X), special tabulation, 2019. |
||||||||
| 2010 | 2011 | 2012 | 2013 | 2014 | 2015 | 2016 | 2017 | |
|---|---|---|---|---|---|---|---|---|
| thousands of dollars | ||||||||
| Gross domestic product | 1,482,910 | 1,499,622 | 1,597,063 | 1,633,559 | 1,704,047 | 1,835,856 | 1,736,274 | 1,768,496 |
| Digitally-delivered products | 124,073 | 118,644 | 130,704 | 159,003 | 144,039 | 143,802 | 141,603 | 139,456 |
| E-commerce | 102,294 | 97,686 | 104,175 | 116,786 | 127,568 | 138,089 | 149,982 | 147,870 |
| Infrastructure - Hardware | 55,128 | 50,313 | 22,082 | 45,916 | 45,782 | 39,862 | 42,582 | 43,360 |
| Infrastructure - Software | 172,469 | 152,816 | 185,130 | 172,526 | 201,862 | 211,282 | 211,776 | 223,624 |
| Infrastructure - Support services | 260,813 | 265,597 | 268,865 | 227,431 | 268,792 | 375,063 | 388,359 | 422,357 |
| Infrastructure - Telecommunications | 768,132 | 814,565 | 886,107 | 911,898 | 916,004 | 927,759 | 801,971 | 791,829 |
| Output | 2,454,752 | 2,424,970 | 2,484,985 | 2,590,164 | 2,707,110 | 2,943,517 | 3,110,623 | 3,244,191 |
| Digitally-delivered products | 269,437 | 258,412 | 279,667 | 313,926 | 282,800 | 297,986 | 291,948 | 295,125 |
| E-commerce | 154,134 | 162,102 | 161,612 | 188,143 | 199,433 | 218,328 | 255,574 | 260,618 |
| Infrastructure - Hardware | 160,034 | 156,097 | 62,051 | 134,342 | 125,912 | 109,745 | 133,925 | 141,490 |
| Infrastructure - Software | 289,114 | 255,009 | 307,379 | 278,193 | 324,162 | 340,968 | 352,824 | 383,723 |
| Infrastructure - Support services | 414,470 | 410,415 | 407,108 | 360,583 | 415,804 | 593,511 | 642,086 | 731,299 |
| Infrastructure - Telecommunications | 1,167,562 | 1,182,935 | 1,267,169 | 1,314,977 | 1,358,999 | 1,382,979 | 1,434,265 | 1,431,937 |
| number of jobs | ||||||||
| Jobs | 13,248 | 14,004 | 14,007 | 15,102 | 14,591 | 15,484 | 16,116 | 16,632 |
| Digitally-delivered products | 1,756 | 1,657 | 1,722 | 2,329 | 2,214 | 2,389 | 2,528 | 2,561 |
| E-commerce | 2,197 | 2,162 | 2,332 | 2,426 | 2,409 | 2,628 | 2,760 | 2,700 |
| Infrastructure - Hardware | 928 | 869 | 384 | 743 | 534 | 554 | 676 | 729 |
| Infrastructure - Software | 2,220 | 2,110 | 2,527 | 2,378 | 2,651 | 2,437 | 2,542 | 2,656 |
| Infrastructure - Support services | 2,994 | 3,353 | 3,362 | 3,255 | 3,574 | 4,578 | 5,013 | 5,399 |
| Infrastructure - Telecommunications | 3,153 | 3,854 | 3,679 | 3,970 | 3,209 | 2,897 | 2,597 | 2,587 |
|
Note: All dollar values are expressed in nominal terms. Source: Statistics Canada, "Measuring digital economic activities in Canada: Initial estimates", Latest Developments in the Canadian Economic Accounts (13-605-X), special tabulation, 2019. |
||||||||
| 2010 | 2011 | 2012 | 2013 | 2014 | 2015 | 2016 | 2017 | |
|---|---|---|---|---|---|---|---|---|
| thousands of dollars | ||||||||
| Gross domestic product | 1,025,930 | 1,115,184 | 1,146,066 | 1,232,750 | 1,274,031 | 1,297,203 | 1,239,243 | 1,249,876 |
| Digitally-delivered products | 71,267 | 67,963 | 75,272 | 83,002 | 83,978 | 82,993 | 80,828 | 80,598 |
| E-commerce | 37,524 | 49,421 | 48,499 | 102,080 | 125,206 | 133,948 | 108,305 | 127,065 |
| Infrastructure - Hardware | 19,373 | 19,882 | 13,748 | 22,775 | 23,946 | 26,443 | 47,348 | 62,314 |
| Infrastructure - Software | 146,817 | 137,799 | 145,004 | 135,018 | 148,410 | 164,696 | 160,482 | 153,183 |
| Infrastructure - Support services | 203,533 | 244,908 | 243,969 | 251,753 | 250,476 | 255,363 | 255,031 | 237,071 |
| Infrastructure - Telecommunications | 547,415 | 595,210 | 619,575 | 638,122 | 642,014 | 633,760 | 587,249 | 589,644 |
| Output | 1,706,455 | 1,808,173 | 1,836,939 | 1,930,895 | 2,054,761 | 2,084,279 | 2,265,936 | 2,369,443 |
| Digitally-delivered products | 126,795 | 119,093 | 128,702 | 137,195 | 147,749 | 147,772 | 141,187 | 141,114 |
| E-commerce | 60,171 | 69,211 | 74,928 | 165,453 | 202,047 | 202,506 | 188,654 | 232,760 |
| Infrastructure - Hardware | 64,473 | 68,698 | 36,626 | 72,700 | 80,821 | 80,220 | 174,903 | 239,645 |
| Infrastructure - Software | 260,663 | 239,994 | 248,625 | 208,045 | 242,234 | 262,446 | 291,393 | 286,767 |
| Infrastructure - Support services | 327,594 | 386,300 | 376,707 | 353,129 | 364,363 | 376,420 | 419,306 | 402,583 |
| Infrastructure - Telecommunications | 866,760 | 924,876 | 971,352 | 994,373 | 1,017,546 | 1,014,916 | 1,050,493 | 1,066,576 |
| number of jobs | ||||||||
| Jobs | 8,630 | 9,444 | 9,195 | 10,732 | 10,921 | 10,565 | 10,108 | 10,570 |
| Digitally-delivered products | 932 | 853 | 967 | 1,144 | 1,082 | 1,028 | 968 | 931 |
| E-commerce | 588 | 825 | 813 | 1,756 | 1,997 | 1,892 | 1,669 | 1,849 |
| Infrastructure - Hardware | 356 | 341 | 198 | 379 | 372 | 346 | 683 | 860 |
| Infrastructure - Software | 1,713 | 1,699 | 1,748 | 1,566 | 1,795 | 1,787 | 1,793 | 1,824 |
| Infrastructure - Support services | 2,410 | 2,949 | 2,839 | 2,979 | 2,956 | 2,842 | 3,006 | 3,083 |
| Infrastructure - Telecommunications | 2,632 | 2,776 | 2,630 | 2,907 | 2,719 | 2,670 | 1,990 | 2,024 |
|
Note: All dollar values are expressed in nominal terms. Source: Statistics Canada, "Measuring digital economic activities in Canada: Initial estimates", Latest Developments in the Canadian Economic Accounts (13-605-X), special tabulation, 2019. |
||||||||
| 2010 | 2011 | 2012 | 2013 | 2014 | 2015 | 2016 | 2017 | |
|---|---|---|---|---|---|---|---|---|
| thousands of dollars | ||||||||
| Gross domestic product | 15,888,980 | 16,884,334 | 17,673,976 | 19,735,681 | 20,636,592 | 20,649,717 | 21,171,041 | 21,733,633 |
| Digitally-delivered products | 1,655,290 | 1,648,881 | 1,758,300 | 1,937,774 | 1,978,689 | 1,831,133 | 1,996,259 | 1,923,370 |
| E-commerce | 663,204 | 557,818 | 546,961 | 1,677,652 | 1,937,189 | 2,149,895 | 2,287,149 | 2,239,669 |
| Infrastructure - Hardware | 1,599,006 | 1,743,001 | 1,590,207 | 1,723,150 | 2,041,119 | 1,804,357 | 1,671,040 | 1,819,352 |
| Infrastructure - Software | 2,798,304 | 3,022,881 | 3,210,465 | 3,191,790 | 3,460,433 | 3,407,135 | 3,334,955 | 3,534,911 |
| Infrastructure - Support services | 3,672,806 | 4,026,593 | 4,638,063 | 5,454,187 | 5,868,405 | 5,697,425 | 5,865,071 | 6,267,290 |
| Infrastructure - Telecommunications | 5,500,369 | 5,885,160 | 5,929,979 | 5,751,128 | 5,350,758 | 5,759,771 | 6,016,567 | 5,949,041 |
| Output | 29,246,333 | 31,074,818 | 32,320,522 | 36,526,356 | 37,886,062 | 38,489,795 | 39,719,968 | 41,725,193 |
| Digitally-delivered products | 3,633,183 | 3,738,583 | 3,975,335 | 4,487,943 | 4,370,963 | 4,644,764 | 4,765,159 | 4,651,973 |
| E-commerce | 1,167,431 | 987,374 | 1,086,648 | 2,892,518 | 3,286,674 | 3,689,500 | 4,042,574 | 4,077,020 |
| Infrastructure - Hardware | 4,066,895 | 4,320,103 | 4,042,444 | 4,537,071 | 5,148,385 | 4,626,308 | 4,785,149 | 5,171,849 |
| Infrastructure - Software | 4,678,699 | 4,969,857 | 5,198,373 | 5,181,305 | 5,472,786 | 5,479,259 | 5,607,598 | 6,100,991 |
| Infrastructure - Support services | 6,025,485 | 6,414,865 | 7,332,090 | 8,729,409 | 9,076,528 | 9,231,631 | 9,758,076 | 10,963,898 |
| Infrastructure - Telecommunications | 9,674,639 | 10,644,036 | 10,685,632 | 10,698,110 | 10,530,726 | 10,818,333 | 10,761,412 | 10,759,462 |
| number of jobs | ||||||||
| Jobs | 145,775 | 150,944 | 158,198 | 175,623 | 181,340 | 184,365 | 198,460 | 205,496 |
| Digitally-delivered products | 20,622 | 19,635 | 20,818 | 25,190 | 26,199 | 26,968 | 31,332 | 31,998 |
| E-commerce | 13,021 | 11,738 | 12,144 | 27,036 | 28,412 | 30,585 | 32,423 | 31,411 |
| Infrastructure - Hardware | 15,984 | 17,087 | 16,316 | 18,023 | 20,420 | 17,752 | 18,540 | 18,437 |
| Infrastructure - Software | 30,112 | 33,048 | 33,754 | 30,669 | 32,390 | 32,162 | 34,006 | 36,075 |
| Infrastructure - Support services | 38,851 | 42,434 | 47,927 | 51,952 | 54,147 | 57,016 | 60,116 | 65,432 |
| Infrastructure - Telecommunications | 27,186 | 27,002 | 27,240 | 22,754 | 19,771 | 19,881 | 22,043 | 22,143 |
|
Note: All dollar values are expressed in nominal terms. Source: Statistics Canada, "Measuring digital economic activities in Canada: Initial estimates", Latest Developments in the Canadian Economic Accounts (13-605-X), special tabulation, 2019. |
||||||||
| 2010 | 2011 | 2012 | 2013 | 2014 | 2015 | 2016 | 2017 | |
|---|---|---|---|---|---|---|---|---|
| thousands of dollars | ||||||||
| Gross domestic product | 37,060,410 | 38,834,921 | 40,042,978 | 43,232,419 | 45,465,840 | 47,723,639 | 51,722,483 | 54,408,617 |
| Digitally-delivered products | 4,683,622 | 4,873,529 | 5,060,456 | 5,990,060 | 6,299,832 | 5,792,106 | 6,013,868 | 6,225,957 |
| E-commerce | 2,080,655 | 2,539,573 | 2,536,539 | 4,625,308 | 4,977,309 | 5,551,813 | 6,410,427 | 7,073,897 |
| Infrastructure - Hardware | 3,781,728 | 3,362,900 | 2,891,706 | 2,620,336 | 2,782,562 | 2,789,606 | 3,263,854 | 3,334,586 |
| Infrastructure - Software | 5,767,974 | 6,058,373 | 6,388,069 | 6,579,579 | 7,060,705 | 7,862,039 | 8,495,256 | 9,054,930 |
| Infrastructure - Support services | 9,334,513 | 10,277,726 | 11,143,292 | 11,554,826 | 12,309,416 | 13,469,520 | 14,631,374 | 15,600,645 |
| Infrastructure - Telecommunications | 11,411,917 | 11,722,821 | 12,022,916 | 11,862,310 | 12,036,017 | 12,258,555 | 12,907,705 | 13,118,602 |
| Output | 69,909,617 | 72,303,810 | 74,010,378 | 80,082,945 | 85,077,974 | 89,681,333 | 95,944,862 | 103,043,925 |
| Digitally-delivered products | 11,017,902 | 11,335,574 | 11,686,625 | 12,827,609 | 13,084,022 | 13,172,442 | 13,898,090 | 14,564,130 |
| E-commerce | 3,307,734 | 3,812,389 | 3,912,291 | 7,718,636 | 8,286,592 | 9,579,787 | 11,284,279 | 12,753,159 |
| Infrastructure - Hardware | 9,149,725 | 8,516,910 | 7,763,737 | 6,854,361 | 8,572,662 | 8,417,919 | 9,365,000 | 9,644,155 |
| Infrastructure - Software | 9,987,784 | 10,354,281 | 10,709,968 | 10,902,389 | 11,733,284 | 12,931,128 | 13,843,883 | 15,092,529 |
| Infrastructure - Support services | 15,817,908 | 17,103,984 | 18,200,031 | 19,717,937 | 21,002,959 | 22,821,394 | 24,408,120 | 27,188,821 |
| Infrastructure - Telecommunications | 20,628,563 | 21,180,672 | 21,737,727 | 22,062,012 | 22,398,456 | 22,758,663 | 23,145,490 | 23,801,131 |
| number of jobs | ||||||||
| Jobs | 304,402 | 314,646 | 317,366 | 361,468 | 365,682 | 378,900 | 398,973 | 416,464 |
| Digitally-delivered products | 40,432 | 41,943 | 43,601 | 56,332 | 52,980 | 57,626 | 61,510 | 61,911 |
| E-commerce | 28,915 | 31,042 | 31,115 | 58,597 | 61,476 | 67,679 | 73,254 | 77,268 |
| Infrastructure - Hardware | 30,958 | 28,372 | 26,282 | 24,422 | 26,056 | 24,914 | 26,753 | 27,181 |
| Infrastructure - Software | 58,058 | 59,767 | 61,284 | 59,710 | 62,804 | 64,620 | 67,458 | 71,886 |
| Infrastructure - Support services | 89,819 | 96,722 | 101,229 | 108,653 | 110,067 | 115,860 | 122,338 | 132,279 |
| Infrastructure - Telecommunications | 56,220 | 56,799 | 53,854 | 53,753 | 52,300 | 48,200 | 47,662 | 45,939 |
|
Note: All dollar values are expressed in nominal terms. Source: Statistics Canada, "Measuring digital economic activities in Canada: Initial estimates", Latest Developments in the Canadian Economic Accounts (13-605-X), special tabulation, 2019. |
||||||||
| 2010 | 2011 | 2012 | 2013 | 2014 | 2015 | 2016 | 2017 | |
|---|---|---|---|---|---|---|---|---|
| thousands of dollars | ||||||||
| Gross domestic product | 1,809,548 | 1,908,449 | 2,031,377 | 2,247,575 | 2,309,877 | 2,343,864 | 2,098,268 | 2,187,943 |
| Digitally-delivered products | 203,626 | 200,264 | 202,133 | 216,342 | 228,108 | 241,926 | 236,479 | 231,712 |
| E-commerce | 129,631 | 101,818 | 98,280 | 205,313 | 229,281 | 252,187 | 272,236 | 301,612 |
| Infrastructure - Hardware | 20,927 | 30,636 | 27,893 | 101,586 | 111,666 | 114,267 | 106,987 | 115,174 |
| Infrastructure - Software | 206,571 | 221,061 | 245,795 | 206,951 | 218,958 | 203,637 | 191,993 | 199,942 |
| Infrastructure - Support services | 279,445 | 299,620 | 328,357 | 323,040 | 338,967 | 343,732 | 302,619 | 323,264 |
| Infrastructure - Telecommunications | 969,347 | 1,055,051 | 1,128,919 | 1,194,341 | 1,182,898 | 1,188,116 | 987,955 | 1,016,240 |
| Output | 2,928,066 | 3,088,626 | 3,193,114 | 3,532,265 | 3,729,154 | 3,812,092 | 3,908,060 | 4,159,029 |
| Digitally-delivered products | 443,393 | 440,000 | 453,415 | 485,683 | 509,311 | 546,374 | 519,394 | 521,527 |
| E-commerce | 214,103 | 180,248 | 172,058 | 347,926 | 389,058 | 424,656 | 479,754 | 558,693 |
| Infrastructure - Hardware | 78,582 | 111,097 | 94,509 | 218,286 | 284,281 | 324,875 | 313,765 | 336,849 |
| Infrastructure - Software | 346,757 | 369,566 | 398,619 | 334,780 | 352,291 | 320,808 | 332,979 | 351,599 |
| Infrastructure - Support services | 448,586 | 476,262 | 498,958 | 491,378 | 519,156 | 502,606 | 495,191 | 552,491 |
| Infrastructure - Telecommunications | 1,396,645 | 1,511,453 | 1,575,555 | 1,654,213 | 1,675,057 | 1,692,773 | 1,766,977 | 1,837,870 |
| number of jobs | ||||||||
| Jobs | 13,316 | 13,583 | 14,010 | 15,807 | 16,098 | 16,287 | 16,159 | 16,642 |
| Digitally-delivered products | 1,923 | 1,880 | 1,973 | 2,337 | 2,284 | 2,713 | 2,699 | 2,701 |
| E-commerce | 1,478 | 1,460 | 1,617 | 3,072 | 3,417 | 3,690 | 3,963 | 4,031 |
| Infrastructure - Hardware | 335 | 454 | 377 | 802 | 996 | 1,011 | 899 | 621 |
| Infrastructure - Software | 2,503 | 2,477 | 2,666 | 2,310 | 2,395 | 2,158 | 2,084 | 2,182 |
| Infrastructure - Support services | 3,496 | 3,603 | 3,609 | 3,486 | 3,598 | 3,478 | 3,464 | 3,702 |
| Infrastructure - Telecommunications | 3,581 | 3,710 | 3,769 | 3,800 | 3,409 | 3,237 | 3,049 | 3,404 |
|
Note: All dollar values are expressed in nominal terms. Source: Statistics Canada, "Measuring digital economic activities in Canada: Initial estimates", Latest Developments in the Canadian Economic Accounts (13-605-X), special tabulation, 2019. |
||||||||
| 2010 | 2011 | 2012 | 2013 | 2014 | 2015 | 2016 | 2017 | |
|---|---|---|---|---|---|---|---|---|
| thousands of dollars | ||||||||
| Gross domestic product | 1,425,038 | 1,496,562 | 1,662,702 | 1,788,698 | 1,854,567 | 1,893,899 | 1,916,234 | 1,879,829 |
| Digitally-delivered products | 128,409 | 136,727 | 155,592 | 185,634 | 172,294 | 175,150 | 167,987 | 166,396 |
| E-commerce | 90,309 | 106,636 | 104,843 | 191,817 | 199,230 | 187,364 | 197,064 | 188,108 |
| Infrastructure - Hardware | 82,352 | 66,551 | 78,002 | 75,276 | 82,627 | 125,503 | 126,238 | 118,315 |
| Infrastructure - Software | 119,600 | 109,238 | 141,759 | 137,827 | 146,776 | 160,784 | 159,894 | 166,363 |
| Infrastructure - Support services | 233,014 | 314,839 | 340,118 | 323,787 | 375,482 | 359,022 | 354,544 | 379,584 |
| Infrastructure - Telecommunications | 771,354 | 762,571 | 842,389 | 874,356 | 878,158 | 886,075 | 910,507 | 861,062 |
| Output | 2,450,018 | 2,561,180 | 2,879,605 | 3,068,425 | 3,223,211 | 3,309,704 | 3,503,910 | 3,514,797 |
| Digitally-delivered products | 273,983 | 259,232 | 299,450 | 341,574 | 317,228 | 322,335 | 324,992 | 328,416 |
| E-commerce | 133,978 | 160,476 | 165,540 | 294,058 | 314,910 | 301,278 | 341,367 | 337,404 |
| Infrastructure - Hardware | 250,957 | 217,957 | 258,883 | 242,811 | 225,746 | 304,676 | 353,825 | 349,409 |
| Infrastructure - Software | 196,515 | 177,415 | 225,772 | 218,739 | 231,480 | 252,306 | 263,927 | 280,025 |
| Infrastructure - Support services | 357,768 | 494,070 | 515,011 | 492,819 | 589,450 | 545,362 | 587,869 | 658,787 |
| Infrastructure - Telecommunications | 1,236,818 | 1,252,029 | 1,414,948 | 1,478,423 | 1,544,397 | 1,583,746 | 1,631,932 | 1,560,757 |
| number of jobs | ||||||||
| Jobs | 12,680 | 12,936 | 14,429 | 15,954 | 16,094 | 16,114 | 16,090 | 16,244 |
| Digitally-delivered products | 1,734 | 1,774 | 2,043 | 2,577 | 2,465 | 2,216 | 2,151 | 2,171 |
| E-commerce | 1,357 | 1,418 | 1,488 | 2,353 | 2,449 | 2,368 | 2,488 | 2,340 |
| Infrastructure - Hardware | 838 | 684 | 720 | 750 | 769 | 1,140 | 1,185 | 1,250 |
| Infrastructure - Software | 1,444 | 1,217 | 1,581 | 1,431 | 1,491 | 1,530 | 1,520 | 1,587 |
| Infrastructure - Support services | 2,568 | 2,920 | 3,508 | 3,520 | 3,782 | 3,709 | 3,739 | 3,882 |
| Infrastructure - Telecommunications | 4,738 | 4,922 | 5,089 | 5,323 | 5,137 | 5,152 | 5,008 | 5,013 |
|
Note: All dollar values are expressed in nominal terms. Source: Statistics Canada, "Measuring digital economic activities in Canada: Initial estimates", Latest Developments in the Canadian Economic Accounts (13-605-X), special tabulation, 2019. |
||||||||
| 2010 | 2011 | 2012 | 2013 | 2014 | 2015 | 2016 | 2017 | |
|---|---|---|---|---|---|---|---|---|
| thousands of dollars | ||||||||
| Gross domestic product | 9,156,158 | 9,768,897 | 10,030,036 | 11,015,001 | 11,869,427 | 11,797,867 | 11,266,294 | 11,370,882 |
| Digitally-delivered products | 810,988 | 839,053 | 828,087 | 980,810 | 927,101 | 985,909 | 1,012,384 | 1,016,098 |
| E-commerce | 460,211 | 435,660 | 452,116 | 1,080,327 | 1,125,816 | 1,187,488 | 1,506,769 | 1,525,068 |
| Infrastructure - Hardware | 302,423 | 284,050 | 245,123 | 254,159 | 262,479 | 332,936 | 297,674 | 334,148 |
| Infrastructure - Software | 1,283,656 | 1,382,064 | 1,594,946 | 1,671,411 | 1,866,959 | 1,704,447 | 1,502,184 | 1,524,267 |
| Infrastructure - Support services | 2,058,933 | 2,238,412 | 2,402,851 | 2,310,415 | 2,701,586 | 2,806,869 | 2,625,881 | 2,633,642 |
| Infrastructure - Telecommunications | 4,239,947 | 4,589,658 | 4,506,913 | 4,717,880 | 4,985,486 | 4,780,219 | 4,321,403 | 4,337,660 |
| Output | 14,622,070 | 15,424,279 | 15,989,671 | 17,453,110 | 19,355,616 | 19,640,698 | 20,034,981 | 20,775,191 |
| Digitally-delivered products | 1,550,837 | 1,537,082 | 1,608,417 | 1,876,762 | 1,825,005 | 2,030,884 | 2,019,464 | 2,061,525 |
| E-commerce | 710,182 | 743,497 | 795,048 | 1,713,443 | 1,859,298 | 2,020,611 | 2,590,263 | 2,729,234 |
| Infrastructure - Hardware | 823,369 | 792,644 | 652,530 | 702,764 | 736,888 | 875,677 | 868,625 | 992,354 |
| Infrastructure - Software | 2,159,077 | 2,309,492 | 2,636,886 | 2,637,221 | 2,903,977 | 2,688,293 | 2,458,716 | 2,556,822 |
| Infrastructure - Support services | 3,352,087 | 3,621,185 | 3,848,150 | 3,638,242 | 4,314,099 | 4,457,677 | 4,368,628 | 4,590,271 |
| Infrastructure - Telecommunications | 6,026,518 | 6,420,379 | 6,448,641 | 6,884,677 | 7,716,349 | 7,567,556 | 7,729,285 | 7,844,984 |
| number of jobs | ||||||||
| Jobs | 57,720 | 57,558 | 58,438 | 65,174 | 67,722 | 70,849 | 72,697 | 73,237 |
| Digitally-delivered products | 7,021 | 7,420 | 7,382 | 8,503 | 7,855 | 8,941 | 9,113 | 8,771 |
| E-commerce | 6,036 | 6,005 | 5,840 | 11,946 | 13,040 | 14,042 | 17,230 | 17,074 |
| Infrastructure - Hardware | 3,146 | 2,946 | 2,349 | 2,571 | 2,332 | 2,562 | 2,715 | 2,833 |
| Infrastructure - Software | 11,175 | 11,599 | 12,334 | 12,161 | 13,470 | 12,339 | 11,928 | 11,959 |
| Infrastructure - Support services | 19,022 | 19,109 | 19,346 | 19,357 | 22,010 | 22,497 | 21,901 | 22,695 |
| Infrastructure - Telecommunications | 11,319 | 10,478 | 11,187 | 10,636 | 9,014 | 10,467 | 9,811 | 9,905 |
|
Note: All dollar values are expressed in nominal terms. Source: Statistics Canada, "Measuring digital economic activities in Canada: Initial estimates", Latest Developments in the Canadian Economic Accounts (13-605-X), special tabulation, 2019. |
||||||||
| 2010 | 2011 | 2012 | 2013 | 2014 | 2015 | 2016 | 2017 | |
|---|---|---|---|---|---|---|---|---|
| thousands of dollars | ||||||||
| Gross domestic product | 9,344,902 | 9,563,085 | 10,113,578 | 10,920,813 | 11,787,173 | 12,599,339 | 12,974,861 | 13,660,612 |
| Digitally-delivered products | 844,105 | 1,093,935 | 1,134,846 | 1,216,288 | 1,606,112 | 1,334,167 | 1,478,750 | 1,705,083 |
| E-commerce | 674,227 | 540,446 | 607,882 | 1,289,389 | 1,511,679 | 1,867,741 | 1,767,549 | 1,903,040 |
| Infrastructure - Hardware | 452,149 | 435,879 | 469,656 | 415,511 | 447,794 | 485,390 | 530,610 | 558,390 |
| Infrastructure - Software | 1,652,294 | 1,717,215 | 1,816,468 | 1,844,046 | 2,076,952 | 2,169,568 | 2,379,690 | 2,435,934 |
| Infrastructure - Support services | 1,769,366 | 1,844,467 | 1,999,966 | 2,127,307 | 2,360,910 | 2,721,623 | 2,943,151 | 3,191,227 |
| Infrastructure - Telecommunications | 3,952,761 | 3,931,142 | 4,084,761 | 4,028,272 | 3,783,725 | 4,020,851 | 3,875,110 | 3,866,938 |
| Output | 15,676,011 | 15,891,557 | 16,679,510 | 18,588,113 | 20,550,020 | 22,381,030 | 24,141,812 | 26,272,927 |
| Digitally-delivered products | 1,886,197 | 2,144,252 | 2,154,260 | 2,370,594 | 2,837,164 | 3,108,339 | 3,704,388 | 4,498,661 |
| E-commerce | 1,109,383 | 905,379 | 994,500 | 2,117,523 | 2,486,586 | 3,090,391 | 3,089,627 | 3,408,999 |
| Infrastructure - Hardware | 1,290,418 | 1,199,710 | 1,291,030 | 1,143,811 | 1,302,375 | 1,402,124 | 1,577,904 | 1,683,854 |
| Infrastructure - Software | 2,733,390 | 2,796,376 | 2,961,274 | 3,068,040 | 3,459,633 | 3,592,022 | 3,949,421 | 4,162,207 |
| Infrastructure - Support services | 2,908,768 | 2,989,667 | 3,187,193 | 3,634,092 | 3,984,354 | 4,403,985 | 4,889,540 | 5,525,631 |
| Infrastructure - Telecommunications | 5,747,855 | 5,856,173 | 6,091,253 | 6,254,052 | 6,479,908 | 6,784,169 | 6,930,932 | 6,993,575 |
| number of jobs | ||||||||
| Jobs | 82,870 | 83,041 | 84,295 | 98,246 | 102,734 | 111,702 | 116,004 | 123,543 |
| Digitally-delivered products | 13,382 | 15,276 | 14,256 | 16,340 | 20,718 | 21,935 | 23,071 | 23,644 |
| E-commerce | 11,630 | 9,990 | 10,122 | 19,703 | 21,030 | 26,401 | 26,667 | 27,794 |
| Infrastructure - Hardware | 4,591 | 4,397 | 4,653 | 3,883 | 4,310 | 4,402 | 4,754 | 4,921 |
| Infrastructure - Software | 19,314 | 19,312 | 19,368 | 18,830 | 19,517 | 19,734 | 20,778 | 22,077 |
| Infrastructure - Support services | 21,360 | 22,063 | 21,514 | 23,765 | 23,795 | 25,645 | 27,564 | 29,712 |
| Infrastructure - Telecommunications | 12,593 | 12,003 | 14,382 | 15,726 | 13,364 | 13,585 | 13,170 | 15,395 |
|
Note: All dollar values are expressed in nominal terms. Source: Statistics Canada, "Measuring digital economic activities in Canada: Initial estimates", Latest Developments in the Canadian Economic Accounts (13-605-X), special tabulation, 2019. |
||||||||
| 2010 | 2011 | 2012 | 2013 | 2014 | 2015 | 2016 | 2017 | |
|---|---|---|---|---|---|---|---|---|
| thousands of dollars | ||||||||
| Gross domestic product | 66,354 | 69,321 | 69,396 | 82,491 | 87,450 | 78,569 | 80,483 | 79,543 |
| Digitally-delivered products | 2,431 | 2,263 | 2,616 | 3,519 | 4,419 | 5,248 | 4,978 | 5,015 |
| E-commerce | 1,324 | 1,585 | 1,783 | 2,788 | 2,831 | 3,075 | 3,967 | 4,036 |
| Infrastructure - Hardware | 1,787 | 1,261 | 1,171 | 1,826 | 3,305 | 4,217 | 4,874 | 3,235 |
| Infrastructure - Software | 6,224 | 5,628 | 5,811 | 4,174 | 4,444 | 4,596 | 4,826 | 4,957 |
| Infrastructure - Support services | 10,395 | 5,194 | 5,779 | 4,998 | 3,995 | 3,875 | 3,457 | 3,916 |
| Infrastructure - Telecommunications | 44,194 | 53,391 | 52,235 | 65,186 | 68,456 | 57,558 | 58,382 | 58,385 |
| Output | 117,898 | 110,808 | 112,223 | 138,304 | 152,803 | 148,123 | 156,002 | 153,288 |
| Digitally-delivered products | 6,640 | 4,937 | 5,758 | 7,214 | 8,260 | 8,735 | 10,486 | 10,729 |
| E-commerce | 2,255 | 2,612 | 2,973 | 4,606 | 4,657 | 4,984 | 6,686 | 7,136 |
| Infrastructure - Hardware | 9,436 | 6,329 | 5,492 | 8,457 | 15,342 | 19,243 | 18,900 | 13,000 |
| Infrastructure - Software | 10,185 | 8,980 | 8,942 | 6,460 | 7,247 | 7,700 | 9,838 | 10,237 |
| Infrastructure - Support services | 16,137 | 7,872 | 9,227 | 7,021 | 6,182 | 5,880 | 5,656 | 6,577 |
| Infrastructure - Telecommunications | 73,245 | 80,078 | 79,831 | 104,547 | 111,115 | 101,582 | 104,436 | 105,610 |
| number of jobs | ||||||||
| Jobs | 639 | 558 | 564 | 552 | 589 | 602 | 677 | 703 |
| Digitally-delivered products | 70 | 65 | 55 | 60 | 71 | 95 | 128 | 123 |
| E-commerce | 21 | 21 | 38 | 50 | 48 | 46 | 54 | 57 |
| Infrastructure - Hardware | 20 | 19 | 15 | 25 | 40 | 50 | 45 | 25 |
| Infrastructure - Software | 76 | 63 | 57 | 49 | 54 | 53 | 58 | 58 |
| Infrastructure - Support services | 130 | 56 | 74 | 71 | 67 | 55 | 61 | 69 |
| Infrastructure - Telecommunications | 320 | 334 | 324 | 297 | 309 | 303 | 332 | 372 |
|
Note: All dollar values are expressed in nominal terms. Source: Statistics Canada, "Measuring digital economic activities in Canada: Initial estimates", Latest Developments in the Canadian Economic Accounts (13-605-X), special tabulation, 2019. |
||||||||
| 2010 | 2011 | 2012 | 2013 | 2014 | 2015 | 2016 | 2017 | |
|---|---|---|---|---|---|---|---|---|
| thousands of dollars | ||||||||
| Gross domestic product | 86,631 | 89,352 | 92,687 | 111,872 | 110,041 | 117,291 | 100,320 | 96,736 |
| Digitally-delivered products | 6,495 | 6,665 | 6,689 | 7,961 | 6,424 | 5,799 | 6,087 | 6,095 |
| E-commerce | 2,577 | 2,617 | 2,670 | 6,393 | 7,224 | 9,536 | 7,781 | 7,261 |
| Infrastructure - Hardware | 4,141 | 1,879 | 1,076 | 2,952 | 3,102 | 7,162 | 11,398 | 9,009 |
| Infrastructure - Software | 6,096 | 6,048 | 6,675 | 6,219 | 7,145 | 6,296 | 6,931 | 7,211 |
| Infrastructure - Support services | 9,468 | 9,639 | 10,092 | 3,211 | 2,279 | 1,892 | 2,052 | 1,820 |
| Infrastructure - Telecommunications | 57,854 | 62,504 | 65,485 | 85,135 | 83,866 | 86,606 | 66,071 | 65,340 |
| Output | 135,887 | 136,348 | 136,743 | 165,878 | 165,688 | 183,137 | 202,917 | 195,033 |
| Digitally-delivered products | 10,916 | 11,320 | 10,842 | 12,553 | 10,987 | 10,274 | 10,390 | 10,522 |
| E-commerce | 3,988 | 4,019 | 4,124 | 9,304 | 10,431 | 14,283 | 13,181 | 12,912 |
| Infrastructure - Hardware | 13,521 | 6,152 | 3,990 | 11,613 | 12,437 | 27,494 | 44,200 | 36,199 |
| Infrastructure - Software | 10,890 | 11,011 | 12,376 | 11,392 | 13,236 | 11,473 | 13,368 | 13,850 |
| Infrastructure - Support services | 13,685 | 14,975 | 14,696 | 4,849 | 3,666 | 3,168 | 3,587 | 3,359 |
| Infrastructure - Telecommunications | 82,887 | 88,870 | 90,715 | 116,167 | 114,932 | 116,446 | 118,191 | 118,191 |
| number of jobs | ||||||||
| Jobs | 475 | 470 | 468 | 476 | 450 | 479 | 484 | 459 |
| Digitally-delivered products | 66 | 64 | 73 | 94 | 76 | 77 | 80 | 71 |
| E-commerce | 44 | 53 | 44 | 79 | 75 | 99 | 96 | 85 |
| Infrastructure - Hardware | 25 | 15 | 10 | 20 | 20 | 35 | 60 | 70 |
| Infrastructure - Software | 50 | 49 | 56 | 52 | 58 | 50 | 51 | 47 |
| Infrastructure - Support services | 77 | 59 | 63 | 26 | 22 | 18 | 21 | 24 |
| Infrastructure - Telecommunications | 213 | 230 | 222 | 206 | 200 | 200 | 176 | 161 |
|
Note: All dollar values are expressed in nominal terms. Source: Statistics Canada, "Measuring digital economic activities in Canada: Initial estimates", Latest Developments in the Canadian Economic Accounts (13-605-X), special tabulation, 2019. |
||||||||
| 2010 | 2011 | 2012 | 2013 | 2014 | 2015 | 2016 | 2017 | |
|---|---|---|---|---|---|---|---|---|
| thousands of dollars | ||||||||
| Gross domestic product | 33,024 | 43,105 | 48,467 | 51,130 | 51,853 | 50,736 | 38,505 | 39,075 |
| Digitally-delivered products | 1,407 | 1,414 | 1,682 | 1,598 | 2,102 | 2,129 | 1,611 | 1,698 |
| E-commerce | 377 | 499 | 770 | 709 | 1,055 | 1,315 | 1,434 | 1,420 |
| Infrastructure - Hardware | 937 | 267 | 2,187 | 7 | 80 | 311 | 1,367 | 1,319 |
| Infrastructure - Software | 1,924 | 1,992 | 1,991 | 2,256 | 3,480 | 3,973 | 4,790 | 4,996 |
| Infrastructure - Support services | 2,056 | 1,688 | 2,267 | 3,606 | 1,833 | 2,405 | 1,241 | 1,236 |
| Infrastructure - Telecommunications | 26,323 | 37,244 | 39,570 | 42,954 | 43,303 | 40,603 | 28,062 | 28,406 |
| Output | 49,572 | 59,044 | 67,108 | 64,553 | 68,505 | 67,073 | 74,431 | 76,341 |
| Digitally-delivered products | 2,546 | 2,487 | 2,848 | 2,854 | 3,535 | 3,220 | 2,914 | 3,085 |
| E-commerce | 977 | 1,263 | 1,809 | 1,767 | 2,740 | 2,628 | 2,525 | 2,557 |
| Infrastructure - Hardware | 1,815 | 553 | 4,336 | 16 | 191 | 769 | 5,300 | 5,300 |
| Infrastructure - Software | 4,019 | 4,129 | 4,263 | 4,282 | 7,152 | 7,837 | 11,280 | 11,759 |
| Infrastructure - Support services | 3,234 | 2,686 | 3,443 | 5,171 | 3,311 | 3,505 | 2,213 | 2,258 |
| Infrastructure - Telecommunications | 36,980 | 47,926 | 50,409 | 50,462 | 51,576 | 49,114 | 50,198 | 51,382 |
| number of jobs | ||||||||
| Jobs | 97 | 102 | 110 | 131 | 146 | 140 | 139 | 135 |
| Digitally-delivered products | 22 | 23 | 23 | 35 | 40 | 44 | 44 | 43 |
| E-commerce | 9 | 9 | 9 | 15 | 25 | 17 | 16 | 17 |
| Infrastructure - Hardware | 10 | 5 | 20 | 5 | 5 | 5 | 10 | 10 |
| Infrastructure - Software | 20 | 20 | 21 | 23 | 37 | 37 | 37 | 37 |
| Infrastructure - Support services | 12 | 11 | 11 | 27 | 17 | 13 | 9 | 9 |
| Infrastructure - Telecommunications | 24 | 33 | 26 | 27 | 23 | 23 | 23 | 18 |
|
Note: All dollar values are expressed in nominal terms. Source: Statistics Canada, "Measuring digital economic activities in Canada: Initial estimates", Latest Developments in the Canadian Economic Accounts (13-605-X), special tabulation, 2019. |
||||||||
Annex A
| Supply and Use Product Code (SUPC) | SUPC Title | Full or partial digital product | Method for splitting partial products |
|---|---|---|---|
| Hardware | |||
| MPG23C400 | Communication engineering construction | Full | Note ...: not applicable |
| MPG334100 | Computers, computer peripherals and parts | Full | Note ...: not applicable |
| MPG334201 | Telephone apparatus | Full | Note ...: not applicable |
| MPG334209 | Other communications equipment | Full | Note ...: not applicable |
| MPG334A01 | Audio and video equipment and unrecorded media | Full | Note ...: not applicable |
| MPG334A02 | Navigational and guidance instruments | Full | Note ...: not applicable |
| MPG334A06 | Measuring, control and scientific instruments | Full | Note ...: not applicable |
| MPG334401 | Printed and integrated circuits, semiconductors and printed circuit assemblies | Full | Note ...: not applicable |
| MPG334409 | Other electronic components | Full | Note ...: not applicable |
| MPG335902 | Communication and electric wire and cable | Full | Note ...: not applicable |
| MPG335903 | Wiring devices | Full | Note ...: not applicable |
| MPG335909 | Other electrical equipment and components | Full | Note ...: not applicable |
| Software | |||
| MPS511200 | General purpose software | Full | Note ...: not applicable |
| MPS541501 | Custom software design and development services | Full | Note ...: not applicable |
| IMS541502 | Own-account software design and development services | Full | Note ...: not applicable |
| Telecommunications | |||
| MPS517002 | Mobile telecommunications services | Full | Note ...: not applicable |
| MPS517003 | Cable, satellite and other program distribution services | Full | Note ...: not applicable |
| MPS517004 | Fixed Internet access services | Full | Note ...: not applicable |
| MPS517001 | Fixed telecommunications services (except Internet access) | Full | Note ...: not applicable |
| Support services | |||
| MPS518000 | Data processing, hosting, and related services | Full | Note ...: not applicable |
| MPS532A01 | Computer equipment rental and leasing services | Full | Note ...: not applicable |
| MPS541503 | Computer systems design and related services (except software development) | Full | Note ...: not applicable |
| MPS610002 | Tuition and similar fees for colleges and C.E.G.E.P.s | Partial | Share of enrollments in 'digitally-enabled' education programs relative to total enrollments. Derived using Statistics Canada's Postsecondary Student Information System. |
| MPS610003 | Tuition and similar fees for universities | Partial | |
| MPS610004 | Tuition and similar fees for trade, technical and professional training | Partial | |
| MPS610009 | Other educational training and services | Partial | |
| NGS611200 | Community college and C.E.G.E.P services provided by governments | Partial | |
| NGS611300 | University services provided by governments | Partial | |
| NGS611A00 | Other educational services provided by governments | Partial | |
| E-commerce | |||
| MPS411000 | Wholesale margins - farm products | Partial | Margins associated with e-commerce wholesale transactions derived using e-commerce data collected in Statistics Canada's Annual Wholesale Trade Survey. |
| MPS412000 | Wholesale margins - petroleum and petroleum products | Partial | |
| MPS413000 | Wholesale margins - food, beverages and tobacco products | Partial | |
| MPS414000 | Wholesale margins - personal and household goods | Partial | |
| MPS415000 | Wholesale margins - motor vehicles, motor vehicle parts and accessories | Partial | |
| MPS416000 | Wholesale margins - building materials and supplies | Partial | |
| MPS417000 | Wholesale margins - machinery, equipment and supplies | Partial | |
| MPS418000 | Wholesale margins - miscellaneous products | Partial | |
| MPS410002 | Wholesale trade commissions | Partial | |
| MPS441000 | Retail margins - motor vehicles and parts | Partial | Margins associated with e-commerce retail transactions derived using e-commerce data collected in Statistics Canada's Annual Retail Trade Survey and Annual Retail Non-store Trade Survey. |
| MPS442000 | Retail margins - furniture and home furnishings | Partial | |
| MPS443000 | Retail margins - electronics and appliances | Partial | |
| MPS444000 | Retail margins - building materials, garden equipment and supplies | Partial | |
| MPS445000 | Retail margins - food and beverages | Partial | |
| MPS446000 | Retail margins - health and personal care products | Partial | |
| MPS447000 | Retail margins - automotive fuels | Partial | |
| MPS448000 | Retail margins - clothing and clothing accessories | Partial | |
| MPS451000 | Retail margins - sporting and leisure products | Partial | |
| MPS453000 | Retail margins - miscellaneous products | Partial | |
| MPS454310 | Retail margins - household fuels | Partial | |
| MPS4A0004 | Retail trade commissions | Partial | |
| Digitally-delivered products | |||
| MPG511111 | Newspapers | Partial | Share of digital newspaper sales or advertising in digital newspapers. Derived using information collected in the Survey of Service Industries: Newspaper publishers. |
| MPS511112 | Advertising space in newspapers | Partial | |
| MPG5111A1 | Periodicals | Partial | Share of digital periodical sales or advertising in digital periodicals. Derived using information collected in the Survey of Service Industries: Periodical publishers. |
| MPS5111A4 | Advertising space in periodicals and in other publications | Partial | |
| MPG5111A2 | Books | Partial | Share of digital book sales derived using information collected in the Survey of Service Industries: Book publishers. |
| MPS5121A1 | Recorded movies, television programs and videos | Full | Note ...: not applicable |
| MPS5121A2 | Movie, television program and video production, post-production and editing services | Full | Note ...: not applicable |
| MPS5121A3 | Licensing of rights to use audiovisual works | Full | Note ...: not applicable |
| MPS512201 | Recorded music and other sound recordings | Full | Note ...: not applicable |
| MPS512202 | Audio recording services and copyright administration | Full | Note ...: not applicable |
| MPS512203 | Licensing of rights to use musical works and sound recordings | Full | Note ...: not applicable |
| MPS515100 | Advertising air time on radio | Full | Note ...: not applicable |
| MPS515A01 | Advertising air time on television | Full | Note ...: not applicable |
| MPS515A02 | Fees for the distribution of television and radio program channels (affiliation payments) | Full | Note ...: not applicable |
| MPS519001 | Subscriptions for online content | Full | Note ...: not applicable |
| MPS519002 | Internet advertising | Full | Note ...: not applicable |
| MPS519008 | Other information services | Full | Note ...: not applicable |
| MPS5221A0 | Banking and other depository credit intermediation services - explicit charges | Partial | Share of explicit fees associated with the access to online 'digitally-delivered' banking services. Derived using data from schedules reported to Financial Information Committee. |
| MPS561500 | Travel arrangement, reservation and planning services | Full | Note ...: not applicable |
| MPS71A009 | Broadcast and other media rights | Full | Note ...: not applicable |
|
... not applicable Source: Statistics Canada. |
|||
Annex B
| Classification of Instructional program (CIP)Annex B Note 2 Code | CIP Title |
|---|---|
| 09.07 | Radio, television and digital communication |
| 10.01 | Communications technology/technician |
| 10.02 | Audiovisual communications technologies/technicians |
| 10.03 | Graphic communications |
| 10.99 | Communications technologies/technicians and support services, other |
| 11.02 | Computer programming |
| 11.03 | Data processing and data processing technology/technician |
| 11.04 | Information science/studies |
| 11.05 | Computer systems analysis/analyst |
| 11.06 | Data entry/microcomputer applications |
| 11.07 | Computer science |
| 11.08 | Computer software and media applications |
| 11.09 | Computer systems networking and telecommunications |
| 11.10 | Computer/information technology administration and management |
| 11.99 | Computer and information sciences and support services, other |
| 14.09 | Computer engineering |
| 14.10 | Electrical, electronics and communications engineering |
| 15.00 | Engineering technology, general |
| 15.03 | Electrical and electronic engineering technologies/technicians |
| 15.12 | Computer engineering technologies/technicians |
| 30.15 | Science, technology and society |
| 30.16 | Accounting and computer science |
| 47.01 | Electrical/electronics maintenance and repair technology |
| 50.0102 | Digital arts, general |
| 50.0706 | Intermedia/multimedia |
| 52.0208 | E-commerce/electronic commerce |
| 52.21 | Telecommunications management |
| 52.2101 | Telecommunications management |
|
|
References
OECD (2011), OECD Guide to Measuring the Information Society, OECD Publishing, Paris.
OECD (2014), Measuring the Digital Economy: A New Perspective, OECD Publishing, Paris.
OECD (2015), OECD Digital Economy Outlook 2015, OECD Publishing, Paris.
OECD (2016), Measuring GDP in a Digitalized Economy, STD Working Paper (2016)07.
OECD (2017), Issue paper for a proposed framework for a satellite account for measuring the digital economy, STD/CSSP/WPNA (2017)10.
Statistics Canada (2017), "Measuring the sharing economy in the Canadian Macroeconomic Accounts", Latest Developments in the Canadian Economic Accounts, Statistics Canada catalogue number 13-605-X.
U.S. Bureau of Economic Analysis (2018), Defining and Measuring the Digital Economy, Bureau of Economic Analysis, Washington DC.
Canadian Bankers Association (2016), How Canadians Bank, posted July 12 2017.
- Date modified: