
Income and Expenditure Accounts Technical Series
The Natural Resources Satellite Account: Feasibility study
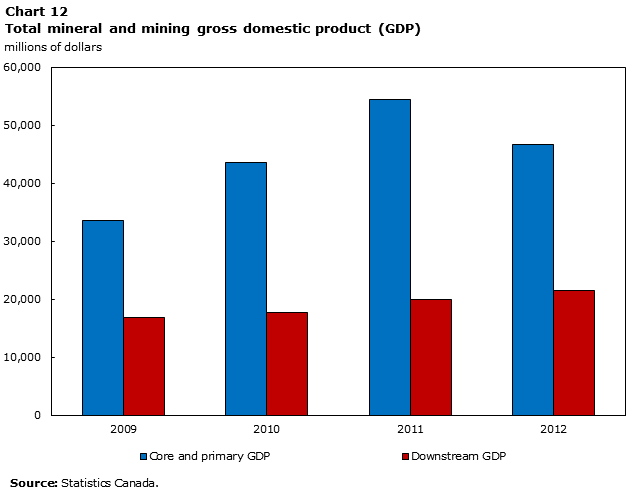
Chart 12
Total mineral and mining gross domestic product (GDP)

Archived Content
Information identified as archived is provided for reference, research or recordkeeping purposes. It is not subject to the Government of Canada Web Standards and has not been altered or updated since it was archived. Please "contact us" to request a format other than those available.
Data table for Chart 12
| Year | Core and primary GDP | Downstream GDP |
|---|---|---|
| millions of dollars | ||
| 2009 | 33,650 | 16,797 |
| 2010 | 43,624 | 17,744 |
| 2011 | 54,417 | 19,923 |
| 2012 | 46,752 | 21,497 |
| Source: Statistics Canada. | ||
- Date modified: