Publications
Income and Expenditure Accounts Technical Series
Provincial-Territorial Human Resource Module of the Tourism Satellite Account, 2012
Results
Archived Content
Information identified as archived is provided for reference, research or recordkeeping purposes. It is not subject to the Government of Canada Web Standards and has not been altered or updated since it was archived. Please "contact us" to request a format other than those available.
The section illustrates the types of analyses the Provincial-Territorial Human Resource Module (PTHRM) can support. To this end, results have been selected from among the data available for the provinces and territories for each sub-section.
4.1 Tourism sector
This section aims to compare key variables of the PTHRM: jobs, hours worked and compensation for the tourism sector with the overall economy over time.
Compensation for all jobs
Compensation for all jobs in tourism industries increased 3.3% in Canada in 2012 to $51 billion, accounting for 5.3% of compensation in the total economy. Total compensation for the tourism sector increased in all provinces and territories. Newfoundland and Labrador led the provinces in growth in compensation, increasing 9.7%, marking a fourth consecutive year of growth above 7.0%. Yukon led the territories with growth of 18.1%. New Brunswick trailed at 0.6%.
Jobs
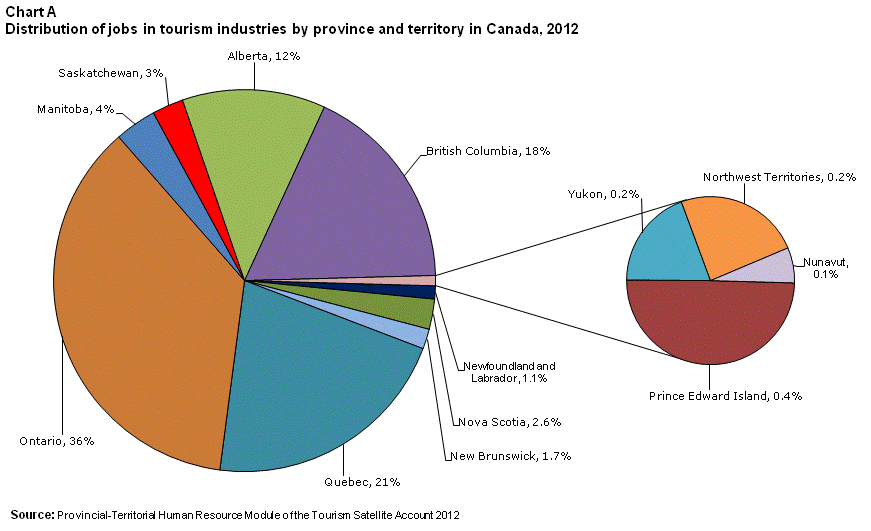
Tourism accounted for 1.6 million jobs in Canada in 2012. All provinces and territories added jobs in tourism industries. Yukon's growth rate was the highest at 27.4% whereas Ontario's growth rate was the lowest at 0.6%, compared to 1.5% for tourism industries in Canada.
In all provinces in Atlantic Canada in 2012, growth in jobs in the tourism sector outpaced growth in jobs in their respective local economies and also outpaced growth in the national tourism sector. Newfoundland and Labrador led the region with job growth of 5.3%, highest among the provinces. For comparison, Canada experienced job growth of 1.0% in the total economy in 2012.
Of all provinces and territories, British Columbia's tourism industries had the largest share of jobs in the province's total economy at 12.2%.The Northwest Territories and Yukon were close behind at 12.1% and 11.3% respectively. Nunavut had the smallest share at 7.1%.


Hours worked per job
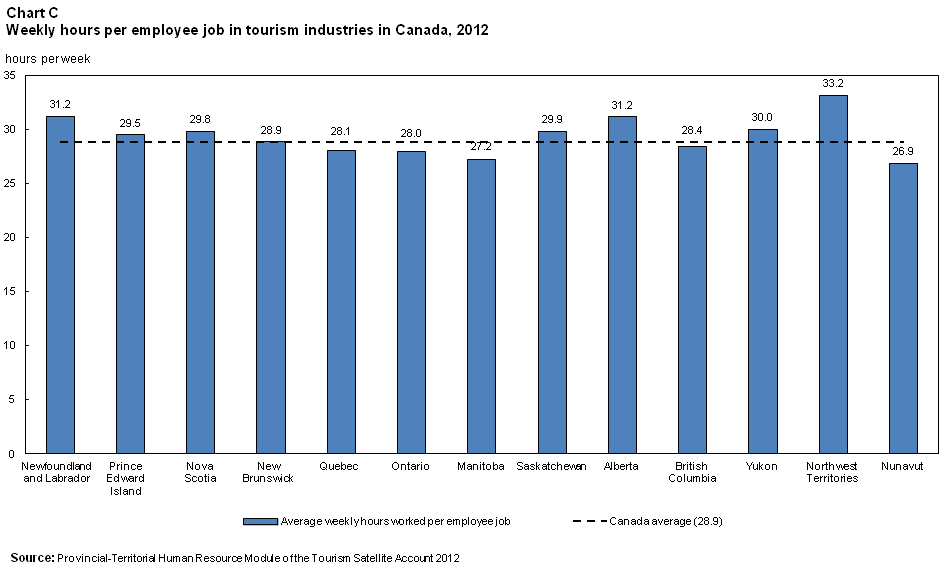
Average weekly hours worked per job in tourism industries increased 1.1% in Canada in 2012 to 29.3 hours per week. At the provincial-territorial level, weekly hours were highest in the Northwest Territories (33.6 hours per week) and Alberta (31.5) and lowest in Manitoba (28.0) and Quebec (28.4).
Weekly hours per job contracted in Nova Scotia (-2.0%), Yukon (-1.6%), Newfoundland and Labrador (-0.7%), and Quebec (-0.4%) in 2012, while increasing in other provinces and territories. Prince Edward Island posted the largest increase in weekly hours of work in tourism industries (+2.9%), followed by New Brunswick (+2.8%) and Ontario (+2.3%).
The work week was shorter in tourism industries than in the local economy in each province and territory. The Northwest Territories had the smallest gap with 33.6 hours per week in tourism industries relative to 34.1 in the local economy. The largest gap was in Manitoba, with 28.0 hours compared to 32.7 in the province generally.

Compensation per hour
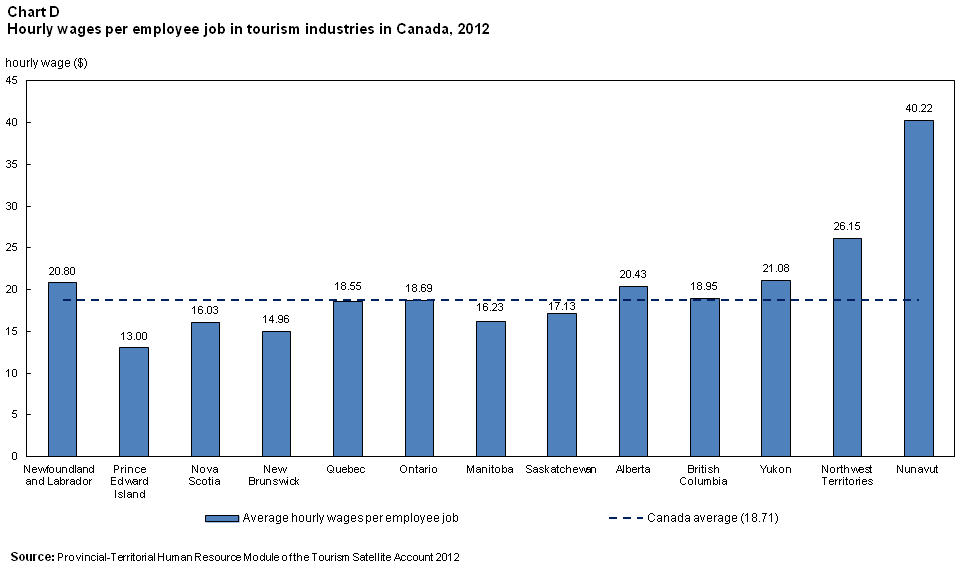
Hourly compensation in tourism industries in Canada advanced 0.6% in 2012 to $20.77. Newfoundland and Labrador (+4.9%) and Alberta (+4.4%) posted the largest increases, while hourly compensation in Nunavut (-7.8%) and Yukon (-5.8%) fell most rapidly. Despite the decrease, hourly compensation in tourism industries was highest in Nunavut at $42.22.
In no province or territory did hourly compensation in tourism industries meet or exceed the average hourly compensation for the local economy as a whole. The relative gap in hourly compensation in tourism industries compared to the local economy was smallest in Nunavut ($42.22 compared to $55.43), and largest in Prince Edward Island ($13.88 compared to $23.84) and Alberta ($22.30 compared to $38.25).
As recently as 2007, hourly compensation in tourism industries in Nunavut was similar to that of the Northwest Territories. However, Nunavut in 2012 recorded hourly compensation of $42.22 in tourism industries, the highest among all provinces and territories, whereas the Northwest Territories was second-highest with $27.30. The gap between these two territories ($14.92) is larger than the gap between the Northwest Territories and the lowest figure in all provinces and territories (Prince Edward Island at $13.88, a gap of $13.41).

4.2 Tourism industry profiles
The PTHRM contains aggregated data for five tourism industry groups: transportation, accommodation, food and beverage services, recreation and entertainment, and travel services. Appendix E lists the industries included in each industry group of the tourism sector. The following provides results by industry group for selected provinces and territories to give an indication of the kinds of industry analyses possible with the PTHRM.
Food and beverage services in Nova Scotia
The food and beverage services industry in Nova Scotia supported 21,083 employee jobs and 719 jobs from self-employment in 2012. It accounted for 53% of all jobs in tourism industries in the province. Weekly hours worked at 27.6 were similar to the national average for the food and beverage services industry. Immigrants held just 6% of employee jobs in food and beverage services in Nova Scotia, compared to 26% for the industry in Canada. Immigrants in this industry in Nova Scotia worked longer hours than non-immigrants (34.6 hours per week compared to 26.5).
Recreation and entertainment in Ontario
The recreation and entertainment industry in Ontario accounted for 102,670 jobs in 2012, down 9.5% from its high of 113,486 in 2009. One in four jobs in the industry was due to self-employment in 2012, compared to one in five for recreation and entertainment in Canada. Of the 76,758 employee jobs, two out of five were held by a worker aged 15 to 24.
Accommodation in Quebec
The accommodation industry in Quebec supported 37,561 jobs in 2012, of which 37,233 were employee jobs and 328 were jobs from self-employment. Three out of four jobs were full-time. On average, employees earned just over $29,000 annually at an hourly wage of $17.66, below the Canada average hourly wage of $18.85 in accommodation. A smaller proportion of employee jobs in accommodation were held by immigrants in Quebec (17%) than in Canada (27%).
Transportation in Yukon
Transportation industries in Yukon supported 461 employee jobs in 2012, of which 418 were full-time. Seven employee jobs out of ten were occupied by men and nine out of ten by non-immigrants. There was a higher proportion of workers aged 15 to 34 (63%) than in transportation industries in Canada (22%).
Travel services in Alberta
The travel services industry accounted for 2.4% of jobs in tourism industries in Alberta in 2012 with 4,639 jobs. Of these, 4,155 were employee jobs and 484 were jobs from self-employment. Although the proportion of employee jobs in the industry being full-time (83%) was similar to that for travel services in Canada (87%), the average weekly hours in travel services in Alberta at 30.5 hours was four hours shorter than the national industry average. Wages per hour worked for women were 61% that of men ($26.51 compared to $43.33).
4.3 Occupation profile
This section profiles a selected occupation to demonstrate the types of analysis supported by the available data.
Occupation profile: food counter attendants and kitchen helpers
There was more employment in this occupation than any other in tourism industries, with 255,000 jobs in Canada in 2012. Of these, 240,000 were in food and beverage services, with the remainder in accommodation (8,000 jobs) and recreation and entertainment (6,000).Note 1
Hourly wages in this occupation were highest in Nunavut ($33.94) and lowest in Prince Edward Island ($10.42). Weekly hours were highest in the Northwest Territories (36.5) and lowest in Manitoba (18.4).
While the majority of jobs in this occupation were part-time in food and beverage services (63%) and recreation and entertainment (75%), 63% of these jobs in accommodation were full-time.
A greater proportion of women worked full-time in this occupation than men (41% compared to 32%). On average, men working full-time earned $0.65 more per hour than women working full-time, whereas men working part-time earned $0.21 less than women working part-time.
Immigrants in this occupation were more likely to work full-time than non-immigrants (54% compared to 32%). Hourly wages for immigrants were higher than those of non-immigrants in this occupation in both part-time (by $0.94) and full-time jobs (by $1.39).
Hourly wages in this occupation were lowest for those aged 15 to 24, at $11.22. The hourly wages for higher age groups were comparable with each other, with those aged 25 to 34 earning $13.29 per hour, those aged 35 to 44 earning $13.42, and those aged 45 and above earning $13.75. This is unlike the tourism sector average, as employees in tourism industries aged 45 and over earned hourly wages $5.03 greater than those aged 25 to 34.
Top occupations
The top occupations in tourism industries in Canada in 2012 were food counter attendants and kitchen helpers; food and beverage servers; cooks; restaurant and food service managers; bus drivers and subway and other transit operators; program leaders and instructors in recreation, sports and fitness; light duty cleaners; chefs; food service supervisors; and bartenders.
Overall, the predominant occupations among tourism industries in the provinces and territories were similar to those observed nationally. There were some exceptions: by province and territory, bartenders were a top-ten occupation in only four jurisdictions out of thirteen (Newfoundland, Quebec, Saskatchewan, and Yukon). On the other hand, hotel front desk clerks were a top-ten occupation in ten jurisdictions despite falling outside the top ten occupations at the national level.
Other tourism occupations compared to other occupations in tourism industries
Of 1.5 million employee jobs in tourism industries in 2012, some 481,000 are not profiled in detail as tourism characteristic occupations in supplementary tables available upon request.Note 2
Of these 481,000 jobs, approximately 169,000 were in other tourism occupations and 313,000 were in other occupations in tourism industries.Note 3
Weekly hours worked per job (32.3 hours per week) as well as hourly wages ($24.79 per hour) were higher for other tourism occupations than for other occupations in tourism (31.2 hours per week and $22.66 per hour).
Of jobs in food and beverage services not in tourism characteristic occupations, a small proportion (9,000 of 121,000) were in other tourism occupations. The hours were longer in other tourism occupations in food and beverage services (33.0 hours compared to 25.4 for other occupations in food and beverage services) and the hourly wage was higher ($27.31 compared to $17.28) in 2012. Likewise, jobs in other tourism occupations in other transportation industries had higher weekly hours (36.5 hours compared to 35.0 for other occupations in other transportation industries) and hourly wages ($31.76 compared to $28.30).
On the other hand, the work week was shorter in other tourism occupations in recreation and entertainment (27.6 hours per week compared to 33.3 for other occupations in the industry) and in travel services (32.8 hours per week compared to 34.9 for other occupations in the industry).Note 4
4.4 Employee profiles
The PTHRM provides details concerning three characteristics of employees: sex, age group, and immigrant status. The following section highlights some of the PTHRM results for 2012 according to these demographics (see Table C).
Sex
Women outnumbered men in the tourism sector in each jurisdiction except the Northwest Territories and Nunavut; men occupied 53% of employee jobs in tourism industries in each of these two territories.
The average number of hours worked per week was higher for men in all provinces and territories. Of employee jobs in tourism industries held by men in Canada, two-thirds were full-time, compared to 56% of those held by women. Only in Nunavut did a larger proportion of women work full-time compared to men (66% compared to 55%).
Hourly wages for women trailed those of men in all jurisdictions. The wages of women as a percentage of those of men was highest in Nunavut (at 90%) and lowest in the Northwest Territories (at 65%).
Age
Young workers (those aged 15 to 24) were an important source of labour in the tourism sector in Canada, holding 538,000 employee jobs in 2012, or 36% of employee jobs in tourism industries. Young workers were most prevalent in tourism industries in Prince Edward Island (occupying 45% of employee jobs) and Manitoba (with 43%). They were least prevalent in the Northwest Territories (19%) and Nunavut (23%).
Hours worked were lower for young workers nationwide, with only 32% of employee jobs in tourism industries in Canada held by young workers being full-time jobs. To compare, more than two-thirds of employee jobs held by workers aged 25 and older were in full-time work.Note 5
Older workers (those aged 45 and over) were also an important source of labour in tourism industries, with 30% of employee jobs in Canada's tourism sector in 2012 (450,000 jobs). They were most prevalent in the Northwest Territories and in Newfoundland and Labrador, holding one-third of jobs in tourism industries in those jurisdictions, and least prevalent in Nunavut (with one in five jobs) and in Manitoba and Alberta (with one in four).
A smaller proportion of older workers in Canada worked full-time than employees aged 35 to 44 (77% compared to 81%) and accordingly averaged a shorter work week (34.5 hours compared to 37.3).Note 6 Average hourly wages in tourism industries were highest for this age group at $22.42.
Immigrant status
Immigrants held 24% of employee jobs in tourism industries in Canada. By province and territory, this share was highest in British Columbia (at 31%), Ontario and Alberta (29% each). Provinces in Atlantic Canada had the smallest shares of immigrants employed in tourism industries (from 3% of the workforce in Newfoundland and Labrador to 7% in Nova Scotia), as well as Nunavut (at 5%).
For Canada, hourly wages earned by immigrants employed in tourism industries were, on average, slightly less than those of non-immigrants in 2012 ($18.44 compared to $18.82). Immigrants had higher wages than non-immigrants in three tourism industry groups: accommodation, food and beverage services, and recreation. By province and territory, immigrants employed in tourism industries earned higher hourly wages in Newfoundland and Labrador, Nova Scotia, Ontario, Yukon and Nunavut.
Immigrants worked longer hours than non-immigrants on average in every province and territory but Newfoundland and Labrador. Only 17% of immigrants holding jobs in tourism industries were aged 15 to 24, compared to 42% of non-immigrants. Both immigrant and non-immigrant young workers worked predominantly part-time (68%) in tourism industries.
Tables
Notes
- Figures do not sum because of rounding.
- For more information on the definition of tourism characteristic occupations, other tourism occupations, and other occupations in tourism industries, see Appendix B: Concepts and definitions.
- Figures do not sum due to rounding.
- In the PTHRM, detailed information about air transportation is unavailable for reasons of confidentiality.
- According to the Labour Force Survey, in 2012 about 72% of young workers gave attending school as their main reason to be working part-time. Source: Statistics Canada. Table 282-0014 – Labour force survey estimates (LFS), part-time employment by reason for part-time work, sex and age group, annual (persons), CANSIM.
- The majority (55%) of older workers gave personal preference as their main reason to be working part-time. Source: ibid.
- Date modified:
