
Income and Expenditure Accounts Technical Series
The underground economy in Canada, sources and methods
Text begins
Acknowledgements
This document was prepared by Deming Luo, Eric Desjardins and Marco Provenzano of the National Economic Account Division, Statistics Canada.
The study and measurement of the underground economy in Canada first started in the early 1990’s. The current study is a continuation of previous works and draws heavily on them. Therefore, the authors would like to thank all people who have participated in this prior work.
The study was funded through a partnership agreement with Canada Revenue Agency (CRA). The authors would like to thank Lidia Dobrotescu, manager of the project for the CRA, and the CRA project team for comments on earlier versions of this document.
Many people from the National Economic Accounts Division (NEAD) were involved at various stages of this study. The authors would especially like to thank Brenda Bugge, Matthew Hoffarth and Conrad Barber-Dueck who provided valuable information and comments for this study.
Acronyms
- BR
- Business Register
- CPI
- Consumer Price Index
- CRA
- Canada Revenue Agency
- CSMA
- Canadian System of Macroeconomic Accounts
- CSNA
- Canadian System of National Accounts
- GDP
- Gross Domestic Product
- GFCF
- Gross fixed capital formation
- GST
- Goods and Services Tax
- HRRS
- Homeowner Repair and Renovation Survey
- HST
- Harmonized Sales Tax
- LCBO
- Liquor Control Board of Ontario
- MLS
- Multiple Listing Service
- NAICS 2017
- North American Industry Classification System (2017)
- NEAD
- National Economic Accounts Division
- NOE
- Non-observed economy
- OECD
- Organisation for Economic Co-operation and Development
- SHS
- Survey of Household Spending
- SNA
- System of National Accounts
- SUT
- Supply and use tables
- T1
- Tax form for unincorporated businesses in Canada
- T2
- Tax form for incorporated businesses in Canada
- UE
- Underground Economy
- WHO
- World Health Organization
1 Introduction
The measurement of gross domestic product (GDP) generated by the underground economy in Canada is not a new endeavour. The first study was carried out by Berger (1986)Note , with methodological updates by Gervais (1994)Note , then Terefe, Barber-Dueck and Lamontagne (2011)Note , and Morissette (2014)Note . In addition, the Organization for Economic Co-operation and Development (OECD) in 2002 published a detailed handbookNote on the topic.
The current study is a continuation of previous works and draws heavily on them. It also includes the following updates introduced after the study of Morissette (2014).
- Estimates have been extended to the provinces and territories.
- Revised definitions and classifications introduced in 2016 by the Canadian System of Macroeconomic Accounts (CSMA) were incorporated in the study.
- Cannabis for both recreational and medical purposes were incorporated in this study, following its legalization by the government of Canada on October 17, 2018.
- New data sources, such as latest Canadian national and provincial supply and Use tables, legal cannabis consumption.
This report is organized as follows. The following section describes the non-observed economy, as defined by the OECD Handbook. The third section explains the scope of the underground economy program in Canada and how it may differ from the OECD guidelines. The fourth section is devoted to methodology, assumptions, and data sources. The fifth section explains how each component of the underground economy in Canada is measured. The sixth and final section describes how underground economy GDP is measured and presented using three approaches: expenditure-based, income-based, and industry-based.
2 The non-observed economy, international guidelines
High-quality data is essential for monitoring economic trends, analyzing the current economic situation, and guiding economic policies. Producing this data is the objective of compiling the economic accounts. In general, the data quality can be measured from the three dimensions: the coverage of economic production, the accuracy of estimations, and the timing of the estimates. Over the years Statistics Canada has continuously integrated more and more economic activities into the boundaries of the national economic accounts, but some gaps in coverage remain. Some economic activities have hidden, illegal, and informal features, so they are deliberately concealed by those responsible for them. Official published data such as GDP include some of these deliberately hidden economic activities; however, a significant portion of unobserved economic activities are excluded from official published data. This program on the underground economy aims at filling this data gap.
According to the OECD Handbook for the Measurement of the Non-observed Economy, the five groups of activities that are collectively said to comprise the non-observed economy (NOE) are:
- The hidden sector or underground production;
- The illegal sector or illegal production;
- Informal sector production;
- Household production for own final use; and
- Deficiencies in the basic data collection program.
2.1 The hidden sector or underground production
The hidden sector (also referred to as underground production in the OECD Handbook) is defined as “those activities that are productive and legal but are deliberately concealed from public authorities” generally for the following reasons:
- to avoid payment of income, value added or other taxes;
- to avoid payment of social security contributions;
- to avoid having to meet certain legal standards such as minimum wages, maximum hours, safety or health standards;
- to avoid complying with certain administrative procedures, such as completing statistical questionnaires or other administrative forms.
For example, if an enterprise chooses not to declare part or all of its income in order to avoid direct or indirect taxation, chooses not to respect employment regulations or immigration laws by hiring labour “off the books”, decides to operate unofficially in order to avoid long and costly bureaucratic procedures, or if self-employed workers declare fraudulently that they are unemployed in order to draw unemployment benefits, then all these activities would belong to the underground economy.
2.2 The illegal sector
The illegal sector represents illegal production of goods and services whose production, sale, distribution, or mere possession is forbidden by law, as well as productive activities which are usually legal but become illegal when carried out by unauthorized or unlicensed producers.
Based on Blades (1983)Note , the following general types of illegal production are identified:
- production and distribution of illegal goods and services;
- production activities which are usually legal but which become illegal when carried out by unauthorized producers, such as unlicensed medical practices, unlicensed gambling activities, or unlicensed production of alcohol;
- poaching, e.g., illegal fishing, hunting, tree cutting;
- production and sale of counterfeited products, such as watches and other products with false trade-marks and unauthorized copies of artistic originals, e.g., software, digital copiesNote and videos;
- smuggling, in particular, of tobacco, weapons, alcohol, food, people, both wholesale and retail;
- fencing (resale) of stolen goods;
- bribery;
- money laundering.
2.3 The informal sector
According to the OECD Handbook, there are two different but interrelated ways of viewing and defining the informal sector. One approach views enterprises in relation to the legal and administrative framework in place and defines the informal sector as made up of enterprises that do not conform to this framework in some way. It assumes an intrinsic relation between non-registration pursuant to specific legislation and the notion of informality. The second approach views the informal sector as a particular form of production and defines it in terms of the way the enterprises are organized and carry out their activities.
Based on these two approaches, the informal sector is defined as comprising informal own-account enterprises and enterprises of informal employers.
Informal own-account enterprises include either all own-account enterprises, or only those that are not registered under specific forms of national legislation. The legislation referenced includes factories’ and commercial acts, tax and social security laws, professional groups’ regulatory acts, and similar acts, laws or regulations established by national legislative bodies. Regulations enacted by local authorities for the purpose of obtaining a trade license or a permit to operate a business are excluded from the criterion.
While the informal sector is not easy to define the vast majority of informal sector activities provide goods and services whose production and distribution are perfectly legal. This is in contrast to illegal production. There is also a clear distinction between the informal sector and hidden production. Informal sector activities are not necessarily performed with the deliberate intention of evading the payment of taxes or social security contributions, or violating labour legislation or other regulations.
2.4 Household production for own final use
Household production of goods for own final use includes crops and livestock, production of other goods for own consumption, and own-account fixed capital formation. Household production of services for own final use mainly includes paid domestic services and owner-occupied dwelling services.
2.5 Deficiencies in basic data collection program
The term “basic data collection program” is used to describe the statistical infrastructure and survey procedures that collect and process basic economic data and which are used by statistical agencies to compile aggregate economic estimates.
Production missed due to deficiencies in the basic data collection programs comprises all the productive activities that should be accounted for but are missed due to statistical deficiencies. It is sometimes referred to as the statistical underground – in contrast to the economic underground, which comprises activities that have been concealed by the producing units for economic reasons.
Reasons why activities may escape direct measurement by the basic data collection system can be grouped into three main categories as follows:
- Undercoverage of enterprises: Enterprises, or parts of them, are excluded from the data collection program though in principle they should have been included. This may occur, for example, because an enterprise is new and has not yet been included in the survey frames, or it falls below the size cut-off for surveys, or it has been incorrectly classified by kind of activity or by region and thus improperly excluded from the survey frame;
- Non-response by enterprises: Enterprises are included in the sample but no data are collected from them (for example, because the survey questionnaire was wrongly addressed or the enterprise, or part of it, did not return the questionnaire) and no imputation is made for the missing observations;
- Underreporting by enterprises: Data are obtained from enterprises but are misreported by the respondent in such a way as to underreport value added, or correct data are received but are inappropriately edited or weighted.
3 The scope of the Canadian underground economy program
The OECD Handbook for measuring the non-observed economy provides a standard guideline on how to measure all deliberately hidden economic activities. However, considering the availability of reliable data and feasibility of estimating such activity the scope of the Canadian estimates is limited to market-based productive activities carried out in selected components of the hidden, illegal, and informal sectors of the economy (i.e., the shaded areas in Figure 1). These three components are defined as the underground economy. Specifically, the measurement of the underground economy includes the following components:
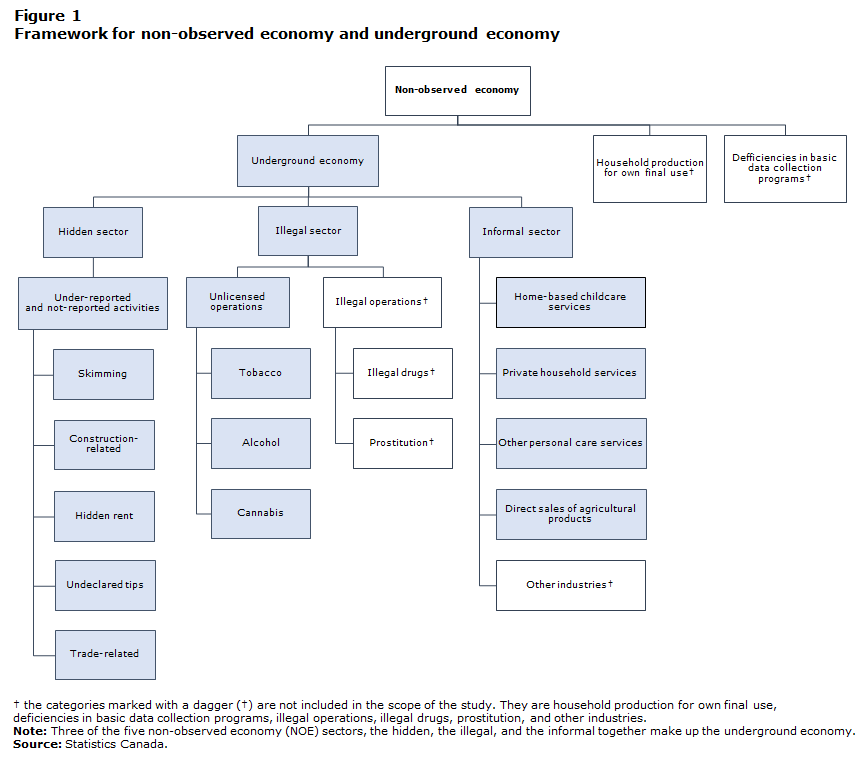
Description for Figure 1
This diagram illustrates the hierarchy framework for the non-observed economy. The non-observed economy is composed of underground economy, household production for own final use, and deficiencies in basic data collection programs. The underground economy is composed of the hidden sector, the illegal sector, and the informal sector. The hidden sector comprises under-reported and not-reported activities including skimming, construction-related, hidden rent, undeclared tips, and trade-related activities. The illegal sector comprises of unlicensed tobacco, alcohol and cannabis operations, and illegal drug and prostitution operations. The informal sector comprises home-based childcare services, private household services, other personal care services, direct sales of agricultural products, and other industries.
Some components of the non-observed economy are not included in the scope of the study. These components are illegal operations on illegal drugs and prostitution, household production for own final use, deficiencies in basic data collection programs and the other industries in the informal sector.
Note: Three of the five non-observed economy (NOE) sectors, the hidden, the illegal, and the informal together make up the underground economy. The categories marked with a dagger (†) are not included in the scope of the study. They are household production for own final use, deficiencies in basic data collection programs, illegal operations, illegal drugs, prostitution, and other industries.
Source: Statistics Canada.
3.1 The hidden sector
In this study, the hidden sector includes both non-reported and under-reported production. In the latter case, it takes the form of under-reporting of revenues (or gross output), or over-reporting of costs (or intermediate inputs) to understate profits (or value added) to tax authorities or statistical agencies. This is labeled as skimming. In the former case, revenues, costs, and profits are simply not reported.
Specifically, the hidden sector consists of skimming, construction-related activities, hidden rent, undeclared tips and import and export-related underground activities. However, some typically hidden economic activities discussed in the Handbook, such as cross-border shopping, shuttle and barter trade are not included.
3.2 The illegal sector
As explained in Section 2, the illegal sector is composed of two groups: unlicensed operations and illegal operations.
Unlicensed operations represent those productive activities which are usually legal but become illegal when carried out by unauthorized producers. This study includes the illegal manufacturing, sales, and imports (smuggling) of alcohol, tobacco and cannabis. Unlicensed operations of cannabis were added to this study following its legalization in Canada in October 2018.
Illegal operations represent the production of goods and services whose sale, distribution or mere possession is forbidden by law, such as the production and sale of narcotic drugs. This study does not attempt to measure activity that is forbidden by law, due to the difficulty of obtaining reliable source data in these areas.
3.3 The informal sector
Section 2 shows that there are two approaches to define the informal sector. In this study the informal sector represents informal production activities associated with establishments that are not registered with fiscal or social security authorities. As a result, they are generally missing from survey frames of statistical agencies, such as the Business Register (BR)Note used by Statistics CanadaNote . These entities include unincorporated businesses operating legally as unregistered establishments of the self-employed with and without informal employees.
The informal production activities included are child-care in the home, private household services, other personal care services, and direct sales of agricultural products. Although household expenditure on these services is likely captured by the Survey of Household Spending (SHS), and is part of expenditure-based GDP, it is believed that income from these activities could be potentially missing from gross domestic income.
The estimate of direct sales of agricultural products represents undeclared income of individuals selling farm produce such as fruits, vegetables, eggs and honey on roadsides or temporary stands directly to consumers. This income is potentially missing from the income component of the retail industry or implicitly included elsewhere through national accounts balancing adjustments. The expenditure on these products is captured by the SHS and is in the published GDP numbers.
Firms or establishments operating in other industries without being registered with the fiscal or social security authorities are not included in this study. Although it is possible that underground activity exists in other industries, they have been excluded until further research determines the magnitude of this missing productive activity.
3.4 Excluded production or activities
Two areas of the non-observed economy are excluded from this study. The first part is all household production for own final use. Production of households for own final use is defined as those productive activities that result in goods or services consumed by the households that produced them.
All goods produced by households on own account are included in the CSMA production boundary; however, in Canada, in practice, only food grown by farmers for own-consumption is included. Services produced by households, on the other hand, are not included within the production boundary (e.g., cleaning, laundry) except for owner-occupied rent, which already has a measurement methodology. Owner-occupied rent is counted in the official GDP, but not considered in this study.
The second part that is excluded involves statistical issues related to deficiencies in the basic data collection program.
The CSMA and its feeder programs within Statistics Canada have developed a wide range of methods and procedures that address deficiencies in basic data collection. Statistics Canada data sources, from surveys or administrative forms, are subject to a quality assurance process that closely monitors and adjusts the data sampling and collection frames, employs a rigorous follow-up for surveys, and subjects all data responses to validation checks to ensure the correctness and consistency of data.
After appropriate transformation to national accounting concepts, these datasets are used in the national accounts compilation process. Where these basic data are inadequate, the data gaps are filled and inconsistencies are resolved using indirect compilation methods that model the missing data using other related data (indicators) and that enforce accounting identities. For these reasons, statistical issues related to deficiencies in the basic data collection program are not addressed.
4 Methods, assumptions, and data sources
4.1 Methods of measurement
The OECD Handbook suggests four broad methods for measuring the non-observed economy. They include:
- upper bound estimation;
- special surveys and other supplementary data;
- data confrontation and discrepancy analysis;
- macro-model methods.
The upper bound method is the main approach used in Statistics Canada studies.Note As mentioned in the OECD Handbook, “the essence of the procedure is to consider systematically for each component of GDP the maximum possible amount of non-observed economy (NOE) activities and to total the results to obtain an upper bound. The procedure can be applied by any or all of the expenditure, income and production approaches.”Note An example of this would be childcare services; given the number of children under the age of five, and the proportion of families using childcare services, it is possible to calculate an upper bound estimate of spending on childcare.
Another method entails the use of special surveys and other supplementary data. The OECD Handbook indicates that “these are surveys that are not part of the basic data collection program. They can take a variety of forms, being special surveys of expenditure, income, labour, time use, and opinion surveys. They can be designed to target any or all of the NOE problem areas – underground, illegal, informal sector and household production for own use. They can be conducted by the national statistical office or by other agencies including, for example, sample audits by the tax authorities.”Note For instance, this study examines tax audit files and compares them to survey information and to original revenues and expenses reported in tax returns. One difficulty associated with this approach is that the different sources of information are not always comparable. Consequently, differences between them may simply be due to misreporting as opposed to UE.
A third method suggested in the OECD Handbook is data confrontation and discrepancy analysis. The OECD highlights the fact that confrontation of data from different sources is an integral part of national accounts compilation. Examples of possible data confrontation are also listed in the OECD handbook,Note and used in the regular production process of the CSMA. This includes such analysis as:
- Enterprise survey data versus income or taxation data;
- Supply of goods and services versus the use of them;
- Household expenditures versus available income.
Macro-model methods are discussed in Chapter 12 of the OECD Handbook but are not recommended as accurate measures of the underground or non-observed economy. The OECD suggests that these methods do not properly measure underground activity and provide very divergent results depending on the assumptions used.Note
In this study the upper bound method is used to create most of the UE estimates relating to household spending and construction. Supplementary data is used for alcohol, tobacco and cannabis, to refine estimates where possible and provide information on industry allocation. Data confrontation provides further indicators of the industrial distribution of UE activity.
4.2 Key assumptions
Economic activities that are missing from the basic data used to compile the national accounts because they are underground, illegal, informal, household production for own final use, or due to deficiencies in the basic data collection system are referred to as non-observed. To estimate them, several key assumptions are made throughout the study, namely:
- small businesses are more likely to participate in UE activities than large businesses;
- unincorporated businesses are more likely to engage in UE activities than incorporated businesses;
- the non-profit and government sectors do not take part in underground activity;
- corporate investment in machinery and equipment as well as intellectual property is not subject to underground activity.
Assumptions like these are necessary, given the limited amount of direct information available on underground transactions. While debatable, they are considered reasonable for current purposes. If new information becomes available or more realistic assumptions are determined, they would be taken into account.
4.3 Data sources
Several data sources are used in this study. The Canadian System of National Accounts (CSMA) estimates are used extensively. Among them, the supply and use tables (SUT) are used to prepare all conversion matrixes relating industry information to household spending information. The Canadian productivity accounts are used to derive GDP by industry on a nominal basis. The income and expenditure accounts provide the time series for household spending and gross fixed capital formation (GFCF).
The Census of Population, Census technical reports and the SHS are used for households and dwelling estimates used in the estimation of rent and the analysis of UE spending on a household basis. The SHS is also used to validate skimming estimates for some categories of spending.
The provincial and territorial estimates for the illegal manufacturing of wine and the smuggling of spirits are calculated using the same methodology used to derive the national estimates. It is based on historical Liquor Control Board of Ontario (LCBO) estimates of illegal sales in Ontario weighted by the adult population of each province and territory. Currently, no other sources on estimates of illegal sales exist.Note As well, the illegal re-sale of legal liquor is not estimated as part of the UE. As new data sources become available, they could be incorporated in future studies.
The all-items consumer price index (CPI) is used to derive the threshold (in terms of gross business income at constant prices) that define “small” businesses in this study. It is used in conjunction with tax databases maintained at Statistics Canada. These databases pertain to unincorporated (from the T1 income tax form) and incorporated business (from the T2 income tax form) income tax returns. By using this tax information it is possible to obtain the operating revenues and operating expenses on a NAICS basis for businesses in Canada. These are used as the main input into the skimming estimates.
A tax audit data file for incorporated businesses showing the original information provided on the tax return and the latest information after all audits by the Canada Revenue Agency (CRA) is also available. This file is used to estimate reassessment rates by industry. The estimates derived from this file are used to obtain a better industry allocation of skimming.
5 Measurements of underground economy
The scope of the study for the underground economy in Canada, as indicated in Section 3, is limited to three areas: the hidden sector, the illegal sector, and the informal sector. This section is devoted to analysis and describes how estimates for each sector were conducted.
5.1 Measurement of the hidden sector
5.1.1 Skimming
The phenomenon known as ‘skimming’ occurs when legitimate businesses fail to declare part of their business income. Skimming occurs when firms underreport revenue or over report expenses. Businesses engaged in skimming are not necessarily operating underground like smugglers, and often do so without the knowledge of their customers. But skimming does constitute tax evasion, and it can lead to an underestimation of GDP at the margin, so it must be considered here.
What is at issue here is the small average underreporting of sales that could easily go undetected. A business may avoid declaring some receipts, but it will likely be detected if it hides too much income, in relation to its operating costs or in comparison to other businesses. Similarly, in the national accounts, since the total supply of a commodity or product is equal to the total demand in the SUT, a large and systematic underreporting of sales would also be detected and corrected. More information is available in Appendix 1: Skimming at the margin compared to statistical imbalances.
Skimming can be determined through audits conducted by the tax authorities over many years, to which Statistics Canada has access.Note Changes such as electronic invoices that were introduced in Canada could prevent skimming.Note The introduction of value-added taxes like the GST/HST was also meant to make skimming more difficult, or at least less attractive for businesses, which need to collect GST/ HST on their sales to credit against GST/HST paid on their intermediate purchases.
Skimming is more likely to occur in small businesses. It seems unlikely, but not impossible, that large businesses would engage in skimming. It would be complicated for large organizations, often provincial or national in scope, with hundreds or thousands of employees, to do so. Moreover, incorporated businesses are subject to more regulations and have more “checks and balances” than unincorporated businesses. Hence, skimming is believed to be more likely to take place among unincorporated businesses.
Understatement of business receipts does not necessarily translate into an underestimation of GDP. Businesses selling to other businesses (intermediate demand) rather than households (final demand) may engage in skimming. However, at the intermediate level, the practice is probably much less common, because one firm’s revenue is another’s expense, and this second firm needs a receipt for its accounts. More fundamentally, regardless of how firms account or do not account for their purchases, they will pass on all their costs (whether in the books or off the books) to their customers. The market price of goods and services sold to consumers automatically embodies all the skimming that may have gone on at the intermediate level. Intermediate skimming is not missing in GDP any more than intermediate sales. If it were to be treated as missing production and added to the total, part of the economic production would be counted twice, or more.
Only skimming of receipts by businesses selling to households can lead to an underestimation of GDP and needs to be estimated. This is illustrated in Appendix 2: Illustration of the effect on GDP of skimming between firms and skimming on final sales.
To summarize the key assumptions made in this study regarding skimming:
- skimming occurs only in small businesses;
- skimming does not occur in highly regulated sectors, such as sales of electricity;
- skimming is more likely to occur in the services sector than the goods sector;
- skimming is more likely to occur in unincorporated businesses than incorporated businesses;
- skimming affecting the estimation of GDP is only related to sales to households.
The starting point in the estimation of skimming is the total operating revenues of small businesses. In this study, “small” businesses are defined to include incorporated and unincorporated businesses with annual total operating revenues of less than $2 million (in 1992 dollars).Note Total operating revenues are composed of three components: rental and leasing revenues, total sales of goods and services, and the total of all other operating revenues; all three are derived from tax files. For unincorporated businesses, T1 data are available on a NAICS basis from 2005.Note For incorporated businesses, T2 data are available on a NAICS basis from 1997.Note All NAICS codes are normalized to the NAICS 2017 classificationNote which forms the basis of the Input-Output Industry Classification (IOIC 2016) system in the CSMA.
Skimming rates on household spending categories were set as follows:
- 0% for categories estimated with independent methodologies (tobacco, imputed rent);
- 0% for categories where skimming is very unlikely because activity is highly regulated or because of the nature of the services (e.g., electricity, gas, water supply, hospital services, new cars and trucks, most of the transportation services, telecommunication services, cinemas, games of chances, most of the insurance and financial services);
- For some categories, skimming rates were not standard because only a portion of the category is subject to skimming (out-patient services (2.2%), other actual financial charges (11.5%), legal and other services (11%), and pharmaceutical products (5.5%);
- Other non-standard skimming rates were used for taxi services (17%) and food and non-alcoholic beverages (30%) based on analysis done in previous studies;
- The standard rate for the remaining goods categories was 15.5% (40 categories);
- The standard rate for the remaining service categories was 22% (22 categories).
While the standard rates are slightly different than used in previous studies, they still represent reasonable upper bounds on the skimming that could be present in the remaining categories of goods and services purchased by households.Note
5.1.2 Construction
Construction-related economic activities are captured in the CSMA. One way to assess the completeness of the national accounts estimates for residential construction (new construction and renovations) is to compare them to sales of lumber and building material dealers (as a proxy for the total use of lumber and building materials). The ratio of one to the other gives an approximation of the building materials content of residential construction.
As sales of lumber and building materials are reliably captured in the statistical system, a plausible and relatively stable ratio of materials to output implies that the measured output is also plausible. Many factors contribute to marginal increases and decreases in the material content observed over the years.
First, in periods of downturn, building contractors are forced to reduce their margins or risk bankruptcy. This would lead to an increase in the material content ratio. In addition, homeowners, overall, would have less money to spend on renovations and have more time to do work themselves. This would also lead to an increase in the material content ratio. The reverse is true in periods of upturn.
Second, an increase in the material content may indicate that underground transactions are growing: sales of building materials are well captured, but contract and labour costs could be increasingly ‘missed’. Other things being equal, a higher ratio suggests that some output may be missing.
CSMA official estimates of gross fixed capital formation in construction are fairly reliable regardless of underground activity because they are largely independent of the receipts declared or reported by businesses and self-employed workers in the industry. However, the possibility that some underground transactions in construction are still missing from GDP cannot be ruled out. These transactions may occur in three areas: new construction, renovations and alterations, and ownership transfer costs.
The ownership transfer costs relate to the resale of dwellings, and include items such as GST, land transfer taxes and real estate commissions.
In the CSMA, real estate commissions annual benchmarks have been established using the Annual Survey of Service Industries: Real Estate Agents, Brokers, Appraisers and Other Real Estate Activities and the SHS. Estimates of real estate commissions are also based on the monthly report of listings through the Multiple Listing Service (MLS) of the Canadian Real Estate Association. This report provides monthly data, by province, on the number of houses sold and their average selling price.
In the absence of direct information on commissions actually received and because the extent of commission discounting is not known, estimates in this area may be on the high side. In this study we assume that real estate commissions are well covered by the current approach used in CSMA and that there is no need to incorporate an additional adjustment. As a result, a 0% skimming rate is applied to the ownership transfer costs. For this reason, this study only focuses on the first two areas: new construction, renovations and alterations.
One point should be clarified at the outset. Spending by homeowners and landlords on minor repairs and maintenance is treated as an intermediate expense, not as gross fixed capital formation, in the national accounts. It is offset against gross rents in the calculation of net rental income. Any underestimation/overestimation of spending on repairs by landlords and homeowners translates into an overestimation/underestimation of net rental income, leaving GDP unchanged. At issue here, therefore, are only underground transactions related to investment in construction.
New residential construction
In the CSMA, the estimation of the value of new construction combines housing starts, average values of building permits and work put in place coefficients. The latter measure, by month of start, province and type of dwelling (single dwellings, semidetached dwellings, row housing and apartments), and the volume of work on an average ‘start’ usually carried out in each construction period. In the case of single dwellings, 50% of the work is normally done in the first quarter, about 40% in the second quarter, and the remainder, in the third quarter after the start. The value of work put in place in a given period is calculated by multiplying these coefficients by the value of housing starts (itself derived as the product of the number of starts and average building permit values) for that period and previous periods, and summing the results. The value of construction work on conversions (from one type of dwelling to another) and on cottages is based on building permits, and that of mobile homes, on manufacturers’ shipments. Finally, an estimate of costs other than for the construction itself (legal, architectural and mortgage fees, land development fees imposed by municipalities and GST), not reflected in building permit values, is added on separately.
In this study data for the GFCF (i.e., capital investment) developed by the National Economic Accounts Division within Statistics Canada is used to estimate the underground GDP created by new residential construction. It includes ten components, listed below along with the corresponding skimming rate:
- Single dwellings: 10%
- Semi-detached dwellings and row housing: 5%
- Apartments: 5%
- Government residential construction, including First Nations: 0%
- Non-profit institutions serving households (NPISH): 0%
- Cottages: 25%
- Conversions: 200%
- Mobile homes: 10%
- Supplementary costs: 10%
The underestimation could be much higher for conversions from one type of dwelling to another (from a single to duplex and vice versa, and ‘winterization’ of cottages for example). Municipalities do not have as good a yardstick to judge the construction costs being reported: few permits of this kind are issued and the work is less standardized than for new dwellings. On the other hand, many municipalities have inspectors who verify some of the work undertaken for compliance with building codes and standards and for assessment purposes, so that those who do request a permit may understate their costs, but again only up to a point. The problem is that there is no way to estimate the construction work carried out without a permit. Unlike new dwellings, conversions can be hidden. What is lacking in this instance is a reliable volume measure equivalent to housing starts.
A ratio of two hidden conversions for a reported one is conceivable. Although there are no other statistics to go by, the hidden conversion, usually the addition of an apartment, is probably one where the average cost of the work is lower since it is on a smaller scale than the conversion of a double dwelling into a single one. It is more difficult to hide a large-scale conversion from municipal inspectors. If this is the case, a hypothetical adjustment of 200% would actually reflect a ratio of hidden to reported conversions higher than two to one, and could be considered an upper limit.
In addition, some supplementary costs do not give rise to underground transactions (GST, land development fees, mortgage fees and insurance). The other costs under that heading (essentially legal and architectural fees and surveying costs) are mainly incurred for new dwellings and probably not subject to widespread hidden transactions. They are estimated as a percentage of the value of construction work put in place and as a result could be underestimated in the same proportion, roughly by 10%.
Renovations and alterations
The SHS is the main source of information used to produce estimates of renovations and alterations.Note The results from this survey are examined in light of other indicators such as renovation permits and sales of building materials and loans outstanding for renovations of residential property.Note
For the purpose of producing UE estimates, ratios describing the allocation of renovations and alterations between various groups of households are still used. Homeowners account for over 93% of this type of spending, followed by landlords (over 3%) and cottage owners and tenants for the remainder.
The following upper bound assumptions are used on the contract work portion of the renovations and alterations estimates of the CSNA. For homeowners, 20% of contract work could be hidden. The same proportion is used for vacation homes while an upper bound proportion of 10% is used for tenants and landlord renovations.
This percentage may not seem very high. One must keep in mind though that a portion of what is reported for contract work is spent on building materials. The implied underreporting of the value added (wages and profit) in contract work under this assumption would thus be higher than 20% on average, and this percentage is applied to amounts reported by homeowners, not by contractors.
Incorporated and unincorporated construction
Thus far all construction-related estimates presented are based on the types of construction, and no distinction is made between incorporated and unincorporated construction. To this end, tax data (T1 and T2) for the residential construction industry is added to the database to calculate incorporated and unincorporated new construction, renovations and alterations.
Specifically, business operating revenues of less than $2 million are adjusted by applying CPI and adjustment factors to T1 and T2 data, and then applying a skimming rate of 21.65% for T1 data, and 10.83% for T2 data.
As explained above, the underground economy GDP is presented in three approaches. The only industry-based series associated with construction are for pre-fabricated homes (or mobile homes). To split the estimate for the mobile homes into relevant industries, such as forestry and logging, sawmilling and wood production, etc., shares of industries which manufacture mobile homes are calculated based on the SUT, then applied to the estimate of mobile homes.
5.1.3 Hidden rent, rooming and boarding
Rent
In GDP, rents are calculated as the product of the average rent and the rental housing stock. Any undercount in the stock will lead to an understatement of rents. Such an undercount may be related to the underground economy when apartments are overlooked by census enumerators because they were purposely hidden (dwellings with a concealed entrance or no separate entrance, for instance) by owners who rent them on the black market. How can the number of these purposely hidden rented dwellings be approximated?
The upper-limit approach is used to estimate the value of rents that could result from underground economic activity. The starting point is to calculate the maximum number of rented dwellings and to subtract from it the number of rented dwellings used for the rent estimates in the official economic accounts. The difference is then multiplied by an average rent to produce the value of the rents that could have been paid on the black market.
However, these hidden rented apartments are located in houses erroneously enumerated as single dwellings or duplexes and counted in the stock of owner-occupied dwellings. The rent imputed to an owner-occupied dwelling in the national accounts is deemed equivalent to the average rent for a tenant-occupied dwelling, adjusted by a coefficient reflecting the difference in the average area and quality of each type of dwelling. The coefficient attributed to houses with a hidden apartment in the basement or on the upper floor would have been too high, and their imputed rent must therefore be reduced to derive the overestimate of imputed rents.
Finally, the difference between the underestimate of paid rents and the resulting overestimate of imputed rents is not included in the GDP. The process of estimating rents paid for dwellings rented on the black market begins with the number of missed dwellings. There are three sources of information on the number of households in Canada: the Census of Population, the SHS, and the Centre for Special Business Projects (CSBP).Note The census estimates are never revised, although post-census studies provide a fairly precise measurement of the undercount. The household estimates from the SHS go back to 1997 and cover the whole of Canada for some years and only the provinces for other years. The estimates from the CSBP are based on information about dwellings in Canada. This source is used in calculating rents for the economic account estimates.
To determine the upper limit for rented dwellings, we used the higher of the census count of households adjusted for undercoverage and the estimate from the SHS.
The overall undercoverage rates for the 1991 and 1996 censuses were 2.2% for Canada, with substantial variation among the provinces. For 2001, the difference between the SHS and the Census was 2.3%. For 2006, the SHS estimate did not cover all of Canada, but a reasonable estimate yields an undercoverage rate of 2.8%.
For estimation purposes, household time series were estimated for each province and territory between 1991 and 2021. The number of missed households was estimated by subtracting the capital stock estimates used in the economic accounts from the upper limit estimates. The number of missed renter households was estimated with the ratio of missed renter households to total missed households from the Census. That ratio, 77%, was used for all years, provinces and territories.
To calculate the understatement of rents due to underground transactions, the number of purposely hidden rented dwellings is simply deemed equal to half of the estimated number of missed renter households. This is certainly an upper limit, since nearly 40% of missed households were living outside census metropolitan areas, where covert rentals would probably be rare. In addition, a large number of dwellings were probably missed simply by mistake, while the assumption made here is that they were missed because they were purposely hidden.
The stock of hidden rented dwellings is multiplied by an average rent, which is set, as an upper limit, at 90% of the average space rentNote to reflect the fact that these dwellings are small apartments usually rented below the market rate. This yields the potential understatement of paid rents.
As previously mentioned, these hidden rented apartments are located in houses erroneously enumerated as single dwellings or duplexes and counted in the stock of owner-occupied dwellings. Consequently, the space coefficient attributed to houses with a hidden apartment in the basement or on the upper floor would have been too high, and their imputed rent must therefore be reduced by about 30% to derive the overestimate of imputed rents. The adjustment coefficient used is based on the average number of rooms for rented dwellings and owner-occupied dwellings from the Census, for the provinces and territories.
The net effect of the potential understatement of rents due to covert rentals is calculated as the difference between the underestimate for missed dwellings and the overestimate of rents imputed to owner-occupied dwellings.
Rooming and boarding
Rooming and boarding could also be subject to the underground economy. Similar to the UE rental estimates, the average market rent for a room is likely higher than the average rent imputed per room in owner-occupied dwellings. Any increase in spending on “rooming and boarding” to account for hidden rentals would be partially offset by a drop in imputed rent on owner-occupied dwellings. Assuming the offset is about 75%, this leave only a 25% mark-up of the landlord to be added to GDP.
An upper limit this study is assuming that “rooming and boarding” could be underestimated by 50% and that 40% of rooming and boarding is the result of homeowners’ activities. In addition, it is assumed only 25% of homeowners’ hidden rooming and boarding activity enters GDP.
5.1.4 Undeclared tips
Tips estimated in this study are in addition to those already included in the official CSMA numbers. Estimates of tips in the official statistics are derived first by using administrative and survey sources of information. However, it is believed that these include only a portion of the total tips paid or received in the Canadian economy. Consequently, another adjustment to account for the missing portion of tips is made in the CSMA official estimates. This adjustment is derived by applying fixed percentage “tipping rates” to specific gross business receipts. As an example, a tipping rate of 10% is applied to gross receipts from “Taxi and limousine services”.
The tips are estimated from the following services and occupations:
- Food and non-alcoholic beverage services (C22111);
- Alcoholic beverage services (C22112);
- Household expenditure, licensee mark-up on contraband spirits;
- Household expenditure, licensee mark-up on illegal wine;
- Accommodation services (C22211);
- Personal grooming services (C24111);
- Other personal effects (C24221);
- Taxi and limousine (C17323).
Two assumptions are made. The first is that there are undeclared tips on incomes from services that are not reported. It is related to skimming. Therefore, the skimming which occurred in these services and occupations are the foundations of the assessment of tips undeclared. The second one is that there are undeclared tips on reported and unreported income earned from occupations where tips contribute a significant portion of total income.
For the first assumption, a standard 10% tipping rate is set for all the services listed above except accommodation, which is set at 3%. These rates are applied to the corresponding estimates of skimming obtained in 5.1.1 to obtain undeclared tips on incomes from services that are not reported. For the second assumption, a rate of 20% as a potential undervaluation of revenues associated with skimming occurring in services listed above is calculated as tips on unreported income. These two types of tips together constitute total tips derived for the underground economy.
As mentioned above, tips are captured in the official GDP estimates although likely not in their entirety. In this study, therefore, tips over and above the amount already included in official statistics are calculated to obtain an upper bound. From this perspective, estimated tips may not be interpreted as a complete loss to official GDP.
To calculate and report tips for the GDP by industry approach, household final consumption expenditure categories codes are used to allocate Accommodation services to Accommodation industry (BS721100), Personal grooming services and Other personal effects to Personal care services industry (BS812A00), Taxi and limo service to Taxi and limo service industry (BS485300). Parts of Food and non-alcoholic beverage services and Alcoholic beverage services are allocated to Accommodation industry, and the rest, combined with Household expenditure, licensee mark-up on contraband spirits, and Household expenditure, licensee mark-up on illegal wine is allocated to Food services and drinking places industry (BS722200).
5.1.5 International trade
Merchandise exports may be underestimated through smuggling or through undervaluation of declared transactions. However, there are few goods or services for which underground transactions relating to exports are evident or suspected, and there would appear to be no example of a Canadian product smuggled out of the country on a large scale.Note
The upper bound method is used to estimate underground activities related to a selected group of international exports. For merchandise trade, goods typically exported by very large businesses or traded at international prices are deemed not to be subject to underground transactions.Note In 2022, these goods accounted for about 81.5% Note of Canada’s exports and involved energy products; metal and non-metallic ores, mineral and products; chemical, plastic and rubber products; forestry products; industrial machinery; electronic and electrical equipment and parts; motor vehicles and parts; aircraft and other transportation equipment and parts; special transactions trade. This leaves a group of commodities where some underground transactions could take place.
The assumption is that exports in this group of commodities could be undervalued by 5% at most. These commodities are:
- Farm and fishing products [C111];
- Intermediate food products [C112];
- Food, beverage and tobacco products [C221];
- Cleaning products, appliances, and miscellaneous goods and supplies [C226].
Trade in services comprises four categories: travel, transportation, commercial services and general governments’ services. It is assumed that there is no underground economic activity on government services. The same assumption is made for transportation because international transport is highly regulated and mostly done by large businesses. There could be some underground economy in the travel exports, but these are not identified here and, instead, are embedded in the estimation of skimming. The last category, commercial services, includes a wide variety of services, provided by small and large businesses, often for custom-made services that are not readily identifiable commodities. As such, commercial services, is a category of export transactions lending itself to some underestimation due to underground transactions, through non-reporting or undervaluation. Within that group, most of the market belongs to large, well-established and often regulated companies engaged in the trade of “standardized” commodities.Note It is assumed in this study that there is no underground economy on this subset of commercial services. This leaves a group of commercial services where some underground transactions could take place because service receipts are deemed easier to hide.
As in the trade of merchandise, the upper bound method is also used to estimate underground activities related to a selected group of international service exports. The upper bound assumption is that exports in this group could be undervalued by 10% at most. These commodities are:
- Maintenance and repair services;
- Construction services;
- Non-financial commissions;
- Advertising and related services;
- Research and development;
- Miscellaneous services to business;
- Other personal, cultural and recreational services.
Based on these assumptions, the underground economy estimates for the trade of goods and services are obtained by multiplying international exports of the four goods listed above by 5%, and of the seven types of services by 10%Note . Internal provincial and territorial shares are then applied to published national estimates to obtain estimates by province and territory. To attribute the estimates of commodities and services to specific industries, an allocator from commodity to industry is calculated and applied, which derives underground economy estimates by industries.
Whether on transactions on goods or on services, transfer pricing is sometimes mentioned as a source of underground transactions. Transfer prices are prices at which services, tangible property, and intangible property are traded across international borders between related parties. Transfer pricing is used by companies to manage profit and loss ratios within the company. The rules governing the transfer pricing are set up by taxation authorities, but the general idea is that transfer pricing can be used if the price reflects the fair market value of a particular item. As such, transfer pricing is legal and does not constitute an instance of underground production. However, “wrongful” transfer pricing motivated by the need to shift profits abroad would fall under the “underground economy” category. Transfer pricing of that sort is beyond the scope of this study.
International trade involves both exports and imports. In Canada the only legal goods smuggled into the country in sufficient volume to be worth considering are tobacco, alcoholic beverages, internet postal trade and precious jewelry. Imports of goods are understated, at a minimum, by the value of the tobacco and alcohol smuggled into the country. But this understatement, in itself, does not necessarily have an incidence on GDP. Imports do not enter GDP, because they are not part of domestic production, they are a deduction against GDP on the expenditure side.
This does not mean that the omission of the value of smuggled goods has no impact on GDP, but rather that this value itself is not missing from GDP. Consider the impact of a smuggled product on GDP. The black market value of the product is omitted from household final consumption expenditure and their import value is omitted from imports. Since household final consumption expenditure enters GDP with a positive sign, and imports, with a negative sign, what is missing in GDP due to smuggling is the difference between black market value and import value, that is, the aggregate mark-up or profit of the smugglers and sellers. The same reasoning can be applied for undeclared cross border shopping, but in this case there would be no mark-up to include in GDP. Hence cross-border shopping does not lead to an underestimation of Canada GDP.Note
For alcohol, imports are estimated at half the illegal operations revenues on spirits. For tobacco, the estimates of illegal imports are obtained directly from CSMA; these are estimated as the difference between the total number of illegal cigarettes sold in Canada and the Canadian production for which no taxes were paid.
5.2 Measurement for the illegal sector
5.2.1 Tobacco
Since the beginning of the 1990s, the CSMA has explicitly included estimates for underground activity related to tobacco products. Expenditure on cigarettes and other tobacco products (cigarette tobacco and papers, cigars, pipe tobacco, e-cigarettes, chewing tobacco and snuff) include not only legal purchases (that is, purchases for which all taxes were collected by manufacturers, distributors and merchants and were remitted to the administrative authorities concerned), but also expenditures attributable to contraband activities.
The estimation of official household final consumption expenditure on tobacco products (legal and illegal) on an annual basis, results from a reconciliation exercise between several data sources from both the supply and the demand side. Among the main sources on the demand side are the Canadian Tobacco and Nicotine Survey (CTNS), population estimates and the SHS. On the supply side, the main data source consists of the domestic sales and duty-free sales reported by the Production and Disposition of Tobacco Products survey (PDTPS). This is supplemented by declared international imports, obtained from the International Trade program. In addition, the data are confronted with the Retail Commodity Survey (RCS).
The first step of the methodology is the estimation of the total volume of tobacco products consumed in Canada and by province using the smoking prevalence data from CTNS and the smoking population estimates. This volume is expressed in terms of cigarettes.
The second step of the methodology is the calculation of the total volume of legal tobacco products consumed using data from PDTPS and smoking population estimates. This volume is expressed in terms of cigarettes. These estimates are compared with the SHS for trend analysis.
The total volume of illegal tobacco products consumed is obtained by subtracting the total volume of tobacco products by the total volume of legal tobacco products.
Finally, consumer unit prices are used to inflate the volume estimates into nominal estimates for legal and illegal tobacco. Consumer unit prices are derived by applying CPI index to legal prices and illegal prices (originally obtained from various sources including media reports and press clippings).
5.2.2 Alcoholic beverages
Underground transactions in this area are the illegal manufacturing of wine and the smuggling of spirits. Lower taxes and higher transportation costs make the smuggling of wine, beer and coolers unprofitable. Contrary to cigarettes, the smuggled spirits are not generally produced in Canada and therefore the volume estimates of the contraband are more speculative. The same is also true of illegally manufactured wine.
The estimation approach is as follows: Starting from LCBO estimates of the volume of illegal sales in Ontario, a volume of illegal sales for Canada is derived based on the adult population.Note Then this estimate is converted to monetary terms using a price that is 60% of the selling price before HST, GST and PST.Note The nominal sales are then split between sales to consumers and sales to licensees.Note For the latter, a mark-up is applied. The sum of sales to consumers plus sales to licensees (including mark-up) constitutes the effect on the household spending portion of GDP due to illicit alcohol sales. The final effect on GDP is obtained by removing the proportion of illicit sales that are obtained from imports (not part of Canadian production). The licensees mark-up is estimated at 300% for spiritsNote and 200% for wine. The lower mark-up for wine reflects the stronger competition from low-cost wine. As mentioned in the first paragraph, imports are only applicable to spirits and are estimated at 50% of its black market value. It is assumed that there are no illegal sales of beer and coolers.
5.2.3 Cannabis
Illegal Cannabis is estimated residually as the difference between total cannabis consumption and legal consumption.
Total cannabis consumption is derived from Health Canada’s Canadian Cannabis survey and Statistics Canada’s National Cannabis survey. Estimates of total consumption before legalization come from Statistics Canada research, namely the paper “Experimental estimates of cannabis consumption in Canada, 1960 to 2015” by Macdonald and RotermannNote , as well as other academic and government sources.
Legal estimates of consumption are derived from administrative data from Health Canada and Retail Sales data from the Monthly Retail Travel survey. The residual from total consumption less legal consumption gives the illegal consumption remainder, which is what is used in this study.
The residual calculations is done at the volume of consumption level, and prices are added to produce current dollar estimates.
5.3 Measurement for the informal sector
The informal sector measured in this study includes home-based childcare services, private household services, other personal care services and direct sales of agricultural products. These are estimated by upwardly adjusting ratios that are used to calculate skimming, in industries where the informal sector could be present.
6 The three measures of GDP
The objective of this study is to measure GDP generated by the underground economy in Canada using the upper bound method and other approaches.
GDP generated by the underground economy is measured using three approaches: expenditure-based, income-based and industry-based. First, the expenditure-based approach consists of summing the final expenditures on goods and services (household and government final spending, business investment outlays, and net exports). Second, the income-based approach consists of summing all the factor incomes (compensation of employees, gross operating surplus, and mixed income) generated in the production process plus net taxes on products and on production. Third, the industry-based (or value-added) approach consists of measuring the total production of each industry and removing the cost of intermediate inputs. Taxes less subsidies on products are then added to obtain GDP at market prices.
All three approaches generate the same value of underground economy GDP. In cases of discrepancies, values are benchmarked to the expenditure-based approach.
6.1 Expenditure-based underground economy GDP
Expenditure-based GDP is a combination of household final consumption, government final consumption, gross fixed capital formation, and net exports, that is, exports minus imports.
Section 5.1.1 explained that the measurement of underground economy for skimming is directly linked to household expenditure. For facilitating compiling and reporting expenditure-based GDP, all final consumption expenditure items are grouped in four categories.Note Durable goods (e.g., vehicles, furniture, appliances), semi-durable goods (e.g., clothing and footwear, household furnishings), non-durable goods (e.g., motor fuels, energy, food, beverages and tobacco, cannabis) and services (e.g., rent, restaurants, health, education, recreation).
Durable goods and semi-durable goods are completely reported from the estimates of skimming activity. Non-durable goods are a combination of estimates of skimming, alcohol, tobacco, and cannabis. Services are compiled from the services category in the skimming activity. Tips and rents are completely assigned to services.
In this study, it is assumed that the final consumption coming from governments as well as non-profit institutions serving households is not subject to underestimation; therefore, it is excluded from this measurement. In other words, its contribution to underground economy GDP is set to zero.
In the CSMA, the gross fixed capital formation is composed of residential construction, machinery and equipment, and intellectual property. Residential construction is considered a prime area where underground transactions occur, while the other two areas are assumed to have no underground economic activity.
For the purpose of this study, there is underground economic activity in the international trade of alcohol, tobacco and cannabis.
6.2 Industry-based underground economy GDP
Industry-based underground economy GDP estimates are compiled and reported using a direct allocation for some specific cases and using a confrontation and reconciliation approach for the skimming portion.
6.2.1 Direct allocation
Tobacco-related activities are allocated between the retail trade industry and manufacturing industry. Specifically, 20% of the estimate of tobacco is allocated to the non-store retailers industry, and 80% goes to the beverage and tobacco product manufacturing industry.
Illegal alcohol-related activities are mainly due to imports and redistribution. The estimates are thus mostly allocated to retail trade and the accommodation and food services industries. A small portion (20%) related to wine production is allocated to wineries and distilleries.
Rent and rooming and boarding are entirely allocated to the owner-occupied dwelling industry.
Undeclared tips arising from Taxi and limousine services are allocated to the transportation industry (taxis) while the undeclared tips attributed to Traveler accommodation and Food services and drinking places are allocated to the accommodation and food services industry. Undeclared tips related to personal services and other personal care services are allocated to the “Other services (except public administration)” industry.
Residential construction is almost entirely allocated to the “residential construction” industry with a small portion allocated to manufacturing; this portion relates to mobile home underground economic activities.
Exports were originally estimated by commodity as explained in the previous section. The allocation by industry was done using internal information derived by the Industry Accounts Division of Statistics Canada.
6.2.2 Allocation of skimming estimates
The estimates of skimming by industry rely on the same tax data as used to estimate skimming by household spending category, that is, unincorporated businesses (T1) data and incorporated businesses (T2) data. The operating revenues of small businesses (defined as incorporated and unincorporated businesses with annual operating revenues of less than $2 million (in 1992 dollars) were calculated by industry, and modified using adjustment factors similar to those used in estimating skimming by household spending category.
Two sets of ratios are then applied, separately for incorporated businesses and unincorporated businesses. The first set identifies which portion of the industry operating revenues stems from household spending. The second set gives upper bound “skimming ratios” which vary by industry and legal status (i.e., whether the businesses are incorporated or not). Applying these two ratios and adding the results for incorporated and unincorporated businesses produces the estimates of skimming by industry.
The first set of ratios is calculated using information derived from the SUT tables and is explained in Section 5.1.1. The second set of skimming ratios for small businesses is determined as follows:
- no skimming is assumed for most of mining, manufacturing, energy distribution industries, telecommunications and data processing, most of the financial services industries and offices of dentists and physicians;
- no skimming is assumed for non-profit organizations and government services;
- in cases where there is a specific methodology and allocation is done directly, like rent and construction, no additional skimming is assumed;
- selected agricultural industries and selected manufacturing industries producing dairy products, beer and wine to account for direct sales of food: 20%;
- retail sector industries: 15%;
- transport services industries: 25%;
- most professional services: 5%;
- repairs services and services to private household: 30%;
- most of the remaining services: 25%.
The rates above apply to small unincorporated businesses. The rates assumed for small incorporated businesses were half these amounts. The skimming rates applied to industries are not the same as the skimming rates used in the final household expenditure categories. To ensure skimming estimates calculated in the industry approach are identical to those of the expenditure approach, skimming estimates by industry were benchmarked to skimming estimates using the expenditure approach.
Tax reassessment data were used to confront and validate the industry distribution of skimming resulting from the use of the T1 and T2 data and ratios described above.
The tax data file used contained various types of reassessments.Note For this study, only the reassessments from audits and investigations were used. Moreover, only records that had the expected outcome for the underground economy were kept, meaning only those cases where income was adjusted up or where expenses were adjusted down as a result of the audit, were retained. In cases where income was reduced or expenses were adjusted up, that is, where the audit was to the advantage of the taxpayer, it was assumed that these were not instances of underground activity but rather errors on the part of the tax filer. Records where no changes occurred were kept in order to calculate the percent change in revenues and expenses after the reassessment of the tax return.
The reassessment data by industry are in some cases highly variable from year to year since a large reassessment case in a given industry can change the industry totals considerably. Extreme cases were thus limited to a maximum understatement of revenues or overstatement expenses of 5% since the aim was to estimate skimming.Note Also, to compensate for the limited number of observations, a four-year moving average reassessment rate was calculated for each industry.
As throughout the study, the rate for unincorporated businesses was assumed to be double that of incorporated businesses. These rates were applied to GDP estimates by industry split out, for the purposes of this study, into parts attributable to incorporated and unincorporated businesses and to small and large businesses. This was done using the operating revenues from the T1 and T2 tax files. The result of these calculations was an alternative industry distribution of skimming based on the tax audit files.
It should be noted that the calculated reassessment rates are probably on the high side because the population of filers audited by CRA is not selected in a random manner. In fact, certain industries and other outliers are targeted for re-assessment.Note On the other hand, some underground operators may have not filed any tax records and therefore would be completely excluded from this sample. This population would likely be small and their economic activity insignificant, otherwise they would be detected.
The two estimates were reconciled as follows:
- the reassessment estimates were taken “as is”;
- the total of skimming by industry minus reassessment estimate is calculated; and
- the total is then allocated using the skimming by industry distribution.
6.3 Income-based underground economy GDP
As mentioned in Section 5.1.1, income-based GDP is derived from adding all factors incomes plus the net taxes on products and on production. Neither the expenditure-based GDP nor the industry-based GDP estimates provided information on factors’ incomes and taxes. To compile income-based underground economy GDP, a few allocation assumptions are made based on expenditure-based estimates. Table 1 shows these assumptions.
| UE GDP, expenditure-based components | UE GDP, income-based components | ||
|---|---|---|---|
| Compensation of employees | Operating surplus | Mixed income | |
| percentage | |||
| Household final consumption expenditure | Note ...: not applicable | Note ...: not applicable | Note ...: not applicable |
| UE tobacco | Note ...: not applicable | Note ...: not applicable | 100 |
| UE alcohol | Note ...: not applicable | Note ...: not applicable | 100 |
| UE cannabis | Note ...: not applicable | Note ...: not applicable | 100 |
| UE rent, room and board | Note ...: not applicable | Note ...: not applicable | 100 |
| UE tips | 100 | Note ...: not applicable | Note ...: not applicable |
| Skimming of receipts selling to household | Note ...: not applicable | Note ...: not applicable | Note ...: not applicable |
| Unincorporated | 50 | Note ...: not applicable | 50 |
| Incorporated | 50 | 50 | Note ...: not applicable |
| Business gross fixed capital formation | Note ...: not applicable | Note ...: not applicable | Note ...: not applicable |
| Residential construction | Note ...: not applicable | Note ...: not applicable | Note ...: not applicable |
| Unincorporated | 50 | Note ...: not applicable | 50 |
| Incorporated | 50 | 50 | Note ...: not applicable |
| Exports of goods and services | 50 | 50 | Note ...: not applicable |
| Imports of goods and services | Note ...: not applicable | Note ...: not applicable | 100 |
|
... not applicable Source: Statistics Canada. |
|||
Appendix
Appendix 1 Skimming at the margin compared to statistical imbalance
Let us consider the example of household furniture retailing and assume for simplicity that there is no household furniture wholesaling. As the manufacturing, imports and exports of household furniture are reliably measured, if household furniture retailers in the aggregate were understating their sales by too much, say 25%, total demand (retail sales plus exports) would be much lower than total supply (production plus imports plus margins). Part of the imbalance could be resolved by increasing inventories, but only up to a point. If business were flourishing (other sources like the SHS may confirm the higher demand) and estimates on the supply side were believed to be reliable, the imbalance would be corrected by increasing domestic sales or inventories on the demand side rather than by recording a loss for the industry as a whole on the income side. In this instance, balanced version 2 in the table below would likely be adopted because it is more realistic.
Such imbalances are a common occurrence in the construction of input-output tables. Most of them reflect errors of transcription or tabulation, and problems of classification, valuation, timing or coverage affecting the estimates both on the demand and the supply side. The cross-checking inherent in the approach yields sound results, notably for goods, and helps to resolve some inconsistencies, but not all. This approach is particularly effective at the economy-wide level, but a small average underreporting of sales could easily go undetected, and result in the estimation of a lower surplus or higher inventories than would otherwise be the case.
| Statistics Originally Recorded | Balanced Supply and Demand | ||
|---|---|---|---|
| Version 1Explanatory table 1 Note 1 | Version 2Explanatory table 1 Note 2 | ||
| dollars | |||
| Total Domestic Supply | 150 | 135 | 150 |
| Production | 100 | 100 | 100 |
| Imports | 30 | 30 | 30 |
| Transport Margins | 10 | 10 | 10 |
| Profit | 10 | -5 | 10 |
| Total Demand | 125 | 135 | 150 |
| Exports | 10 | 10 | 10 |
| Domestic Sales | 100 | 100 | 125 |
| Inventories | 15 | 25 | 15 |
|
|||
Appendix 2 Illustration of the effect on GDP of skimming between firms and on final sales
Case 1: No skimming, all information reported correctly – GDP correctly measured
Case 2: Skimming on intermediate sales between Firm 1 and Firm 2 – GDP not affected by skimming
Case 3: Skimming on final sales by Firm 2 – GDP underestimated due to skimming
| Statement of results - two firms economy | Case 1: No Skimming, all information reported - GDP measured correctly | Case 2: Skimming on intermediate sales between firm 1 and firm 2 - GDP not affected by skimming | Case 3: Skimming on final sales by firm 2 - Underestimation on GDP due to skimming |
|---|---|---|---|
| dollars | |||
| Firm 1 | |||
| Exports | 10 | 10 | 10 |
| Domestic Sales | 90 | 80 | 90 |
| Sales to consumers | 70 | 70 | 70 |
| Sales to firm 2Explanatory table 2 Note 1 | 20 | 10 | 20 |
| Total sales | 100 | 90 | 100 |
| Imports | 70 | 70 | 70 |
| Wages | 20 | 20 | 20 |
| Total Costs | 90 | 90 | 90 |
| Profit | 10 | 0 | 10 |
| Firm 2 | |||
| Exports | 15 | 15 | 15 |
| Domestic Sales | 60 | 60 | 50 |
| Sales to consumersExplanatory table 2 Note 2 | 60 | 60 | 50 |
| Sales to firm 1 | 0 | 0 | 0 |
| Total sales | 75 | 75 | 65 |
| Goods from firm 1Explanatory table 2 Note 1 | 20 | 10 | 20 |
| Imports | 10 | 10 | 10 |
| Wages | 15 | 15 | 15 |
| Total Costs | 45 | 35 | 45 |
| Profit | 30 | 40 | 20 |
| GDP calculations | |||
| Expenditure-based | |||
| Consumption | 120 | 130 | 120 |
| Exports | 25 | 25 | 25 |
| Imports | -80 | -80 | -80 |
| GDP | 75 | 75 | 65 |
| Income-based | |||
| Labour compensation | 35 | 35 | 35 |
| Operating Surplus | 40 | 40 | 30 |
| GDP | 75 | 75) | 65 |
| Industry-based | |||
| Gross output | 175 | 165 | 165 |
| Intermediate consumption | -100 | -90 | -100 |
| GDP | 75 | 75 | 65 |
Source: Statistics Canada, National Economic Accounts Division, 2024, special tabulation. |
|||
Appendix 3 Why cross-border shopping would not lead to an underestimation of GDPNote
Estimates of cross-border shopping that are too low, declared or undeclared, would also lead to an underestimation of imports, but unlike smuggling, not to an underestimation of Canada’s GDP. Purchases made outside the country for personal consumption only (that is, not for resale) do not give rise to any mark-up or profit in Canada needing to be counted in our GDP. Their effect on imports is entirely offset by their effect on household final consumption expenditure. Whatever the level of purchases made across the border, the same amount would be recorded in household final consumption expenditure with a positive sign, and in imports with a negative sign, leaving GDP unchanged.
This is not to say there is no tax evasion with respect to cross-border shopping. The point is that underestimation of cross-border shopping does not result in an underestimation of GDP and can be ignored here. Undervaluation of non-merchandise imports can also be disregarded. The addition of ‘missing’ service imports would either leave measured GDP unchanged, or even reduce it (if the imported services missing under the heading of imports already showed up elsewhere in final demand).
Bibliography
Australian Bureau of Statistics. 2013. The-Non-Observed Economy and Australia’s GDP, 2012. Australian Bureau of Statistics, Publication 5204.0.55.008. Canberra.
Baldwin, J.R., D. Leung, and L. Rispoli. 2013. Canadian Labour Productivity Differences Across Firm Size Classes, 2002 to 2008. The Canadian Productivity Review, no. 32. Statistics Canada, catalogue no. 15-206-X. Ottawa: Statistics Canada. http://www.statcan.gc.ca/pub/15-206-x/15-206-x2013032-eng.htm (accessed 2013-09-03).
Barber-Dueck, C., B. Terefe and M.J. Lamontagne. 2011. Estimating the Underground Economy in Canada, 1992-2008. Income and Expenditure Accounts Division. Ottawa: Statistics Canada.
Berger, S. 1986. The Unrecorded Economy: Concepts, Approach and Preliminary Estimates for Canada, 1981. Canadian Statistical Review, April 1986. Statistics Canada, catalogue no. 11-003E. Ottawa: Statistics Canada.
Blades, D.W. 1985. Crime: What Should Be Included in the National Accounts and What Difference Would It Make. The Economic of the Shadow Economy, proceedings of the International Conference on the Economics of Shadow Economy, held at the University of Bielefeld, Series in contemporary Economics, vol. 15.
Blades, D.W. and D. Roberts. 2002. Measuring the Non-Observed Economy. OECD Statistics Brief. no. 5. Paris. http://www.oecd.org/std/2389461.pdf (accessed 2013-09-01).
Atlantic Home Building & Renovation – sector council. 2004. Current Impact of the Underground Economy – Residential Construction Sector in Nova Scotia. Nova Scotia, Canada. https://ahbrsc.com/wp-content/uploads/2014/02/ue-final-report.pdf (accessed 2013-09-01).
European Union. 2011. “Chapter 6: The Informal Sector.” Essential SNA: Building the Basics, 2010 Edition. EUROSTAT methodologies & Working Papers. Luxembourg. p. 97-112.
Fortin, B., G. Lacroix and D. Pinard. 2010. “An Evaluation of the Underground Economy in Quebec: A Microeconometric Approach”. International Economic Journal 24 (4): 463-479.
Fortin, B., P. Fréchette and J. Noreau. 1992. “L’Économie Souterraine au Québec”. Interface 13 (3): 16-18.
Gervais, G. 1994. The Size of the Underground Economy in Canada. Studies in National Accounting, no 2. Statistics Canada, catalogue no. 13-603-MPE1994002. Ottawa: Statistics Canada.
Gomis-Porqueras, P., A. Peralta-Alva and C. Waller. 2011. Quantifying the Shadow Economy: Measurement with Theory. Working Paper 2011-015A. Federal Reserve Bank of St-Louis. St-Louis.
Jackson, C. 1992. The Value of Household Work in Canada, 1986. Income and Expenditure Accounts technical series, no. 19. Statistics Canada, catalogue no. 13-604-M. Ottawa: Statistics Canada.
Kemp, K. 1992. Cross-Border Shopping - Trends and Measurement Issues. Income and Expenditure Accounts technical series, no. 21. Statistics Canada, catalogue no. 13-604-M. Ottawa: Statistics Canada.
Lachenmeier D.W. 2012. “Unrecorded and Illicit alcohol.” Alcohol in the European Union. Consumption, Harm and Policy Approaches. In: Anderson, P., L. Møller and G. Galea (ed.). WHO Regional Office for Europe, Copenhagen, Denmark. p. 29-34.
Lachenmeier, D.W., G. Gmel and J. Rehm. 2013. “Unrecorded Alcohol Consumption.” Alcohol Science, Policy and Public Health. Oxford University Press, United Kingdom. p. 132-142.
LCBO. 2003-2011. Annual Reports. Ontario.
Lemieux, P. 2007. “The Underground Economy: Causes, Extent, Approaches.” Cahiers de recherche de l’Institut économique de Montréal. November 2007. Montreal, Canada. p. 36. http://www.iedm.org/305-leconomie-souterraine-causes-importance-options (accessed 2013-06-03).
Macdonnal, S., S. Wells, and N. Giesbrecht. 1999. “Unrecorded Alcohol Consumption in Ontario, Canada: Estimation Procedures and Research Implications.” Drug and Alcohol Review 18: 21-29.
Ministère des finances du gouvernement du Québec. 2005. “L’Évasion Fiscale au Québec – Sources et Ampleur.” Études économiques, fiscales et budgétaires. Vol. 1, no. 1. Québec, Canada.
Morissette, Charles. 2012. The underground economy in Canada, 1992 to 2009. The Daily, Statistics Canada, September 21st, 2012. Ottawa: Statistics Canada. http://www.statcan.gc.ca/daily-quotidien/120921/dq120921g-eng.htm (accessed 2013-06-01).
Morissette, Charles. 2014. The underground economy in Canada, 1992 to 2011. Income and Expenditure Accounts technical series, no. 73. Statistics Canada, catalogue no. 13-604-M. Ottawa: Statistics Canada.
Ontario Construction Secretariat. 2010. “Underground Economy in Construction – It Costs Us All.” Ontario, Canada. https://iciconstruction.com/2016/06/20/underground-economy-in-construction-it-costs-us-all-july-2010/ (accessed 2013-06-01).
Organisation for Economic Co-operation and Development, International Monetary Fund, International Labour Organisation and CIS STAT. 2002. Measuring the Non-Observed Economy: A Handbook. OECD, Paris. http://www.oecd.org/std/na/measuringthenon-observedeconomy-ahandbook.htm (accessed 2013-06-01).
Schneider, Friedrich. 2011. Size and Development of the Shadow Economy of 31 European and 5 Other OECD Countries from 2003 to 2012: Some New Facts. Johannes Kepler Universitat.
Statistics Canada. 2009. Satellite Account of Non-profit Institutions and Volunteering. Statistics Canada, catalogue no. 13-015-XIE. Ottawa, Ontario. http://www.statcan.gc.ca/pub/13-015-x/13-015-x2009000-eng.htm (accessed 2013-09-01).
Statistics Canada. 2008, Guide to the Income and Expenditure Accounts. Statistics Canada, catalogue no.13-017-X, Ottawa, Ontario. http://www.statcan.gc.ca/pub/13-017-x/13-017-x2008001-eng.pdf (Accessed 2013-06-28).
Statistics Canada. 1990. Guide to the Income and Expenditure Accounts. Statistics Canada, catalogue no. 13-603E, no. 1. Ottawa, Ontario.
Statistics Canada. nd. Financial and Taxation Statistics for Enterprises. Statistics Canada, catalogue no. 61-219. Ottawa, Ontario. https://www150.statcan.gc.ca/n1/en/catalogue/61-219-X (accessed 2013-09-01)
Terefe, Berouk. 2002. The Underground Economy in Canada. Income and Expenditure Accounts Division. Statistics Canada, unpublished working paper. Ottawa, Ontario.
United Nations Economic Commission for Europe. 2008. Non-Observed Economy in National Accounts – Survey of Country Practices. United Nations Publication. New York and Geneva. https://unece.org/statistics/publications/non-observed-economy-national-accounts-survey-country-practices (accessed 2013-06-01)
World Health Organization. 2011. Global Status Report on Alcohol and Health. Switzerland. http://www.who.int/substance_abuse/publications/global_alcohol_report/en/ (accessed 2013-09-01)
- Date modified: