
Income and Expenditure Accounts Technical Series
Purchasing Power Parities between the United States and Canada: concepts and methods

Archived Content
Information identified as archived is provided for reference, research or recordkeeping purposes. It is not subject to the Government of Canada Web Standards and has not been altered or updated since it was archived. Please "contact us" to request a format other than those available.
by Nazrul Kazi and Conrad Barber-Dueck
We would like to thank Ian Donegan, Jack Wang and Brandon Landry for their work on compiling and analyzing PPP data. Thanks also goes to Julie Smith, Monique Deschambault, Denise Lafleur, Kim Longtin, Brice Dagrou and Rob Puchyr for their technical support and advice.
Introduction
The aim of this article is twofold: first, to discuss concepts and methods of estimating Canada-U.S. purchasing power parity (PPP); and second, to present key estimates.
The estimates incorporate the 2017 benchmark prices from the Eurostat-Organisation for Economic Co-operation and Development (OECD) PPP Programme and corresponding national income data from the Canadian System of National Accounts. U.S. national income data were obtained from the Bureau of Economic Analysis (BEA) and the U.S. Census Bureau.
What are purchasing power parities?
In its simplest form, PPP is a ratio of the prices of a good or service paid in two countries in their own currencies.Note 1 For example, if the price of a chair is US$30 in the United States, and the same chair is sold for CAN$40 in Canada, the PPP is 30 ÷ 40 or US$0.75 per Canadian dollar.
If the exchange rate of a Canadian dollar is US$0.75, the prices of chairs in the two countries are expected to follow the same price ratio or PPP. The economy-wide PPP, however, incorporates prices of both traded and non-traded products. Consequently, the exchange rate and PPP often diverge substantially, because the former is mainly influenced by the prices of traded productsNote 2.
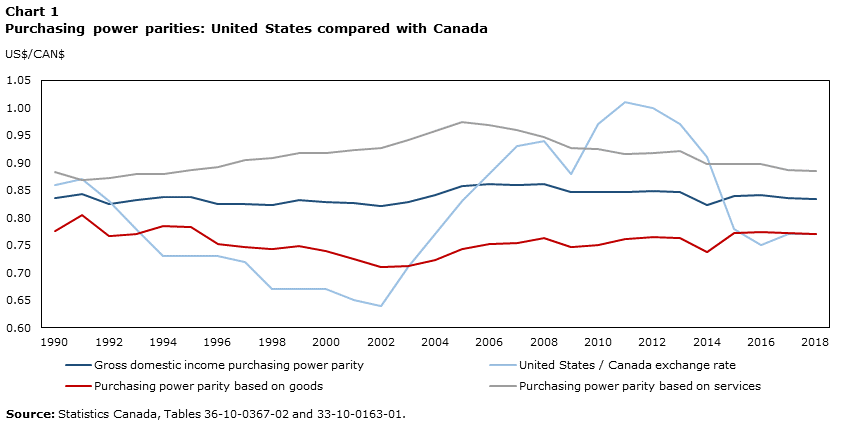
Data table for Chart 1
| Gross domestic income purchasing power parity | United States / Canada exchange rate | Purchasing power parity based on goods | Purchasing power parity based on services | |
|---|---|---|---|---|
| US$/CAN$ | ||||
| 1990 | 0.84 | 0.86 | 0.78 | 0.88 |
| 1991 | 0.84 | 0.87 | 0.81 | 0.87 |
| 1992 | 0.83 | 0.83 | 0.77 | 0.87 |
| 1993 | 0.83 | 0.78 | 0.77 | 0.88 |
| 1994 | 0.84 | 0.73 | 0.79 | 0.88 |
| 1995 | 0.84 | 0.73 | 0.78 | 0.89 |
| 1996 | 0.83 | 0.73 | 0.75 | 0.89 |
| 1997 | 0.83 | 0.72 | 0.75 | 0.91 |
| 1998 | 0.82 | 0.67 | 0.74 | 0.91 |
| 1999 | 0.83 | 0.67 | 0.75 | 0.92 |
| 2000 | 0.83 | 0.67 | 0.74 | 0.92 |
| 2001 | 0.83 | 0.65 | 0.73 | 0.92 |
| 2002 | 0.82 | 0.64 | 0.71 | 0.93 |
| 2003 | 0.83 | 0.71 | 0.71 | 0.94 |
| 2004 | 0.84 | 0.77 | 0.72 | 0.96 |
| 2005 | 0.86 | 0.83 | 0.74 | 0.98 |
| 2006 | 0.86 | 0.88 | 0.75 | 0.97 |
| 2007 | 0.86 | 0.93 | 0.75 | 0.96 |
| 2008 | 0.86 | 0.94 | 0.76 | 0.95 |
| 2009 | 0.85 | 0.88 | 0.75 | 0.93 |
| 2010 | 0.85 | 0.97 | 0.75 | 0.93 |
| 2011 | 0.85 | 1.01 | 0.76 | 0.92 |
| 2012 | 0.85 | 1.00 | 0.77 | 0.92 |
| 2013 | 0.85 | 0.97 | 0.76 | 0.92 |
| 2014 | 0.82 | 0.91 | 0.74 | 0.90 |
| 2015 | 0.84 | 0.78 | 0.77 | 0.90 |
| 2016 | 0.84 | 0.75 | 0.78 | 0.90 |
| 2017 | 0.84 | 0.77 | 0.77 | 0.89 |
| 2018 | 0.83 | 0.77 | 0.77 | 0.89 |
| Source: Statistics Canada, Tables 36-10-0367-02 and 33-10-0163-01. | ||||
The exchange rate, which is determined by the demand for and supply of a currency compared with another currency, tends to be volatile. PPP, on the other hand, is relatively stable, as it captures the relative prices of all products included in the gross domestic product (GDP).
In 1998, for example, in the aftermath of the East Asian financial crisis, the Canadian dollar depreciated sharply (US$0.67), but PPP was largely flat (US$0.82). In 2011, the Canadian dollar appreciated to US$1.01, whereas the PPP hovered around US$0.84. From 1990 to 2018, the averages of the exchange rate and PPP were US$0.81 and US$0.84, respectively (Chart 1). In sum, the Canada-U.S. exchange rate and PPP diverge markedly in the short-term, but the longer-term averages are quite similar.
The PPP of goods follows the exchange rate more closely than does the PPP of major services, such as, health care and education. From 1990 to 2018, the average PPP of goods was US$0.76, indicating that goods were relatively more expensive in Canada. Specifically, the quantity of goods that US$76 in the United States could buy would cost CAN$100 in Canada, not CAN$94, which was the exchange-rate-converted price.
In Canada, the PPP of services has been higher than that of goods. From 1990 to 2018, the average PPP of services was US$0.91, well above the average exchange rate. Health care and higher education have been relatively cheaper in Canada than in the United States (Temple, 2011).
Why purchasing power parities?
The market exchange rate, not PPP, is used for comparing international trade, capital flows, and the value of foreign debt. However, for comparing incomes, PPP-adjusted per capita GDP is superior to that of exchange-rate-adjusted GDP, because the former takes into account all components of GDP. Consequently, PPP-adjusted income is used by international institutions, including the United Nations, the World Bank, and the OECD.
The United Nations Development Program uses PPP-adjusted per capita income in conjunction with indicators such as life expectancy and the literacy rate to calculate a human development index and rank countries. The United Nations also uses PPPs for assessing its Millennium Development goals.
The World BankNote 3 notes that “PPPs are most appropriate for comparing levels of welfare, which is why they are used in measuring global poverty.” Using PPP results, the WB created an international poverty threshold, widely known as “dollar-a-day.” Purchasing power measures are also employed at the national level. Canada-U.S. PPP data are used to study the productivity gap between the two countries as well as for comparing Canada-U.S. per capita GDP (Baldwin and Macdonald, 2009).
Data sources
Each year, the OECD estimates multilateral PPPs. Statistics Canada participates by providing data, and as well, obtains a large number of U.S. price quotes from the Eurostat-OECD PPP Programme.Note 4
The OECD has established a list of commodity specifications for which countries are asked to provide price information. Many of the specifications are generic, as exact matches of products across all countries may not exist. For government goods and services, which are not sold at market prices, an input-cost approach is used to establish prices. In this case, salary levels for 46 types of public sector occupations are used.
Statistics Canada organizes Canadian and U.S. gross domestic product (GDP) under 179 basic headings established by the OECD.Note 5 For each basic heading, price quotes are obtained from the OECD’s multilateral PPP program.Note 6 Around 2,000 price quotes from each country are compiled and grouped under the 179 basic headings—5 to 15 pairs for each heading—to align with the corresponding GDP estimates or weights. U.S. GDP data are from the website of the BEA. The U.S. Census Bureau is the source of the population data required for estimating per capita consumption.
Conclusion
PPPs are influenced by factors such as geographical distance, cultural and structural differences, labour legislation, and unionization. Except for health care and higher education, structural differences between Canada and the United States are relatively small. Therefore, the long-term (from 1990 to 2018) averages of PPP and the exchange rate are similar: US$0.81 and US$0.84, respectively. However, in the short-term, the two indicators differ markedly.
For comparisons of income between nations, PPP-adjusted per capita GDP is superior to exchange-rate-converted per capita GDP. In 2018, PPP adjusted per-capita national income in Canada was US$49,900, which is 8.1% higher than the exchange-rate-converted per capita national income (US$46,200). In 2018, the per-capita national income was US$62,600 in the U.S.
The market exchange rate is a single measure and gets updated instantly. In contrast, PPPs are point estimates that are usually calculated once a year. The quality of PPP estimates depend on the reliability of the expenditure weights and the price data. PPP can be disaggregated to compare various components of national income (consumer spending or investment spending between nations), implying that the PPP can be tailored to fulfill specific needs, and that with additional data availability and further analysis, it can be improved.
Appendix
Methodology
PPPs are spatial price indexes, similar to temporal price indexes such as the consumer price indexes (CPI). The CPI, estimated using a base period, is widely employed for comparing prices between periods. Likewise, PPP is constructed with a base country/region and serves to compare incomes among nations.
A wide variety of index number formulas with sound microeconomic-underpinning can be applied to track prices and volumes of goods and services (Allen, 1975; Statistics Canada, 2016). These formulas, essentially weighted averages, differ primarily in the weights assigned to calculate them.
Using the price (P) and corresponding real GDI of each item in Canada and the United States, PPP can be calculated using the Laspeyres (PL), Paasche (PP), and Fisher (PF) formulasNote 7:
Equation 1
Equation 2
Equation 3
where,
Real GDINote 8, like GDP, is the unduplicated value of goods and services produced by a country or region in a given period. In the case of real GDP, exports and imports are deflated by their own price indices, whereas real GDI calculation requires deflating the trade components by the price of final domestic expenditure (Baldwin and Macdonald, 2009).Note 9
Equations 1 to 3 show that for the Laspeyres index the weights comes from the base country’s GDI, whereas the Paasche index applies the partner country’s GDI as weights. The Fisher index is the geometric mean of these two indices.
Assuming the value (purchasing power) of the base country’s currency to be 1, or 100, the PPP of the partner country’s currency is determined. Text box 1 shows the steps in calculating PPP for a simple economy with two products: bread and medical services.
Start of text box
Example of purchasing power parity calculation: using hypothetical data and assuming an economy with only two products
| C1 | C2 | C3 | C4 | C5 | C6 |
|---|---|---|---|---|---|
| Basic headings | Pu/PC † | GDI of Canada | GDI of United States | Pu/Pc × GDICA | Pc/Pu × GDIUS |
| Bread | 0.74 | 100 | 500 | 74 | 676 |
| Medical services | 0.87 | 700 | 8,000 | 609 | 9,195 |
| Total value: sum of bread and medical services | 800 | 8,500 | 683 | 9,871 |
The total value in C5 represents the numerator, and that in C3 is the denominator of the Laspeyres index (Equation 1). That is, based on the Laspeyres formula, PPP of CAN$ = 683 ÷ 800 = US$0.854.
For the Paasche index, the numerator and denominator are shown by the total value in C4 and C6, respectively (Equation 2). Hence, based on the Paasche formula, PPP of a CAN$ = 8,500 ÷ 9,871 = US$0.861. According to the Fisher formula, PPP of a CAN$ = (0.85 × 0.86)1/2 = US$0.857.
† The price ratio of each basic heading, bread for instance, represents the geometric mean of price ratios of all types of breads for which data are available in both countries. Each type should be homogenous in terms of quantity and quality.
End of text box
The price ratios and weights are organized under 179 basic headings (classification provided by the OECD). Detailed price data are compiled every third year (1990, 1993, ..., 2014, 2017), known as the benchmark year. Time series are produced by linking benchmark years. Prices and price structures are allowed to change between benchmark years. Inter-benchmark year (2015, for instance) prices are estimated using the growth rate of GDP implicit prices and supplemented by internet prices.
PPP can be estimated for sub-groups such as, food, health, education and gross fixed capital formation. A weighted aggregation of the indices is produced, and the estimates are disseminated under various headings through tables 36-10-0365-01 and 36-10-0367-01.
References
Allen, R. G. D. 1975, Index Numbers in Theory and Practice, Aldine Publishing Company, Chicago.
“Big Mac Currencies”, The Economist, September issue, 1986.
Baldwin, J.R., R. Macdonald. 2009. “PPPs: Purchasing Power or Producing Power Parities?” Statistics Canada Catalogue no. 11F0027M — no. 058.
Eurostat-OECD Methodological Manual on Purchasing Power Parities, 2012 edition. Luxembourg: Publications Office of the European Union.
Statistics Canada. 2016. “User Guide: Canadian System of Macroeconomic Accounts” Chapter 7 Price and volume measures. Statistics Canada Catalogue no. 13-606-G.
Temple, J. 2011. “Purchasing Power Parities and Real Expenditures, United States and Canada, 2002 to 2009.” Statistics Canada Catalogue no. 13-604-M — no. 064. Ottawa: Statistics Canada.
World Bank. 2014. “Purchasing Power Parities: Statistics to Describe the World”. Washington, D.C., World Bank. International Comparison Program document.
- Date modified: