
Canadian Food Environment Dataset: Data File and User Guide
Skip to text
Text begins
Project prepared for and funded by Canadian Institutes of Health Research, Fonds de Recherche du Quebec – Santé, Canadian Urban Environmental Health Research Consortium
This document prepared by:
Professor Nancy Ross (Geo-Social Determinants of Health Research Group, Department of Geography, McGill University)
Andrew Stevenson (Geo-Social Determinants of Health Research Group, Department of Geography, McGill University)
Clara Kaufmann (Geo-Social Determinants of Health Research Group, Department of Geography, McGill University)
Rachel Colley (Health Analysis Division, Statistics Canada )
Patrycia Menko (School of Planning, University of Waterloo)
Lindsey Smith (Department of Geography and Planning, University of Toronto)
Special thanks and acknowledgements to:
Leia Minaker, School of Planning, University of Waterloo
Michael Widener, Department of Geography & Planning, University of Toronto
Thank you to Jane Polsky (Health Analysis Division) for copy editing.
Start of text boxThe Canadian Food Environment Dataset (Can-FED) is a pan-Canadian dataset of retail food environment measures at the dissemination area (DA) level based on food outlet data from the 2018 Statistics Canada Business Register. Under the leadership of Professor Nancy Ross (Queen’s University), the Can-FED was developed by a team of Canadian researchers from McGill University (Andrew Stevenson, Clara Kaufmann), the University of Waterloo (Associate Professor Leia Minaker) and the University of Toronto (Associate Professor Michael Widener). The project was supported by various divisions at Statistics Canada including the Health Analysis Division, the Business Register team, the Data Integration Infrastructure Division, and the Statistical Integration Methods Division.
The Can-FED is a geographic-based set of measures that represents the food environment of Canadian communities. The primary envisioned use of the Can-FED is research and analysis of the relationship between the local food environment, dietary intake and health outcomes. By using geography conversion tools such as the Postal Code OM Conversion File Plus (PCCF+) (statcan.gc.ca), it is possible to link Can-FED measures to individual-level health data from national-level survey platforms (e.g., the Canadian Health Measures Survey and the Canadian Community Health Survey) or to investigator-led cohorts. A diversity of food categories was chosen to represent an inclusive set of different and overarching food outlet types, such as retailers with healthy food options (e.g., supermarkets, grocery stores), convenient food options (e.g., corner stores, fast-food outlets), and independent and specialty retailers (e.g., bakeries, fish markets, coffee shops), amongst other options.
For a more detailed version of this dataset, please refer to Statistics Canada’s Research Data Centres (Record number 8006): Data available at the Research Data Centres (statcan.gc.ca)
For more information on the Can-FED, please refer to a Methodological Insight published in Health Reports in 2022: A pan-Canadian dataset of neighbourhood retail food environment measures using Statistics Canada's Business Register (statcan.gc.ca)
CanFED data file - 1-km buffer : CSV
CanFED data file - 3-km buffer : CSV
User Guide
1: Background and Overview of Dataset
1.1: Background
The retail food environment is a modifiable element of the built environment that holds potential to influence the diet of Canadians at the population level. Unfavourable neighbourhood retail food environments are a target for intervention because they can contribute to poor diets.Note 1 In Canada, neighbourhoods with easy access to healthier food options or limited access to less healthy food options have been associated with better indicators of health, such as better diet,Note 2 lower body mass index (BMI),Note 3 and lower levels of Type 2 diabetes.Note 4 However, measurement error in the assessment of food environments, as well as of diet and health outcomes can make it difficult to draw meaningful conclusions from past work.
There is currently no high-quality Canada-wide dataset of businesses that can be used to create food environment measures that are accessible, free to use, and relevant for public health. Accessible and high-quality food environment access measures, at the national level, would advance the quality of evidence base with increased accuracy of exposure ascertainment. They would also prove useful to the public health communities in Canada who may wish to create and monitor their local food environment in order to evaluate the impact of relevant interventions. Readily accessible food environment measures can also and facilitate data linkage with national health surveys, health administrative data and investigator-led cohort studies.
The purpose of this document is to describe the development and user considerations for the Canadian Food Environment Dataset (Can-FED): a pan-Canadian dataset of retail food environment measures at the dissemination area (DA) level based on food outlet data from the 2018 Statistics Canada Business Register. Data are accessible through Statistics Canada’s Research Data Centre Network and available for use by researchers and other potential users, including academics and students, and practitioners from both the public and private sector.
This document is mainly focused on the Researcher Can-FED, which includes densities of 19 retail food outlet types measured as counts per square kilometer within street network buffer areas and two relative food outlet proportion measures, and comprises two main sections. First, Can-FED data available in the Statistics Canada’s Research Data Centre Network are described, including the classifications of outlet types, field names, and measures (Section 1). Second, the protocol for deriving Can-FED is detailed (Section 2) and supported by step-by-step instructions in the Appendices.
A General Use Can-FED data file which includes categorical neighbourhood food access, is available to download online.
1.2: About Can-FED
The Canadian Food Environment Dataset (Can-FED) is a geographic-based set of measures that represents the food environment of Canadian communities. The primary envisioned use of the Can-FED is research and analysis of the relationship between the local food environment, dietary intake and health outcomes. By using geography conversion tools such as the Postal Code Conversion File (PCCF+),Note 5 it is possible to link Can-FED measures to individual-level health data from national-level survey platforms (e.g., the Canadian Health Measures Survey and the Canadian Community Health Survey) or to investigator-led cohorts.
A diversity of food categories was chosen to represent an inclusive set of different and overarching food outlet types, such as healthy food retailers (e.g., supermarkets, grocery stores), convenient food options (e.g., corner stores, fast-food outlets), and independent and specialty retailers (e.g., bakeries, fish markets, coffee shops), amongst other options.
1.2.1: Geographic unit of analysis
Retail food environment access measures were calculated in a Geographic Information System, specifically ArcMap (version 10.7.1), using network buffers around the population-weighted centroids (also known as representative points) of 56,590 dissemination areas (DAs) in Canada. Population-weighted centroids are weighted using the population mean centre and provide a better indication of where the majority of populations live and the environments they interact with, compared with the administrative boundary or actual mean centre of a DA.
DAs are the smallest standard geographic units defined by Statistics Canada for which census data are disseminated across Canada and have populations of 400 to 700 people.Note 6 DA-level food environments capture a good indication of neighbourhood-level food access, as opposed to larger areas such as census tract boundaries, which can help with the identification of target areas for intervention strategies.
Food outlets and services were largely geocoded at the block-face level,Note 7 which is the lowest level of geography at which businesses are geocoded. Those that could not be geocoded at the block face were geocoded to the other geographies as detailed in Section 1.3.4.
1.2.2: Reference years
This first release of the Can-FED represents the Canadian food environment in July 2018. Road network and DA data were used from the most recent census year and correspond with 2016 geographies.
1.2.3: File format and naming convention
The two files available online are:
CSV Format:
CanFED Data file - 1-km buffer : CSV
CanFED Data file - 3-km buffer : CSV
1.2.4: Dataset completeness
Of the total 56,590 DAs in Canada, 277 DAs were not included due to errors that arose when calculating their network buffers. The errors were due to the inability to locate a road network from the centroid of the DA (i.e., DAs with boundaries that follow features other than roads, such as water features or power transmission lines or DAs that have lower population counts, including 0). For the 1-km and 3-km network buffer, 99.51% of DAs in Canada were included. A1 in Appendix 1 details both the number and percentage of DAs that were excluded for each province and territory.
1.3: Can-FED Food Outlet Data
1.3.1: Source data
Food outlet data were extracted from the Statistics Canada Business Register, a central repository of baseline information on businesses operating in Canada.Note 8 Information on businesses is compiled from mandatory tax data collected by the Canada Revenue Agency. Responding to the survey is mandatory, and all outlets are consistently classified with a North American Industry Classification System (NAICS) code that identifies the primary function of a business. Ongoing quality evaluation and assurance is performed by staff at Statistics Canada. A research contract was signed with Statistics Canada to provide access to the Business Register, and the data were made available at a secure site at the headquarters of Statistics Canada in Ottawa.
1.3.2: Data extraction
Food outlets were extracted from the Business Register by NAICS codes, which are the most up-to-date industrial codes in North America and can be used to classify the primary business function of companies and enterprises.Note 9 Food outlets were extracted if they had an operating outlet as of July 2018 and if the level 5 (six-digit) NAICS code associated with the outlet indicated that it was a type of retail food outlet. All extracted records were all nested within three the following level 1 (two-digit) NAICS codes: 44-45: ‘retail trade’ or 72 ‘accommodation and food services.’
1.3.3: Construct definition and classification
Food outlets were classified based primarily on NAICS code and, for some food outlet types, further classified using a name-based assignment method. Some NAICS codes corresponded to food outlet constructs of interest, while others needed to be further defined.
Businesses with NAICS codes that corresponded to food outlet constructs of interest were pulled from the extracted file by making a request on a given NAICS code and saved to a separate food category-specific file. For example, outlets with NAICS code 445120 (“convenience stores”) were pulled from the extracted file and classified as “convenience stores.”
Businesses that needed to be disaggregated from their assigned NAICS code were pulled from the extracted file by making a request on a given NAICS code and then further classified based on the outlet name. For example, outlets with NAICS code 722512 (“limited-service eating places”) were pulled from the master file and then classified into “fast-food outlets” “cafés” and “other limited-service eating places.” Keyword searches on the French and English name indicating a fast-food outlet (e.g., “burger” or the name of a chain restaurant) were requested to further classify and save them as “fast-food outlets,” then keyword searches on the French and English name indicating a café (e.g., “café” or the name of a chain café) were requested to generate a “café” category, and the remaining limited-service eating places were classified as “other limited-service eating places”
Table 1 provides an overview of the categorization methods used for each food outlet type. Once all food outlet categories were created, they were checked and cleaned: duplicate entries were deleted, misclassified outlets were reclassified, and non-food outlets were removed. Sections 2.3 and 2.4 describe more detailed protocols for deriving Can-FED measures and data preparation. Instructional steps to check and clean food outlet categories are provided in Appendix 2.
| Food outlet type | Definition | Assignment Method | |
|---|---|---|---|
| NAICS Code | Additional keyword or other specification (if applicable) | ||
| Superstores | Large stores that sell a variety of food products and other non-food products. | 452910 | Superstore brand name |
| Chain grocery stores | Stores that primarily sell a variety of fresh and prepared food products, have multiple locations, and are owned by large retail companies. | 445110 | Chain grocer brand name |
| Grocery stores | Stores that primarily sell convenience goods and food products that are already prepared and packaged. | 445120 | Not a chain grocery store (as defined above) |
| Convenience stores | Stores that primarily sell convenience goods and food products that are already prepared and packaged. | 445120 | N/A |
| Gas station convenience stores | Stores that primarily sell convenience goods and food products that are already prepared and packaged and are located at a gas station. | 447110 | N/A |
| Bakeries | Retail bakeries that sell fresh baked goods on the premises. | 311811 | N/A |
| Fruit and vegetable markets | Stores that primarily sell fresh fruits and vegetables. | 445230 | N/A |
| Meat markets | Stores that primarily sell meat and poultry. | 445210 | N/A |
| Fish markets | Stores that primarily sell fish and seafood products. | 445220 | N/A |
| Speciality food stores | Stores that primarily sell specialty food products (e.g., coffee store, spice and herb store, dietary supplement store). | 445299 | N/A |
| Confectionary stores | Stores that primarily sell either packaged or ready-to-eat sweets, such as chocolates, ice cream or candy. | 445292 | N/A |
| Full-service Restaurants | Eating places where patrons typically order from a waiter, can be seated for dine-in service, and pay after eating. | 722511 | N/A |
| Fast-food outlets | Eating places that typically sell pre-prepared or quickly prepared food that are sold at a counter, and customers pay before eating | 722512 | Chain fast-food brand name, or businesses with a name alluding to fast food (e.g.., “burger,” “pizza,” “fried,” ‘frite,’, “2 for 1,” “fries”) |
| Cafes | Limited-service eating places that serve coffee and/or tea beverages and typically do not offer a full menu. | 722512 | Chain cafés brand name, or businesses with a name alluding to cafés (e.g., “coffee,” “java,” “café”) |
| Other limited-service food outlets | Eating places that typically sell pre-prepared or quickly prepared food that are sold at a counter, and customers pay before eating, that were not classified as fast-food outlets or cafés | 722512 | Not a fast-food outlet or café (as defined above) |
| Drinking places | Drinking places primarily engaged in preparing and serving alcoholic beverages for immediate consumption. | 722410 | N/A |
| Liquor stores | Stores that primarily sell alcoholic beverages, including liquor, beer and wine. | 445310 | N/A |
| Dollar stores | Variety and dollar stores that primarily sell pre-packaged snack foods. | 452999 | Dollar store chain name |
| Chain pharmacies | Large chain pharmacies that offer a selection of different food products. | 446110 | Pharmacy chain name |
|
NAICS: North American Industrial Classification System N/A: Not applicable |
|||
1.3.4: Geocoding food outlets
Once all outlets were categorized, cleaned, and checked, they were imported into ArcMap based on their latitude and longitude geocoded location from the Business Register. As of January 2018, approximately 80 percent of food stores and services were geocoded at the block-face level, which is the lowest level of geography at which businesses are geocoded. Those that could not be geocoded at the block-face were geocoded to the street dissemination block (~5%), postal code dissemination block (~8%), and other geographies (~0.6%). Section 2.5 provides more detail about geocoding food outlets, including how food outlets were later projected into corresponding provincial and territorial projected coordinate systems.
1.4: Can-FED Access Metrics and Field Directory
Two buffer sizes were generated from the population-weighted centroid of each DA: 1-km and 3-km network buffers. The 1-km buffers represent a 10- to 15-minute walking distance from the DA to a food outlet.Note 10 The 3-km buffers capture greater distances that may be travelled in more rural Das; they also represent larger actual or perceived food environment boundaries.
Using a spatial query, food outlets were joined to the buffers and then the number of outlets located within each buffer was summed for each food outlet type (e.g., the count of fast-food restaurants per square kilometre) and relative measures (e.g., the proportion of healthy outlets per square kilometre) were calculated. The full list of names, labels and brief definitions of the variables (i.e., fields) are provided in Table 2.
| Field name | Full name | Definition | Derivation Sources |
|---|---|---|---|
| Province or Territory | Province or territory | Major political and geographical unit of Canada | Business Register, Statistics Canada |
| DAUID | Dissemination area identifier | Dissemination area identifier | Statistics Canada standard geographies |
| 01_den_superstores | Density of superstores | # of stores per square kilometre | Business Register, Statistics Canada |
| 03_den_chain_grocery | Density of chain grocery stores | # of stores per square kilometre | Business Register, Statistics Canada |
| 02_den_grocery | Density of grocery stores | # of stores per square kilometre | Business Register, Statistics Canada |
| 04_den_convenience | Density of convenience stores | # of stores per square kilometre | Business Register, Statistics Canada |
| 05_den_gas_convenience | Density of convenience stores at gas stations | # of stores per square kilometre | Business Register, Statistics Canada |
| 06_den_bakery | Density of bakeries | # of stores per square kilometre | Business Register, Statistics Canada |
| 07_den_fruit_vegetable | Density of fruit and vegetable markets | # of stores per square kilometre | Business Register, Statistics Canada |
| 08_den_meat_market | Density of meat markets | # of stores per square kilometre | Business Register, Statistics Canada |
| 09_den_fish | Density of fish and seafood markets | # of stores per square kilometre | Business Register, Statistics Canada |
| 10_den_speciality | Density of speciality food stores | # of stores per square kilometre | Business Register, Statistics Canada |
| 11_den_confectionary | Density of confectionary stores | # of stores per square kilometre | Business Register, Statistics Canada |
| 12_den_restaurants | Density of restaurants | # of stores per square kilometre | Business Register, Statistics Canada |
| 13_den_fastfood | Density of fast-food stores | # of stores per square kilometre | Business Register, Statistics Canada |
| 15_den_cafes | Density of cafes | # of stores per square kilometre | Business Register, Statistics Canada |
| 14_den_limited_service | Density of limited-service food outlets | # of stores per square kilometre | Business Register, Statistics Canada |
| 16_den_drinking | Density of drinking places | # of stores per square kilometre | Business Register, Statistics Canada |
| 17_den_liquor_stores | Density of liquor stores | # of stores per square kilometre | Business Register, Statistics Canada |
| 18_den_dollar_stores | Density of dollar stores | # of stores per square kilometre | Business Register, Statistics Canada |
| 19_den_pharmacies | Density of chain pharmacies | # of stores per square kilometre | Business Register, Statistics Canada |
| mRFEI | Modified retail food environment | The proportion of healthy outlets that operate within each buffer | Business Register, Statistics Canada |
| Rmix | Fast food restaurant mix | The proportion of fast-food and full-service restaurants that are fast-food | Business Register, Statistics Canada |
1.4.1: Food environment variables defined: modified Retail Food Environment Index (mRFEI) and fast food restaurant mix (Rmix)
Relative food environment variables were derived to represent the proportion of healthy and less healthy food retailers for each DA. The modified Retail Food Environment Index (mRFEI) calculates the proportion of food outlets that sell a wide selection of fresh and nutritious food that operate within each buffer and is defined using the following equation:
The fast-food restaurant mix (Rmix) calculates the proportion of fast-food restaurants relative to fast-food and full-service restaurants combined and is defined using the following equation:
1.4.2 General-use Can-FED Access Measures
Densities of chain grocery stores, grocery stores, fast-food restaurants, all convenience stores(including those located in a gas station), fruit and vegetable stores, and the two relative density measures (mRFEI and the Rmix) from the researcher Can-FED were included in the general use Can-FED.
Five categories were created for each absolute density and relative density measure on the Can-FED general use file: zero and groups 1 to 4. 1 represents the lowest densities of an outlet type that is not zero and 4 represents the highest densities of an outlet type. Zeros were isolated and put into their own category and a k-medians clustering approach was used to create the four remaining categories of densities for each outlet type. A k-medians approach finds k-number of cluster centres to minimize within-group variation of observations (DAs) and to maximize between-group variation. K-medians are more resistant to outliers than k-means.
Zeros were isolated as a separate category because zero is a unique and meaningful value for retail food establishments that represents no access to a given outlet type in an area. Any value above zero indicates that an outlet type is present in the buffer (i.e., there is some access). This dichotomy can represent two different types of food environments that would not have been captured if zero counts were included in the k-median groupings.
1.5: Guidelines for Use
1.5.1: Caution for analysis of certain DAs in rural areas
1-km and 3-km buffers may be too small to capture some residents’ food shopping behaviour, particularly in rural DAs. Since the buffer is drawn around the population-weighted centroid of each DA, the buffers in rural areas tend to be closer to the population-centre, which is often where food stores operate. This may mean that the access to a food store is overestimated for those residents who live further from the population centre.
2: Protocol for Deriving the Can-FED Measures
2.1: Software
The Geographic Information Systems software package used to derive Can-FED measures was ArcMap (version 10.7.1). ArcMap was used for most data preparation, including creating a road network dataset, creating food environment buffers, and calculating food environment densities. Food outlet data from the Statistics Canada Business Register were provided as separate Microsoft Excel spreadsheets. Microsoft Excel was used to categorize food outlet types before being imported into ArcMap.
2.2: Acquiring Data
Statistics Canada data was the primary source used to derive DA buffers around 2016 DA representative points, to extract food outlet data by NAICS codes from the Statistics Canada Business Register, and to create a road network using 2016 Road Network Files.
DA representative points came from Statistics Canada Geographic Attribute File, which contains geographic data at the dissemination block level. A research contract was signed between the researchers and Statistics Canada to provide access to the Business Register. Data were stored at a secure site at the headquarters of Statistics Canada in Ottawa and are not available for public download. Food outlets were extracted if they had an operating outlet as of July 2018. Road network data and DA representative point data are both free, open-use sources. Road Network Files come from the National Geographic Database, a shared databased between Statistics Canada and Elections Canada. DA boundary files came from Statistics Canada.
Links to data sources and download URLs are provided below.
Data source descriptions, reference URLs, and download URLs used towards creating food environment measures
Data Source: Representative Points (population-weighted centroids)
- Description
- The representative points for dissemination areas (DAs) are weighted using the population mean centre. DAs are the smallest standard geographic area for which census data are disseminated across Canada and have populations of 400 to 700 people.
- Reference URL
- https://www12.statcan.gc.ca/census-recensement/2016/ref/dict/geo040-eng.cfm
- Download URL
- Geographic Attribute File
https://www150.statcan.gc.ca/n1/en/catalogue/92-151-X - File Format
- Shapefile (.shp)
Data Source: Business Register (BR)
- Description
- The BR is a central repository of baseline information on businesses and institutions operating in Canada. Responding to the survey is mandatory, and all outlets are consistently classified with a NAICS code that identifies the primary function of a business.
- Reference URLs
- https://www150.statcan.gc.ca/n1/pub/12-501-x/12-501-x2016001-eng.pdf
https://www23.statcan.gc.ca/imdb/p2SV.pl?Function=getSurvey&SDDS=1105
- Download URL
- Geographic Attribute File
https://www150.statcan.gc.ca/n1/en/catalogue/92-151-X - File Format
- Microsoft Excel (.xlsx)
Data Source: Road Network File (RNF)
- Description
- The RNF is a digital representation of Canada's national road network, containing information such as street names, types, directions, and address ranges. Statistics Canada Road Network Files are available for every year beginning in 2012 and archived for 2011 and earlier.
- Reference URL
- https://www12.statcan.gc.ca/census-recensement/2011/geo/RNF-FRR/index-eng.cfm
- Download URL
- https://www150.statcan.gc.ca/n1/en/catalogue/92-500-X
- File Format
- Shapefile (.shp)
Data Source: Administrative Area Boundary Files (2016)
- Description
- Boundary files portray geographic areas using only the major land mass of Canada and its coastal islands.
- Reference URL
- https://www12.statcan.gc.ca/census-recensement/2011/geo/bound-limit/bound-limit-eng.cfm
- Download URL
- https://www12.statcan.gc.ca/census-recensement/2011/geo/bound-limit/bound-limit-2016-eng.cfm
- File Format
- Shapefile (.shp)
2.3: Food Outlet Data Preparation
Food outlets were extracted from the Statistics Canada Business Register if they had an operating outlet as of July 2018 and if the level 5 (six-digit) NAICS code associated with the outlet indicated that it was a type of food retail outlet. NAICS codes are nested within three level 1 (two-digit) codes.Note 9 Outlets with codes beginning with 44-45: ‘retail trade’ or 72: ‘accommodation and food services’ were identified as food retail outlets and extracted.
2.3.1: Superstores
Superstores were first derived by extracting records with NAICS code 452910 – Warehouse clubs. Next, the extracted operating business names were searched using a researcher-defined list of chain superstore names. Only outlets selected by this secondary search were categorized as Superstores.
2.3.2: Chain grocery stores
Chain Grocery Stores first were derived by extracting records with NAICS code 445110 - Supermarkets and other Grocery (except Convenience) Stores. Next, the extracted operating business names were searched using a researcher-defined list of chain grocery store names. Only outlets selected by this secondary search were categorized as Chain Grocery Stores.
2.3.3: Grocery stores
Grocery Stores were derived by extracting records with NAICS code 445110 - ‘Supermarkets and other Grocery (except Convenience) Stores.’ Only stores were not already defined as Chain Grocery Stores were classified as Grocery Stores.
2.3.4: Convenience stores
Convenience Stores were derived by extracting records with NAICS code 445120 - Convenience Stores.
2.3.5: Gas station convenience stores
Gas Station Convenience Stores were derived by extracting records with NAICS code 447110 - Gasoline Stations with Convenience Stores.
2.3.6: Bakeries
Bakeries were derived by extracting records with NAICS code 311811 - Retail Bakeries.
2.3.7: Fruit and vegetable markets
Fruit and vegetable stores were derived by extracting records with NAICS code 445230’ - Fruit and Vegetable Markets.
2.3.8: Meat markets
Meat Markets were derived by extracting records with NAICS code 445210 - Meat Markets.
2.3.9: Fish markets
Fish Stores were derived by extracting records with NAICS code 445220 - Fish and Seafood Markets.
2.3.10: Specialty food stores
Specialty stores were derived by extracting records with NAICS code - All Other Specialty Food Stores.
2.3.11: Confectionary stores
Confectionary Stores derived by extracting records with NAICS code 445292 - Confectionary and Nut Stores.
2.3.12: Full-service restaurants
Restaurants were derived by extracting records with NAICS code 722511 - Full-Service Restaurants.
2.3.13: Fast-food outlets
Fast-food outlets were derived by extracting records with NAICS code 722512 - Limited-Service Eating Places. Next, the extracted operating business names were searched using a researcher-populated list of chain fast-food chain names and keywords that allude to fast-food outlets (e.g., “burger,” “pizza,” “fried,” “frite,” “2 for 1,” “fries”) to further define the limited-service eating places as Fast-Food Outlets.
2.3.14: Cafés
Cafés were first derived by extracting records with NAICS code 722512 - Limited-Service Eating Places. Next, the extracted operating business names were searched using researcher-populated list of café chain names and keywords that allude to cafés (e.g., “coffee,” “java,” “café”) to further define the limited-service eating places as Cafés. Only those outlets that were not already defined as Fast-Food Outlets and contained one of the café-specific keywords were classified as Cafés.
2.3.15: Other limited-service food outlets
Other Limited-Service Food Outlets were defined by making a request on NAICS code 722512 - Limited-Service Eating Places and excluding those that were already defined as either Fast-Food Outlets or Cafés.
2.3.16: Drinking places
Drinking Places were derived by extracting records with NAICS code 722410 - Drinking Places.
2.3.17: Liquor stores
Liquor Stores were derived by extracting records with NAICS code 445310 - Beer, Wine and Liquor Stores.
2.3.18: Dollar stores
Dollar stores were first derived by extracting records with NAICS code 452999 - All Other Miscellaneous General Merchandise Stores. Next, the extracted operating business names were searched using a researcher-populated list of chain dollar store chain names. Only records whose operating name contained one or more keywords of interest received the classification of Dollar Stores.
2.3.19: Chain pharmacies
Pharmacies were first derived by extracting records with NAICS code 446110 - Pharmacies and Drug Stores. Next, the extracted operating names were searched using a researcher-populated list of chain pharmacy chain names. Only records whose operating name contained one or more keywords of interest received the classification of Chain Pharmacies.
2.4: Food Outlet Data Cleaning
After all the retail food outlets were categorized, each category was checked for errors and cleaned. First, outlets were checked by filtering through the English and French operating names, and any outlet that was miscategorized (e.g., a burger restaurant in the Fruit and Vegetable Markets category) was flagged for re-categorization.
Duplicates were identified based on multiple observations having the same address and the same operating name (English or French) or very similar operating name; having the same address and the same legal name (English or French); having the same address and having both a blank operating name (English or French) and one outlet with an employee count >=0 and the other with an employee count ==0. This indicated that the store with an employee count of 0 likely went out of business.
Finally, records were removed if the operating name (English or French) contained a word that indicated that it was not a retail food outlet were removed (e.g., “taxi”, “vape”, “catering”, “traiteur”). Further details about data cleaning are provided in Appendix 2.
2.5: Spatial References
Once all food outlets were categorized, they were plotted in ArcMap using a common geographic projection system (NAD1983). Buffers and food environment measures were created by province or territory; therefore, different projected coordinate systems were used to improve locational accuracy based on the province’s or territory’s global location. Food outlets were projected into the corresponding coordinate systems using the Project tool in ArcMap. The coordinate systems used for each province and territory are summarized below.
Projected and geographic coordinate systems used for each Canadian province and territory
Alberta
Projected Coordinate System: NAD_1983_CSRS_10TM_AEP_Resource
WKID:
3403
Projection:
Transverse Mercator
False Easting:
0
False Northing:
0
Central Meridian:
-115
Scale Factor:
0.9992
Latitude of Origin:
0
Linear Unit:
Meter
Geographic Coordinate System: GCS_North_American_1983_CSRS
Datum:
D_North_American_1983_CSRS
Prime Meridian:
Greenwich
Angular Unit:
Degree
British Columbia
Projected Coordinate System: NAD_1983_BC_Environment_Albers
WKID:
3005
Projection:
Albers
False Easting:
1000000
False Northing:
0
Central Meridian:
-126
Standard Parallel 1:
50
Standard Parallel 2:
58.5
Latitude of Origin:
45
Linear Unit:
Meter
Geographic Coordinate System: GCS_North_American_1983
Datum:
D_North_American_1983
Prime Meridian:
Greenwich
Angular Unit:
Degree
Manitoba
Projected Coordinate System: NAD_1983_UTM_Zone_14N
WKID:
26914
Projection:
Transverse_Mercator
False Easting:
500000
False Northing:
0
Central Meridian:
-99
Latitude of Origin:
0
Linear Unit:
Meter
Geographic Coordinate System: GCS_North_American_1983
Datum:
D_North_American_1983
Prime Meridian:
Greenwich
Angular Unit:
Degree
New Brunswick
Projected Coordinate System: NAD_1983_CSRS_New_Brunswick_Stereographic
WKID:
2953
Projection:
Double Stereographic
False Easting:
2500000
False Northing:
7500000
Central Meridian:
-66.5
Scale Factor:
0.999912
Latitude of Origin:
46.5
Linear Unit:
Meter
Geographic Coordinate System: GCS_North_American_1983_CSRS
Datum:
D_North_American_1983
Prime Meridian:
Greenwich
Angular Unit:
Degree
Newfoundland and Labrador
Projected Coordinate System: NAD_1983_UTM_Zone_22N
WKID:
26922
Projection:
Transverse_Mercator
False Easting:
500000
False Northing:
0
Central Meridian:
-45
Scale Factor:
0.9996
Latitude of Origin:
0
Linear Unit:
Meter
Geographic Coordinate System: GCS_North_American_1983_CSRS
Datum:
D_North_American_1983
Prime Meridian:
Greenwich
Angular Unit:
Degree
Northwest Territories
Projected Coordinate System: NAD_1983_Northwest_Territories_Lambert
WKID:
3580
Projection:
Lambert_Conformal_Conic
False Easting:
0
False Northing:
0
Central Meridian:
-112
Standard Parallel 1:
62
Standard Parallel 2:
70
Latitude of Origin:
0
Linear Unit:
Meter
Geographic Coordinate System: GCS_North_American_1983_CSRS
Datum:
D_North_American_1983
Prime Meridian:
Greenwich
Angular Unit:
Degree
Nova Scotia
Projected Coordinate System: NAD_1983_CSRS_UTM_Zone_20N
WKID:
2961
Projection:
Transverse Mercator
False Easting:
500000
False Northing:
0
Central Meridian:
-63
Scale Factor:
0.9996
Latitude of Origin:
0
Linear Unit:
Meter
Geographic Coordinate System: GCS_North_American_1983_CSRS
Datum:
D_North_American_1983
Prime Meridian:
Greenwich
Angular Unit:
Degree
Nunavut
Projected Coordinate System: NAD_1983_UTM_Zone_21N
WKID:
26921
Projection:
Transverse_Mercator
False Easting:
500000
False Northing:
Central Meridian:
-57
Scale Factor:
0.9996
Latitude of Origin:
0
Linear Unit:
Meter
Geographic Coordinate System: GCS_North_American_1983_CSRS
Datum:
D_North_American_1983
Prime Meridian:
Greenwich
Angular Unit:
Degree
Ontario
Projected Coordinate System: NAD_1983_CSRS_Ontario_MNR_Lambert
WKID:
3162
Projection:
Lambert Conformal Conic
False Easting:
930000
False Northing:
6430000
Central Meridian:
-85
Standard Parallel 1:
44.5
Standard Parallel 2:
53.5
Latitude of Origin:
0
Linear Unit:
Meter
Geographic Coordinate System: GCS_North_American_1983_CSRS
Datum:
D_North_American_1983
Prime Meridian:
Greenwich
Angular Unit:
Degree
Prince Edward Island
Projected Coordinate System: Prince_Edward_Island_Stereographic
WKID:
2290
Projection:
Double_Stereographic
False Easting:
700000
False Northing:
400000
Central Meridian:
-63
Latitude of Origin:
47.25
Linear Unit:
Meter
Geographic Coordinate System: GCS_North_American_1983_CSRS
Datum:
D_North_American_1983
Prime Meridian:
Greenwich
Angular Unit:
Degree
Quebec
Projected Coordinate System: NAD_1983_Quebec_Lambert
WKID:
3162
Projection:
Lambert Conformal Conic
False Easting:
0
False Northing:
0
Central Meridian:
-68.5
Standard Parallel 1:
46
Standard Parallel 2:
60
Latitude of Origin:
44
Linear Unit:
Meter
Geographic Coordinate System: GCS_North_American_1983_CSRS
Datum:
D_North_American_1983
Prime Meridian:
Greenwich
Angular Unit:
Degree
Saskatchewan
Projected Coordinate System: NAD_1983_UTM_Zone_13N
WKID:
26913
Projection:
Transverse_Mercator
False Easting:
500000
False Northing:
0
Central Meridian:
-105
Latitude of Origin:
0
Linear Unit:
Meter
Geographic Coordinate System: GCS_North_American_1983_CSRS
Datum:
D_North_American_1983
Prime Meridian:
Greenwich
Angular Unit:
Degree
Yukon
Projected Coordinate System: NAD_1983_Yukon_Albers
WKID:
3578
Projection:
Albers
False Easting:
500000
False Northing:
500000
Central Meridian:
-132.5
Standard Parallel 1:
61.6666666666666
Standard Parallel 2:
68
Latitude of Origin:
59
Linear Unit:
Meter
Geographic Coordinate System: GCS_North_American_1983_CSRS
Datum:
D_North_American_1983
Prime Meridian:
Greenwich
Angular Unit:
Degree
3: Appendix 1
| Province or Territory | Total Number of DAs | Number of Included DAs | Number of Excluded DAs | Percentage of Excluded DAs |
|---|---|---|---|---|
| Alberta | 5803 | 5776 | 27 | 0.47 |
| British Columbia | 7617 | 7532 | 85 | 1.12 |
| Manitoba | 2183 | 2158 | 25 | 1.15 |
| New Brunswick | 1454 | 1454 | 0 | 0 |
| Newfoundland and Labrador | 1073 | 1057 | 16 | 1.49 |
| Northwest Territories | 98 | 90 | 8 | 8.16 |
| Nova Scotia | 1658 | 1656 | 2 | 0.12 |
| Nunavut | 50 | 45 | 5 | 10 |
| Ontario | 20159 | 20132 | 27 | 0.13 |
| Prince Edward Island | 295 | 295 | 0 | 0 |
| Quebec | 13658 | 13592 | 66 | 0.48 |
| Saskatchewan | 2474 | 2460 | 14 | 0.57 |
| Yukon | 67 | 65 | 2 | 2.99 |
| 0 true zero or a value rounded to zero | ||||
4: Appendix 2
4.1: General Procedure for Categorizing and Cleaning Food Outlet Data
4.1.1: Creating separate excel sheets for food outlet types
NAICS codes attributed to each outlet in the Business Register data were initially used to categorize outlets by types listed in Table 1. To limit misclassification, the steps below were followed in Excel to check the categories which outlets had been assigned, and to clean and recategorize the data where appropriate.
Note: “OperatingNameEng,” “LegalNameFR,” etc. are column headings in the original Excel spreadsheets from the Business Register.
Step 1: Re-categorize food outlets that belong to another category.
Search food outlets by name using keywords that allude to other categories that may need to be reclassified. Examples of keywords are provided in Table A2.
Select Data in the top main Excel toolbar → Filter → from dropdown in “OperatingNameEng” column → search keyword → give the correct classification code in “OutletCategory” column.
Repeat for “OperatingNameFr” column.
| Full Name | English Keywords | French Keywords |
|---|---|---|
| Superstores | Warehouse club | Entrepôt |
| Chain grocery stores Grocery stores |
Grocer* | Épicerie, supermarché |
| Convenience stores Gas station convenience stores |
Convenience, corner store | Dépanneur |
| Bakeries | Bake* | Patisserie, boulangerie |
| Fruit and vegetable markets | Fruit, vegetable | Fruiterie |
| Meat markets | Butcher, meat shop, deli | Boucherie, viande |
| Fish markets | Seafood, fish | Poissionerie, fruit de mer |
| Specialty food stores | Cheese, tea shops, herb, spice | Fromagerie, thé |
| Confectionary stores | Confectionary, ice cream (non-chain), chocolate, sweets, candy | Crèmerie, bar laitier |
| Restaurants | Restaurant | Bistro |
| Fast food stores | Any from the list of chain fast food, keywords alluding to fast food (e.g., fries, pizza) | Frites |
| Cafes | Coffee, java, chain coffee shops | Café |
| Other limited-service food stores | Sushi, juice bars, salad, bubble tea and milk tea chain brand name | Salade, jus, frais |
| Additional keywords for consideration | Catering, taxi, vape | Traiteur |
| Note: Depending on the category being cleaned, some keywords may be more (or less) relevant. For example, we did not re-classify those with “café” in the name from the restaurant category because many restaurants are called “XXX Café”. | ||
Below are suggested instances when to assume an outlet is correctly classified and no further reclassification is required. For example, sometimes the English or French operating names were a person’s name or were left blank. We assumed these food outlets were correctly classified because we had no evidence to suggest otherwise:
- When it is a person’s name
- When the operating name is blank
- When “consulting”, “marketing”, or something similar is used in the name because the retailer could be using a legal name
Step 2: Filter through each unique English operating name (i.e., “OperatingNameEng”) that has not been classified or reclassified in the previous step.
Select Data in the top main Excel toolbar → Filter → “OutletCategory” = blank → sort “OperatingNameEng” from A to Z → from dropdown in “OperatingNameEng” uncheck ‘Select All' → go through the dropdown list manually and check ones that do not belong.
Recode entries that do not belong to the correct category (e.g., “burger” in grocery store) or allude to another category. Populate the outlet type field with code “99” to those that should be removed (e.g., “taxi”)
Repeat for “OperatingNameFr” column.
Step 3: Check legal names of those Outlets with blank English and French operating names and see if they allude to another category.
Select Data in the top main Excel toolbar → Filter → dropdown in “OperatingNameEng” → check ‘Blanks’. Then with that selected, click dropdown menu in “OperatingNameFR” → check ‘blanks’.
Sort “LegalNameEng” from A to Z. In dropdown menu for “LegalNameEng”, scroll through the list and check any that need to be reclassified. Give remaining outlets an appropriate code.
Step 4: After all food outlets have been coded, move the mis-classified outlets into their correct food outlet type category.
4.1.2: Identifying food outlet duplicates
Step 1: Identify duplicate food outlets.
Sort “OperatingNameEng” from A to Z and sort “OPaddressStreet” from A to Z.
Highlight duplicate names, addresses, postal codes. Select “OperatingNameEng”, “OPaddressStreet”, “OPAddressPostalCode”.
Select the Home tab in the top main Excel toolbar → Conditional formatting → Highlight cells rules → Duplicate values. Review the highlighted outcomes to assess whether they meet the duplicate criteria below. Ensure the address is the same for any suspected duplicated outlets to confirm they are duplicates. Code the duplicate food outlets as “98” and delete.
Duplicate criteria:
- They have the same (or very similar) address
- AND
- They have the same operating name (English or French) OR very similar operating name
- OR
- They have the same legal name (English or French) OR very similar legal name
- OR
- One’s operating name is the same or very similar to the other’s legal name
- OR
- They both have blank operating names and one of them has an employee count of 0 (has to be 0, not just blank) – indicates that it probably went out of business
Note: There may be multiples of the same food outlet type located at shopping malls or airports. These occurrences are not duplicates and should not be categorized as such. Where addresses included ‘airport road’ or terminal name, it was assumed they were located at an airport.
5: Appendix 3
5.1: ArcGIS Instructions
5.1.1: Create a road network dataset
Step 1: Add 2016 Statistics Canada Road Network Files (Street Files) to ArcMap.
Start ArcCatalog. Notice that ArcCatalog is split into two panels. The left-side panel is the Catalog Tree (a categorized list of GIS contents) and the right-side panel is the Contents, Preview, and Description panel (providing different views and visualizations of datasets).
Enable the Network Analyst Extension required to create and edit network datasets by clicking Customize → Extensions → Network Analyst.
Connect the network dataset to the Catalog Tree by clicking Connect to Folder on the toolbar. Navigate to the folder with the network data and click OK to add a shortcut to the folder in the Catalog Tree under Folder Connections.
Step 2: Make a network dataset using the Network Analyst extension.
Expand the connected folder. Click on the network dataset then click on the projected street file dataset. Right click on the street file dataset and click New → Network dataset to open the New Network dataset wizard. Enter a name for the new network dataset. Set your dataset to the latest version and click Next.
Next set up the parameters and setting attributes for your network dataset. Select Yes to model turns in the network and check Restricted turns to select it as a turn feature source. Click Next. Click Connectivity to set up the connectivity model for the network. Make sure that the connectivity policy of streets is set to End Point. Click OK to return to the wizard and click Next. Select None when asked how you would like to model the elevation of your network dataset. Click Next. Select No when asked if you would like to use traffic data with the network dataset. Click Next.
Check the settings for network attributes reflect the following and then click Next:
Name: Length
Usage: Cost
Units: Meters
Leave travel mode blank and click Next. Select No when asked do you want to establish driving directions for the network dataset. Click Next. Check Build Service Area Index. Click Next and review the displayed summary of all your settings for the network dataset. Click Finish.
Select Yes when asked if you would like to build your network dataset. Select No when asked if you would like to add all features. The progress bar will disappear when the build process is finished. The built network dataset will be added to ArcCatalog along with the systems junction feature class. Preview the network dataset by clicking the Preview tab. Now you can add the network dataset to ArcMap and use it to create network analysis layers using the Network Analyst extension.
5.1.2: Create Food Environment Buffers
Step 1: Add DA population-weighted centroid points and DA boundary files to ArcMap and select which province or territory you’d like to work in.
Add the DA population-weighted centroids dataset and the DA boundary file dataset to ArcMap by clicking the Add Data button on the top main ArcMap toolbar and then navigating to the folder with the dataset. Click Add. Both data layers should be displayed in the Table of Contents and the points and polygons should appear in the Map Window.
To work within one province or territory, use the Select by Attribute feature to select which location you’d like to continue in. Click on Selection in the top main ArcMap toolbar→ Select by Attributes to open the Select by Attributes dialogue box. Select either the centroid dataset or boundary dataset from the Layer drop-down list and specify the selection by choosing Create a new selection from the Method drop-down list.
Enter a query expression by using the expression building tools displayed. Double click on the category header for provinces or territories (the header will appear in the query box) → double click on the (=) sign (the = sign will appear in the query box) → Get Unique Values → select the province or territory you would like to work in (the location will appear in the query box surrounded by single quotation marks).
Validate your query expression by clicking Verify and then click OK to execute your expression. The chosen province or territory is now selected. Right click on the data layer and select Open Attribute Table. Review that the correct province or territory is highlighted. Close the Attribute Table.
Export and save the selected centroids or boundaries as a separate data layer by right clicking on the data layer → Data → Export Data. Save the data as a shapefile in an appropriate folder and with an appropriate name. Add the new dataset into ArcMap.
Ensure that any selections are cleared and that no attributes are selected before moving further by navigating to Selection in the top main ArcMap toolbar → Clear Selected Features.
Repeat for either the centroid or boundary file (whichever dataset you did not specify the province or territory for yet). Repeat for the remaining provinces and territories. You can now unselect the Canada wide dataset in the Table of Contents window and work within your selected locations.
Note: Repeat this step for the road network dataset and food outlet datasets as you continue in Section 5.1.2 and 5.1.3.
Step 2: Make a service area layer using the Network Analyst tool.
Display the Network Analyst toolbar and open the Network Analyst window to make a service area layer. To display the toolbar, click Customize → Toolbars → Network Analyst. To open the analyst window, click the Show/Hide Network Analyst Window button on the toolbar.

Input the road network dataset that was made earlier by selecting it from the drop-down menu. To make a service area layer (buffer), click Network Analyst in the toolbar → New Service Area from the drop-down list. The service area layer will be added to the Network Analyst window and the analysis layer will be added to the Table of Contents.

Next set up the parameters for your analysis. Click on the Analysis Layer Properties button in the Network Analyst window or right-click the Service Area layer in the Table of Contents and click on Properties.

The Layer Properties dialogue box will open. Click on the General tab and change the output layer name to PB_1000 or PB_3000 (depending on the size of your buffers – 1000 refers to 1000-m and 3000 refers to 3000-m).
Click on the Analysis Settings tab and set the Impedance to Metres. Set the default break values to the size of the buffer (e.g., 1000 for 1000-m or 3000 for 3000-m). Select the direction to be Away from Facility. Choose Not Allowed from U-turns at Junctions drop down list. Check Ignore Invalid Locations so that the solve does not fail if you have unlocated network locations (regardless of if this box is checked, the analysis will ignore invalid locations but would alternatively not continue solving valid locations). Check the One-way box under Restrictions.
Click on the Polygon Generation tab and ensure that Generate Polygons is checked (this box is checked by default). For Polygon Type select Detailed to model service areas more accurately (Note: expect that detailed polygons will take longer to generate than generalized polygons). For Line Generation select True Lines. Leave the remaining settings to their default.
Click Apply to save the settings and then click OK to exit the dialogue box.
Step 3: Add population-weighted centroids as facility locations to the service area layer.
Add the facilities (population-weighted centroids) for which the service area will be generated by right-clicking on Facilities in the Network Analyst window → Load Locations. Choose the population weighted centroid data layer from the drop-down list under Load From and click OK.
In the Network Analyst window, click on the (+) sign next to the Facilities(#) to see a list of the loaded population-weighted centroids.
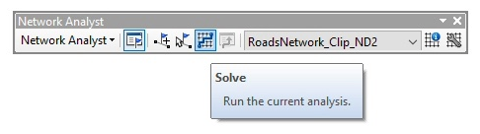
Step 4: Solve the Network Analysis to create polygon buffers.
Click on the Solve button in the Network Analyst toolbar to run the analysis. The service area polygons will appear on the map and in the Network Analyst window. Review the analysis for accuracy.
Step 5: Export the polygon buffers as a data layer.
Export the polygons as a shapefile so that you save all information about the layer features and can use the polygons as the buffer layer towards calculating food environment densities. Right click on Polygons in the Service Area layer → Data → Export Data. Save the data as a shapefile in an appropriate folder and with an appropriate name (e.g., PB_1000 or PB_3000).
Next, import the polygon layer to the geodatabase. Select the Add Data button in the and then navigate to the polygon buffer shapefile. Once the polygon buffer shapefile is added to the ArcMap window and Table of Contents, you may delete the service area layer.
Step 6: Create a column that specifies DA identification in the polygon buffer layer.
Notice that the polygon buffer layer did not store DA IDs, rather each facility was assigned an Object ID instead that was associated with each population weighted centroid.
To specify the DA ID in the polygon buffer layer, create a column in the Attribute Table. Right click on the polygon buffer layer → Open Attribute Table → Table Options button in the window → Add Field → enter DAuid under Name → select Text from the drop-down list under Field Type.
Right click the header DAuid → Field Calculator → Select Python → Double click name in Fields box and type “[:8]” to keep the first 8 digits (it will look like: !Name! [:8]). The DA IDs should now be associated with each polygon buffer.
Step 7: Repeat Steps 2 – 6 for the remaining buffer size.
5.1.3: Calculating food environment densities
Step 1: Import categorized food outlets to ArcMap and specify the geographic coordinate system you are working in.
Ensure that any selections are cleared and that no attributes are selected by navigating to Selection in the top main ArcMap toolbar → Clear Selected Features.
Click Add Data → Add XY Data and navigate to the folder with the categorized food outlet type spreadsheets. Add one food outlet type spreadsheet to ArcMap at a time. An XY Data property table will appear. Select the Excel table that contains XY coordinates and specify the X Field as the longitude column and the Y Field as the latitude column. Specify the Geographic Coordinate System for the points withing the province/territory of interest. The data points will appear in the ArcMap window and the associated layer in the Table of Contents.
Step 2: Select outlets by province or territory and project data into the appropriate province or territory coordinate system (Table 4).
Open the Project (Data Management) tool.

Select a food outlet data shapefile as the Input Dataset or Feature Classand specify the Outlet Dataset or Feature Class location with a new appropriate title and in an appropriate location. Next, specify the Output Coordinate System as the projected provincial or territorial system provided in Table 4 by either searching for it by name or finding it through the Projected Coordinate System drop down menu. Click OK. The projected food outlet dataset will automatically add as a new data layer.
Step 3: Repeat Steps 1 – 2 for all food outlet types.
Step 4: Create a new field with type within the Attribute Table for each food outlet name to help sum the food outlet points within the Service Area buffer.
Right click on a food outlet type layer and open the Attribute Table. Right click on the heading for which you want to make a calculation and click Field Calculator.
Type and build the following expression in the text area: FOOD OUTLET = 1. Click OK.
Step 5: Spatial Join food outlets to a polygon buffer layer.
Use the Spatial Join tool by clicking Geoprocessing in the top main ArcMap toolbar → ArcToolbox → (+) sign beside Analysis Tools → (+) sign beside Overlay → Spatial Join. Alternatively, you can search for Spatial Join by typing ‘Ctrl+F’ to open the Search window or clicking on the Search icon in the main ArcMap toolbar → search “Spatial Join” in the search bar → Spatial Join (Analysis).
On the Spatial Join analysis, select the polygon buffer layer you want to join to (e.g., PB_1000m or PB_3000m) from the Target Features drop-down list. Select the food outlets points layer you want to join from the Join Features drop-down list. Click on the folder icon beside Output Feature Class and navigate to the folder where you want to save the spatial join output. Give the spatial join output an appropriate name and click Save.
Leave the Join Operation as by default JOIN_ONE_TO_ONE. Leave the Keep All Target Features box checked as by default and leave all the features in the Field Map of Join Features selected as by default or delete any fields you do not want to join by highlighting a field and then clicking the X icon. Do not delete the Food Outlet Field.
Right click the Food Outlet Field in the Field Map of Join Features → Merge Rule → Sum. Select Intersect from the Match Option drop-down list. Leave the Search Radius blank.
Click OK to run the spatial join. The Spatial Join output will automatically be added as a data layer in the map window and in the Table of Contents.
Step 6: Add a new field in the Attribute Table for each type of food outlet.
Right click on the food outlet type data layer → Open Attribute Table → Table Options button in the window → Add Field → enter Density under Name → select Double from the drop-down list under Field Type.
Step 7: Calculate density of retail outlets per kilometre.
Right click on the Density header → Field Calculator. In the field calculator window, enter the following equation to divide the count of outlets within each buffer by the corresponding buffer area:
([CS]/[buffer area])*1000
Note: If the area isin meters, the output must be multiplied by 1000 to make density in kilometers scale.
Step 8: Repeat Steps 1 – 2 for each food outlet type data layer.
- Date modified: