|
||||||
|
|
|
|
|
|
|
|
|
|
|
|
|
|
|
||||||
Information identified as archived is provided for reference, research or recordkeeping purposes. It is not subject to the Government of Canada Web Standards and has not been altered or updated since it was archived. Please "contact us" to request a format other than those available.

|
|
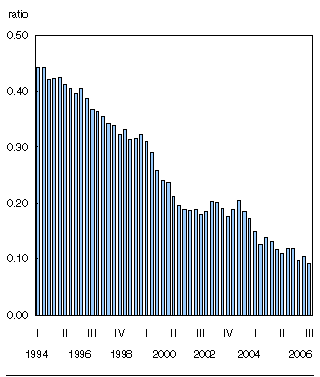
International investment positionThird quarter 2006Canada's net liability to foreign residents fell to its lowest point in a quarter-century at the end of September. Net external liability – the difference between the value of our international liabilities and our international assets – reached $131.9 billion at the end of the third quarter, down 12.5%, or $18.8 billion, from the end of the second quarter. It was the lowest level since the end of 1980, when international assets represented only half of international liabilities. The value of Canada’s international assets rose $40.7 billion to $1,137.0 billion at the end of the quarter. There were gains in most asset categories led by Canadian direct investment abroad and Canadian holdings of foreign bonds. At the same time, Canada's international liabilities increased $22.0 billion to $1,269.0 billion. Two-thirds of this increase was due to a gain in foreign direct investment in Canada. The variation of the Canadian dollar against foreign currencies had very little impact on the value of existing holdings during the third quarter. The Canadian dollar gained 1.6% against the Japanese yen and 0.7% against the euro. But it lost 1.4% against the pound sterling and was virtually unchanged compared to the US dollar. Net liabilities represented 9.2% of Canada’s gross domestic product at the end of the third quarter, the lowest proportion ever, down from 10.5% at the end of the second. This proportion has been declining steadily from a peak of 44.3% in 1994. Canada’s international investment
position General rise in assets abroadCanadian direct investment abroad reached $487.8 billion at the end of September, up $11.4 billion from the end of June. This increase came mostly from injections of working capital into existing foreign affiliates and reinvested earnings. Of this total, direct investment in the United States amounted to $216.7 billion. Canadian investors continued to purchase foreign bonds at a good pace during the third quarter. As a result, Canadian holdings of foreign bonds rose $9.3 billion to a record $112.4 billion. Most of this increase was directed to overseas bonds, Canadians increased their holdings of overseas bonds by about 22% in the third quarter. In two years, Canadians have more than doubled their holdings of foreign bonds, from $53.4 billion to $112.4 billion. Foreign bonds represented 10% of Canada's international assets at the end of the quarter compared to just 5% two years ago. Foreign content limits for tax-deferred Canadian investment vehicles were eliminated during 2005, contributing to the increase. Canadian investors also increased substantially their holdings of foreign money market paper at the end of the quarter. These holdings reached $17.6 billion, up by 38.6% from the second quarter. As was the case for bonds, most of this increase was directed to overseas paper and especially that denominated in Canadian dollars. At the same time, holdings of foreign stocks reached $195.5 billion, up $2.4 billion. While Canada’s official international reserves were stable, levels of other asset categories, such as loans and deposits, were up at the end of September. Liabilities: Jump in foreign direct investmentForeign direct investment in Canada jumped $14.2 billion to $447.8 billion at the end of September, the biggest quarterly increase since 2000. Foreign direct investors increased their investment position in Canada mainly through acquisitions in the third quarter. Foreign direct investment from the United States reached $280.7 billion, up $3.5 billion from the previous quarter. On the other hand, direct investments from all other countries amounted to $167.1 billion, up $10.7 billion. Since the end of 2004 the foreign direct investment position in Canada increased 17.5%, or $66.8 billion, while Canadian direct investment abroad rose only 8.1%, or $36.4 billion. Canada’s net direct investment asset (the difference between Canadian direct investment abroad and foreign direct investment in Canada) was at $40.0 billion at the end of September, down from $70.4 billion at the end of 2004. Over this period, the decrease in net direct investment asset has been an offset to the overall reduction of the country’s net external liability. Foreign holdings of Canadian securities stableForeign portfolio investment in Canadian securities including stocks, bonds and money market paper, was stable at the end of September compared to the previous quarter. Foreign holdings of Canadian bonds were up $2.7 billion in value to $371.9 billion while, foreign holdings of Canadian stocks decreased slightly to reach $114.2 billion. At the same time, foreign holdings of Canadian money market paper fell $1.1 billion to $25.9 billion after a strong increase in the second quarter. Finally, loan liabilities to non-residents, mostly short-term loans, rose by $5.0 billion to $49.0 billion. Canada’s net international liabilities
to GDP Statistical tableInformation on methods and data quality available in the Integrated Meta Data Base: 1537. |
|
|