
Canada at a Glance 2018
Agriculture

Archived Content
Information identified as archived is provided for reference, research or recordkeeping purposes. It is not subject to the Government of Canada Web Standards and has not been altered or updated since it was archived. Please "contact us" to request a format other than those available.
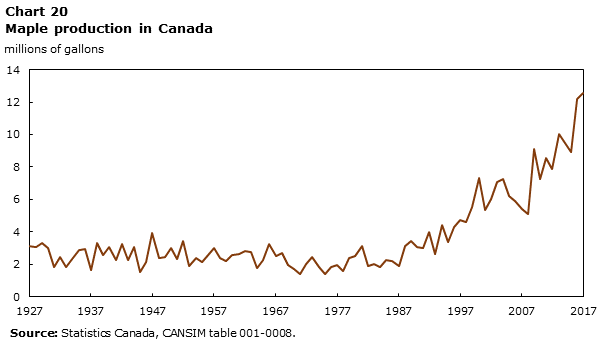
Data Table for Chart 20
| Year | Millions of gallons |
|---|---|
| 1927 | 3.14 |
| 1928 | 3.07 |
| 1929 | 3.34 |
| 1930 | 3.01 |
| 1931 | 1.83 |
| 1932 | 2.44 |
| 1933 | 1.84 |
| 1934 | 2.33 |
| 1935 | 2.91 |
| 1936 | 2.95 |
| 1937 | 1.67 |
| 1938 | 3.30 |
| 1939 | 2.59 |
| 1940 | 3.10 |
| 1941 | 2.28 |
| 1942 | 3.25 |
| 1943 | 2.30 |
| 1944 | 3.09 |
| 1945 | 1.53 |
| 1946 | 2.14 |
| 1947 | 3.92 |
| 1948 | 2.39 |
| 1949 | 2.48 |
| 1950 | 2.98 |
| 1951 | 2.31 |
| 1952 | 3.45 |
| 1953 | 1.92 |
| 1954 | 2.37 |
| 1955 | 2.17 |
| 1956 | 2.59 |
| 1957 | 3.01 |
| 1958 | 2.37 |
| 1959 | 2.23 |
| 1960 | 2.55 |
| 1961 | 2.65 |
| 1962 | 2.82 |
| 1963 | 2.79 |
| 1964 | 1.77 |
| 1965 | 2.25 |
| 1966 | 3.23 |
| 1967 | 2.50 |
| 1968 | 2.70 |
| 1969 | 1.96 |
| 1970 | 1.71 |
| 1971 | 1.39 |
| 1972 | 2.05 |
| 1973 | 2.49 |
| 1974 | 1.82 |
| 1975 | 1.44 |
| 1976 | 1.83 |
| 1977 | 1.94 |
| 1978 | 1.61 |
| 1979 | 2.37 |
| 1980 | 2.52 |
| 1981 | 3.13 |
| 1982 | 1.90 |
| 1983 | 2.00 |
| 1984 | 1.81 |
| 1985 | 2.27 |
| 1986 | 2.22 |
| 1987 | 1.91 |
| 1988 | 3.13 |
| 1989 | 3.44 |
| 1990 | 3.07 |
| 1991 | 2.99 |
| 1992 | 4.01 |
| 1993 | 2.67 |
| 1994 | 4.45 |
| 1995 | 3.37 |
| 1996 | 4.29 |
| 1997 | 4.74 |
| 1998 | 4.62 |
| 1999 | 5.55 |
| 2000 | 7.32 |
| 2001 | 5.36 |
| 2002 | 6.01 |
| 2003 | 7.05 |
| 2004 | 7.28 |
| 2005 | 6.18 |
| 2006 | 5.93 |
| 2007 | 5.38 |
| 2008 | 5.13 |
| 2009 | 9.08 |
| 2010 | 7.27 |
| 2011 | 8.55 |
| 2012 | 7.86 |
| 2013 | 10.05 |
| 2014 | 9.48 |
| 2015 | 8.91 |
| 2016 | 12.16 |
| 2017 | 12.53 |
| Source: Statistics Canada, CANSIM table 001-0008. | |
| 2011 | 2016 | 2011 to 2016 | |
|---|---|---|---|
| number | % change | ||
| Total | 205,730 | 193,492 | -5.9 |
| Cattle | 49,613 | 46,538 | -6.2 |
| Hogs and pigs | 3,470 | 3,305 | -4.8 |
| Poultry and eggs | 4,484 | 4,903 | 9.3 |
| Sheep and goats | 3,924 | 3,056 | -22.1 |
| Other animals | 24,124 | 19,792 | -18.0 |
| Oilseeds and grains | 61,692 | 63,628 | 3.1 |
| Vegetables and melons | 4,822 | 5,514 | 14.4 |
| Fruit and tree nuts | 8,253 | 7,845 | -4.9 |
| Greenhouse and nursery | 7,946 | 6,449 | -18.8 |
| Other crops | 37,402 | 32,462 | -13.2 |
| Source: Statistics Canada, CANSIM table 004-0200. | |||
| 2011 | 2016 | 2011 to 2016 | |
|---|---|---|---|
| tonnes | % change | ||
| Total finfish | 132 146 | 160 054 | 21.1 |
| Salmon | 110 328 | 123 522 | 12.0 |
| Trout | 5 600 | 9 507 | 69.8 |
| Steelhead | 694 | 0 | -100.0 |
| Other finfish | 788 | 1 237 | 57.0 |
| Total shellfish | 37 560 | 40 511 | 7.9 |
| Clams | 1 513 | 1 962 | 29.7 |
| Oysters | 9 779 | 13 824 | 41.4 |
| Mussels | 25 897 | 24 584 | -5.1 |
| Scallops | 300 | 38 | -87.3 |
| Other shellfish | 71 | 103 | 45.1 |
| Source: Statistics Canada, CANSIM table 003-0001. | |||
- Date modified: