
Statistics Canada Quality Guidelines
Guidelines for ensuring data quality
Skip to text
Text begins
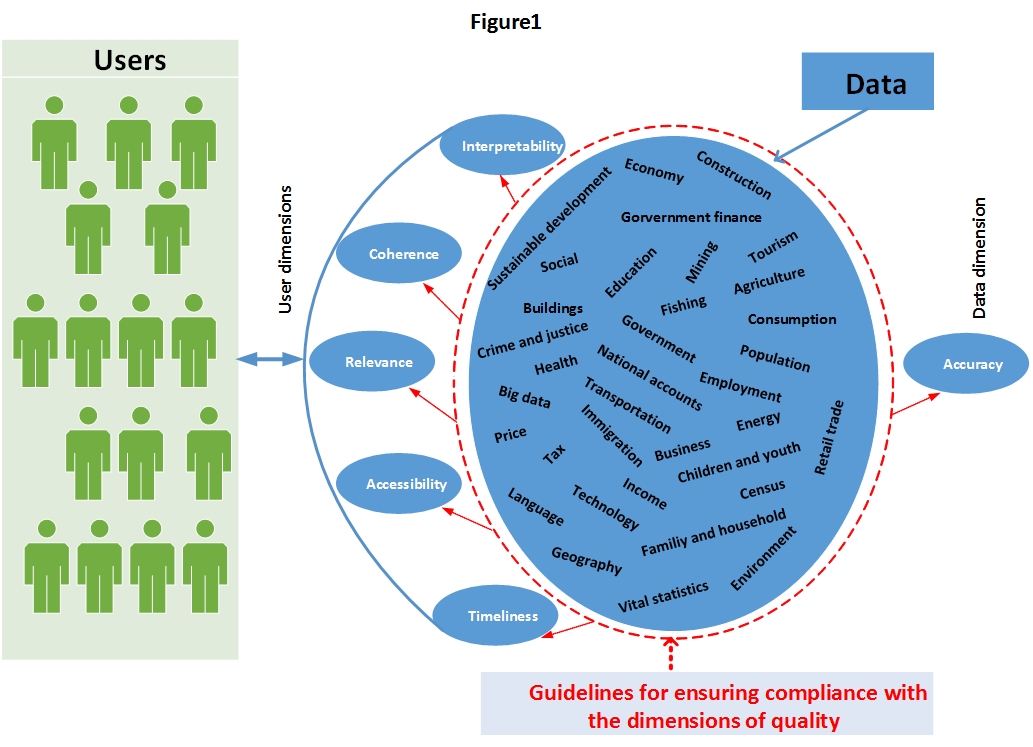
In the Canadian statistical system, data quality is defined by six quality dimensions: relevance, accuracy, timeliness, accessibility, interpretability, and coherence. The QAF, which describes strategies to aid and ensure effective quality management in all statistical programs and organizational initiatives, identifies these dimensions in its guiding principles. These six dimensions are addressed in the QAF to describe what statistical organizations must do to ensure quality across their organization. In these guidelines, they help to assess whether the data produced are fit for use. Figure 1 illustrates the scope of the guidelines. It shows that, regardless of the type of data, ensuring compliance with the dimensions serves to ensure data quality.
Description for Figure 1
Figure 1 illustrates the idea that regardless of the type of data to be produced, compliance with the six dimensions of quality leads to quality products. The figure is split into two sections: the right part represents the data dimension and the left part represents the user dimension. In the right part, data enters a sphere that contains multiple key words related to a variety of subjects for which statistics are produced. Even though these key words do not represent an exhaustive list of topics for which statistics are produced, they give examples of subjects such as:
- Construction
- Economy
- Sustainable development
- Government finance
- Social
- Buildings
- Education
- Mining
- Tourism
- Fishing
- Agriculture
- Crime and justice
- Health
- Government
- Consumption
- Population
- National accounts
- Employment
- Energy
- Big data
- Transportation
- Business
- Children and youth
- Retail trade
- Price
- Tax
- Income
- Language
- Technology
- Immigration
- Geography
- Vital statistics
- Census
- Family and household
- Environment.
This sphere is circled by a line representing that the guidelines cover all of these subjects and are useful to ensure compliance with the dimensions of quality. This global circle containing all the subjects for which statistics can be produced then points to the six dimensions of quality; namely relevance, accuracy, coherence, interpretability, timeliness and accessibility. The user dimension is represented by multiple figures of persons. Finally, a double-sided arrow shows that the relationship between the data dimension and the user dimension works in both directions.
The following sections describe how the Canadian statistical system ensures quality data by managing the six dimensions effectively. For each dimension, the first subsection presents a definition, followed by a brief explanation of the importance of the dimension (the “why”) and the objectives it addresses. The second subsection provides guidelines to guide the statistical organizations’ personnel in completing their tasks. Considering that how quality dimensions are managed directly affects the quality of the statistical products, the third subsection proposes quality indicators that not only measure the dimension, but also evaluate it against the intended objectives.
Relevance
Definition, importance and objectives
The relevance of statistical information refers to the degree to which it meets real user needs. Data are relevant when they relate to the issues users care about most. This dimension allows national statistical offices (NSOs) to adjust the direction of their programs, as needed. However, assessing relevance is subjective because it depends on various user needs.
The human, material and financial resources for each program are generally considered under this dimension. Therefore, the greatest challenge for any NSO is to gauge the conflicting needs of current and potential users in order to design a program that best meets their key needs, given the resource constraints. The mechanisms for ensuring relevance not only provide basic control over the other quality dimensions, but also assess user needs in relation to the other dimensions.
We must therefore gauge the relative importance of the data needs and explore different alternatives. This notion is important because it determines the optimal balance between users’ need for data and respondents’ need for privacy protection. Although it may be difficult to evaluate this aspect, it is essential to devote an appropriate effort to it.
Guidelines for ensuring data relevance
- Create and maintain a list of current and potential users of all the statistical organization’s statistical products.
- Maintain bilateral and multilateral contact with the key users.
- Periodically evaluate the statistical programs.
- Realign program priorities, as needed, as part of a strategic planning process. This can be done by reviewing emerging information needs and the relevance of current programs.
- Consider how changes to a statistical program will affect other related programs.
- Clearly state the goals and objectives of the statistical activities.
- Determine the data uses and level of user satisfaction.
- Determine parameters to establish the optimal balance between the need for data and the impact on the privacy of Canadians, and choose the best option among those considered.
Indicators of quality for relevance
- An updated list of program data users
- The level of program data compliance with regional and international standards
- The number of online consultations of program products
- The rate of user satisfaction with program products
- The percentage of users who actually use the statistical product.
Timeliness and punctuality
Definition, importance and objectives
The timeliness of statistical information refers to the delay between the information reference point (or the end of the reference period) and the date on which the information becomes available. Punctuality refers to the difference between planned and actual availability.
Effectively managing this dimension ensures that the data produced and released remain relevant. The timeliness of information must be planned from the design phase of the statistical activity. Planning is often based on compromises between the precision sought, cost and data availability. Timeliness is therefore important. Regular follow-ups should be scheduled and activity progress monitored to prevent problems and to detect poor practices, which can lead to extreme delays.
Guidelines for ensuring data timeliness
- Check if there is a legislative mandate for data release. If there is, it may reduce the flexibility of the implementation schedule and the ability to modify it.
- Plan and develop a schedule for each production phase and ensure they are carried out with regular follow-up mechanisms.
- Negotiate sharing agreements with data providers for planned and timely recurrent transfers.
- Agree with data providers on an availability calendar for their databases.
- Consider external factors when planning and developing the release schedule.
- Announce the release schedule in advance, as well as the planned date changes.
- For certain programs, adopt a preliminary data dissemination strategy, following up with revised and final figures which are more current.
- Use new technologies to shorten release times.
- Assess the feasibility of releasing preliminary data, followed by revisions.
- Inform users about timeliness constraints.
- Set a new release date for any discrepancies with the planned schedule in advance.
- Assess the importance of users’ needs relative to the length of time required to meet them.
Indicators of quality for timeliness
- A start and end date for each phase of the production process
- A dissemination schedule
- A follow-up and contingency plan
- A document on the needs assessment
- The degree of punctuality according to the planned release schedule (the number of days, months or years of delay from the original release date)
- The period between the reference date and the release date
- The period between the release dates of the preliminary and final versions.
Accuracy and reliability
Definition, importance and objectives
The accuracy of statistical information is the degree to which the information correctly describes the phenomena it was designed to measure. Accuracy is often characterized by errors in statistical estimates and is typically broken down into bias (systematic error) and variance (random error). It may also be described in terms of the major sources of error likely to result in inaccurate data (e.g., coverage, sampling, non-response). Related to accuracy, reliability reflects the degree to which statistical information, consistently over time, correctly describes the phenomena it was designed to measure.
With this dimension, the main objective is for the data produced to reflect reality as accurately as possible. Managing accuracy requires special attention during the design, implementation and evaluation phases of the statistical activity. Therefore, the level of accuracy attained is a function of the methods and processes established to detect and control potential errors in the various phases of the statistical activity.
The acceptable level of accuracy is determined and justified based on the optimal balance between user needs and the level of protection of privacy required to satisfy these needs, budgetary, material and human resource constraints, as well as contextual factors related to the execution of the statistical activity.
Guidelines for ensuring data accuracy
- Use appropriate quality control methods and quality assurance processes to detect and control potential errors in the various phases of the production process.
- Consult with administrative data providers to validate concepts and understand data processing in their original business context (e.g., use, coverage, collection and reconciliation cycle, missing or low-quality values) and make the necessary adjustments.
- Follow up with data providers if variables and/or data appear to be missing or incorrect.
- Determine the quality of record linkage from different files (e.g., matching administrative data to statistical registers).
- Minimize and assess coverage and classification errors of the statistical units in the frame.
- Pre-test and test all versions of the data collection instruments (e.g., questionnaires, data capture platforms, imputation and estimation programs or software, transfer modules).
- Choose unbiased and minimally biased sampling procedures, such as probabilistic sampling procedures.
- Consider using non-probabilistic methods only in a valid inference framework (Beaumont 2018) or if there is no other alternative.
- Select a sample design that optimizes the accuracy of the data produced.
- Check the survey sample against the original sample design.
- Check the representativeness of the data.
- Have a collection follow-up plan to improve response rates and data quality.
- Minimize and assess processing errors (data capture, edit and imputation, file manipulation, etc.).
- Check that the calculation of weights corresponds to a known total.
- Identify and describe the main reasons for non-response (non-contact, refusal, ineligible, etc.).
- Assess the extent of errors due to non-response.
- Provide a variance estimation that takes into account the sample design and various manipulations performed on the survey data (non-response adjustment, imputation, calibration, etc.).
- Validate the models used and the underlying assumptions.
- Use other sources to compare, evaluate and validate calculated estimates.
- Use new technologies to automate procedures as much as possible, thus minimizing errors from manipulation and data inconsistency.
- Evaluate the relative importance of user needs and respondent privacy needs to determine the optimal balance.
Indicators of quality for accuracy
The first five of the following seven indicators are generally related to the accuracy of data from sample survey processes. Research is underway at Statistics Canada to develop indicators for data from other statistical business processes. This research will also verify the suitability of using some of the indicators used to measure survey data. The results of this research will be added to the next edition of these guidelines.
- Coverage rate
- Response rate
- Variance (coefficient of variation)
- Imputation rate and ratio
- Imputation variance
- Measurement error
- Precocity or closure errors (for population estimates).
Accessibility and clarity
Definition, importance and objectives
The accessibility and clarity of statistical data refers to the ease with which users can learn that the information (including metadata) exists, find it, view it and import it into their own work environment. It also refers to whether the information or medium is appropriate. For some users, the cost of information may also affect accessibility.
As part of this dimension, users should be able to determine what information they are requesting and if it meets their needs. Accessibility is closely tied to relevance, where user satisfaction with a statistical product must be measured not only in terms of the product’s content, but also with respect to how it is disseminated.
In terms of dissemination, the Canadian statistical system aims to maximize usage of the information it produces while ensuring that dissemination costs do not reduce the organization’s ability to collect and process data. The dissemination policies of statistical organizations and delivery systems determine most aspects of accessibility.
Guidelines for ensuring data accessibility
- Establish a system for documenting and archiving statistical data.
- Design statistical products that are well integrated with the statistical organization’s cataloguing systems.
- Periodically ensure archived files are accessible to users.
- Establish procedures early in the life course of repetitive surveys to ensure that all important files are retained.
- Follow procedures for distributing restricted-use files, as needed.
- Apply a disclosure control methodology that minimizes suppressions.
- Provide multiple access and extraction methods.
- Take advantage of new data visualization technologies.
- Make data files accessible for future analytic activities.
- Ensure that the products comply with the requirements of the organization’s policies and standards for accessibility, or refer to Statistics Canada’s Policy on Access to Information, Policy on Microdata Access and Policy on Highlights of Publications.
- Ensure that the products comply with the organization’s requirements, or refer to Statistics Canada’s Policy on Informing Users of Data Quality and Methodology.
- Inform users of available publications, publication frequency and main output modes.
- Organize official release sessions for results of statistical processes.
- Write and publish clear and concise press releases about the statistical product.
- Conduct user satisfaction surveys on ease of access and dissemination modes.
Indicators of quality for accessibility
- A system for archiving and storing the statistical product
- Availability of the statistical product in several formats
- A reference for the statistical product within the archiving and storage system
- The organization of official release sessions for the statistical product
- A press release on the statistical product
- User satisfaction measures for ease of access and dissemination modes.
Interpretability
Definition, importance and objectives
The interpretability of statistical information refers to the availability of supplementary information and metadata needed to interpret and use statistical information appropriately. This information normally covers the underlying concepts, variables and classifications used, the methodology of data collection and processing, and indications of the accuracy of the statistical information.
The Canadian statistical system is responsible for providing sufficient information for users to be able to interpret statistical information effectively. Communicating metadata, or information about information, is key to managing interpretability.
Guidelines for ensuring data interpretability
- Consult the organization’s data interpretability policy, or refer to Statistics Canada’s Policy on Informing Users of Data Quality and Methodology and the Directive on Documenting Statistical Metadata.
- Ensure that the organization’s metadatabase is up to date. A template for completing and updating records in Statistics Canada’s Integrated Metadatabase (IMDB) is available.
- Provide access to information on the uses and objectives associated with the data to ensure transparency.
- Ensure that quality indicators are available so that users are fully informed and can understand the strengths and limitations of the data.
Indicators of quality for interpretability
- A copy of the methodological documents about the data, available to users at all times
- A metadatabase that is up to date, available to users, and includes quality indicators
- An assessment report for the statistical process, available internally.
Coherence and comparability
Definition, importance and objectives
The coherence and comparability of statistical information refer to the degree to which it can be reliably combined and compared with other statistical information within a broad analytical framework over time. To improve coherence, it is important to use standard concepts, classifications and target populations, as well as a common methodology across surveys. Coherence does not necessarily imply full numerical consistency.
Guidelines for ensuring data coherence
- Keep concepts, definitions, classifications and methodologies up to date.
- Keep an up-to-date document of methodologies and frameworks for acquiring administrative data and collecting data from field operations.
- Use a common frame for all surveys of the same type.
- Use common wording for questions.
- Document how new classifications and concepts affect statistical series.
- Comply with established standards. Otherwise, clearly document the reasons why the standards were not used and how this affects the comparability and coherence of the product.
- When necessary, specify the differences between concepts and methods used at different times for the same variables.
- Assess and document the effects of using different methods at different times.
- Evaluate the differences between local practices, regional practices and international practices, if they exist.
Indicators of quality for coherence
- Concepts, definitions and classifications that comply with established standards
- Compliance with regional and international standards for statistical methods
- A description of the inconsistency when it cannot be fully explained by accuracy.
- Date modified: