2. Background
Yan Lu
Previous | Next
2.1 Chi-squared tests
in a single frame survey
Consider a one-way
frequency table with classes and associated finite
population proportions with Let denote the observed cell
frequencies in a sample falling in each of categories with Under SRS, the Pearson
chi-squared statistic for testing simple hypothesis
is given by
For complicated
designs, involve noncentral distributions.
It is natural to consider a more general statistic
where is a consistent estimator of under a specified sampling design
Let represent the vector of estimated proportions
with be the corresponding vector of hypothesized
proportions; be the covariance matrix of and be the estimate of obtained from the survey data.
The generalized Wald statistic
is distributed asymptotically as under for sufficiently large
Rao and Scott
(1981) showed that under in (2.2) is distributed
asymptotically as a weighted sum of independent random variables The s are the eigenvalues of a design
effect matrix where is the covariance matrix
corresponding to SRS when
is true, i.e. The standard result of Pearson
test is recovered under SRS. Let
be an estimate of and the Rao-Scott first order
corrected test refers to When the full estimated
covariance matrix is known, a better approximation
to the asymptotic distribution of is to match the first moment and
second moment of the test statistic to a distribution. The Rao-Scott (Rao
and Scott 1981) second-order corrected test statistic considers This statistic is approximately a
chi-squared random variable on degrees of freedom, where is an estimate of with and If the design effects are all
similar, the first and second-order corrections will behave similarly.
Otherwise, the second order correction almost always performs better.
2.2 Framework of
chi-squared tests and pseudo maximum likelihood estimator in dual frame surveys
The set up in this
section follows from Hartley (1962) and Lu and Lohr (2010). Assume there are categories in both surveys and
the same quantities are measured. Let be the population proportion of
category in domain (domain can be domain domain or domain ), with Let and denote the population sizes of
the three domains respectively, with and We consider the common case that is unknown, while and are constants. As a result, and (see Figure 2.1 for
illustration of the proportions). The vector of proportions for the union of the two frames
is a function of the parameters For example, a natural form of is
where
Figure 2.1: Population proportion in domains and frames
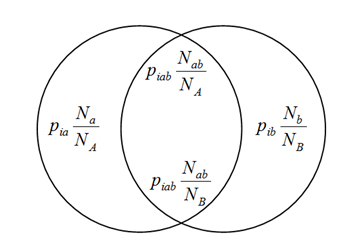
Description for Figure 2.1
In the following,
we briefly review the pseudo maximum likelihood estimator that we will use in
Section 4 and Section 5. Assume independent simple random samples are taken
from frames and respectively. The likelihood
function is
where represent the units falling in
category within domain and domain respectively; and represent the units falling in
category within the overlapping domain that are originally sampled from
frame and frame respectively.
For the estimators
of complex surveys, the basic idea is to use a working assumption of a
multinomial distribution from a finite population to give the form of the
estimators and use a design effect to adjust the cell counts to reflect the
complex survey design. The pseudo likelihood function is as follows
where design effect is defined as and are the observed sizes of and and denote the estimated counts
according to the survey design. The pseudo maximum likelihood estimators
(PMLEs), found by maximizing (2.6) are and
where and and is the smaller root of the
quadratic function
The estimators of
the population proportions are
If SRSs are taken
in each frame and these PMLEs reduced to PMLEs in
Skinner and Rao (1996).
Previous | Next
