2 Sample design and survey procedure
Anne Massiani
Previous | Next
The survey is conducted in Switzerland using a four-panel
rotation scheme. Each year a new sample of households is selected to replace an outgoing panel. The
subscript is used here for samples of households; the
subscript will be reserved for samples of persons. In
accordance with the notation of Lavallée (2002), the superscripts refer to samples selected directly, while the
superscript will be used in the rest of the document for
samples selected indirectly. The new panel selected will be followed for four
years according to the following scenario:
-
In the first year we first approach the households of to complete a preliminary questionnaire called
the "grid�. The variables identified in the grid are common to the entire
household and relate primarily to its composition. The subsample of that responds to the grid is denoted The sample of individuals belonging to the households
of is denoted and these individuals are called
longitudinals. The households of reached in the first survey year are then asked to complete a joint
questionnaire for the entire household,
called the household questionnaire.
-
In the following three years for to 3, an attempt is made to recontact the
longitudinals of aged 16 and over to survey their households
based on the household composition in year since households may change over time. All
individuals in these households are integrated into the survey for year and are called cross-sectional individuals.
Households for year that are reached by means of longitudinal that is, households reached indirectly are asked to again complete the grid and then
the household questionnaire. However, it is not possible to recontact all the
longitudinals, especially because some of
them have moved, and this is a major cause of non-response and sample attrition.
We now set a given survey year and adopt a cross-sectional approach, meaning
that we are interested in the estimates that can be produced for the population
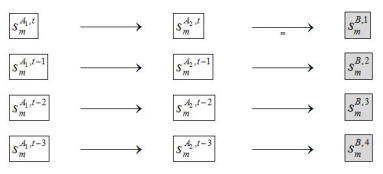
present in year The sample surveyed during survey year consists of four panels contacted for the
first, second, third or fourth time respectively. Let denote the sample of households responding to
the household questionnaire in the wave, for As seen in Figure 2.1, the sample was contacted via the longitudinals selected
in year The shaded parts on the right represent the
samples participating in the survey in year (indirect sampling), while the samples on the
left contain the initial households of the longitudinals through whom they were
contacted (direct sampling).
Figure 2.1
Panels comprising the sample surveyed in year
Description for Figure 2.1
Below is a more detailed description of the sampling
design for for Households' composition may change over time,
and therefore in the rest of the document, we will use the notation to designate households in the first survey
year and the notation to designate those in survey year so as to distinguish them. Each sample is obtained from two selection stages.
-
Stage 1: a sample of households is selected according to a design stratified
by major region, of which there are seven in Switzerland. Within each stratum,
draws are conducted according to a simple design. Here, denotes the first order of probability of
inclusion of household and denotes the second order of probability of
inclusion of households and
-
Stage 2: the second selection stage is
based on non-response to the grid in the first survey year This non-response is modeled using a Poisson
design on households, and we note for any household
(2.1)
For all
households and we define as follows:
(2.2)
(2.3)
Finally, for all
longitudinals and belonging respectively to households and let
(2.4)
For practical reasons, samples for are drawn in such a way as to be disjoint,
which means that this is also the case with samples On the other hand, the four samples are theoretically not necessarily
disjoint, since there is a possibility that two longitudinals selected in two
different waves will belong to the same household in the survey year.
Considering the small sample sizes, this is extremely unlikely and has actually
never been observed thus far. The fact is that when complete, a panel consists
of approximately 3,600 households drawn with probabilities of selection for which the highest value is 0.0011.
However, it should be noted that the methodology used would lend itself to
processing non-disjoint samples. Let
and a weight called the household cross-sectional weight,
is calculated for each household of The individuals in the households of are denoted by and each individual of a household of receives the weight
The information used to calculate the poverty and social
exclusion indexes is based on the income of each household of Some components of the household's income are
taken from the household questionnaire completed by all households of Other income components, such as wages, must
again be obtained from questionnaires, this time from the individual
questionnaires administered to members of the households of In the case of complete or partial
non-response to individual questionnaires or of partial non-response to the
household questionnaire, some components of the income of households are missing. In some cases, especially
where there is a lack of information on wages, missing values can be obtained
from other sources based on administrative data. In the remaining cases, they
are imputed. In this article, we do not take the effect of imputations into
account. Under these conditions, the income of each household of is known and the non-responses observed in the
different stages of the survey are household total non-responses: non-response
to the successive grids and total non-response to the household questionnaire.
Since the poverty and social exclusion indexes are calculated for individuals
and not households, the income of each household is divided by a factor that
depends on the number of persons in the household and their age. The result of
this calculation, called equivalent income, is assigned to each individual of The poverty and social exclusion indexes are
calculated on the basis of equivalent income and the weights
Previous | Next
