
Analytical Studies Branch Research Paper Series
Investment Slowdown in Canada After the Mid-2000s: The Role of Competition and Intangibles
DOI: https://doi.org/10.25318/11f0019m2024001-eng
Text begins
Acknowledgments
An early version of the paper was presented during the 2021 Canadian Economics Association meeting. The data development required for this research project was supported by the Business Development Bank of Canada. The author would like to thank Bob Fay, Danny Leung, Sylvie Ratté and Weimin Wang for helpful comments.
Abstract
Investment in fixed capital has been weak in Canada since the mid-2000s. The ratio of investment to net capital stock and investment per worker declined after 2006, especially after 2014. As a result of this investment slowdown, the growth in labour productivity declined after 2006. This paper examines the sources of this weakness in capital investment in Canada using firm-level data. It finds that investment per worker declined by 20% from 2006 to 2021, and the decline in investment per worker was more significant in large and medium-sized firms, as well as in foreign-controlled firms, compared with that in small firms and in domestic-controlled firms. The weakness in capital investment after 2006 coincided with a change in the mix of investment toward intangible investment, and this shift toward intangibles was more pronounced among large and foreign-controlled firms. The paper finds that an increase in industry concentration and a decline in firm entry rates have a negative effect on firm investment, and the effect is larger among small firms. These findings are interpreted as evidence that a decline in competition leads to a decline in investment or competition promotes investment among firms, especially among small firms. After 2006, industry concentration changed little, while firm entry rates declined sharply. These decreasing entry rates accounted for 30% of the decline in investment per worker after 2006.
1 Introduction
Investment in fixed capital and increases in capital intensity have been the most important contributors to the growth in labour productivity in Canada since 1980 (Baldwin and Gu, 2007; Statistics Canada, 2022). But since the mid-2000s (or around the time of the 2007/2008 financial crisis), capital investment in Canada has been weak and investment intensity (such as the investment-to-capital-stock ratio and investment per worker) has declined, contributing to slower labour productivity growth in Canada during this period (Gu and Willox, 2018). Weak capital investment and the investment slowdown after the mid-2000s are not unique to Canada. They also occurred in the United States and most other Organisation for Economic Co-operation and Development countries, and they occurred before the financial crisis and after the early 2000s in these countries (Fernald et al., 2017; Ollivaud, Guillemette and Turner, 2016).
This weak capital investment has been examined in many previous studies. Several argue that low investment is explained by weak aggregate demand and reflects the response of investment to the negative demand shock following the financial crisis (Bussière, Ferrara and Milovich, 2015; Fay et al., 2017; Ollivaud, Guillemette and Turner, 2016). But this explanation cannot be the only one for weak capital investment, as weak capital investment relative to historical trends coincided with high profitability and a high expected rate of return as summarized in high Tobin’s Qs during this period.
This period of weak capital investment was also one of digital transformation and increase in the role of intangibles such as software and data in many advanced countries (Haskel and Westlake, 2017). It also showed a decline in business dynamism and competition, manifested in decreasing firm turnover and rising concentration in these countries. Several papers have shown that declining competition and the increasing importance of intangibles are related to weak investment in fixed tangible assets during this period (Gutiérrez and Philippon, 2017a; Crouzet and Eberly, 2019). That is, competition increased investment, and the decline in competition observed in the United States after 2000 accounted for part of the decline in investment during that period. In addition, the decline in investment fixed tangible assets in the United States is associated with an increase in intangibles. When the estimate of investment is expanded to include physical assets and intangible asserts, the decline in investment in the United States will be much lower. Combined, the decline in competition and rise in intangibles accounted for most of the weak investment in the United States since the early 2000s.
This paper contributes to the understanding of the investment slowdown in Canada by focusing on the role of intangibles and competition. Specifically, the paper asks three questions:
- What is the recent trend in investment in fixed tangible assets at the aggregate business sector level and by firm type?
- Is the recent decline in investment per worker after 2006 related to recent changes in industry concentration and firm dynamism?
- Are there shifts in the composition of investment toward intangibles among Canadian firms that may mitigate the recent decline in investment in fixed tangible assets?
While this paper focuses on the role of intangibles and competition in the investment slowdown, it also examines several other firm-specific factors that may be related to investment and its slowdown. These factors include firm leverage, defined as the debt-to-asset ratio; the factors related to financial constraints, measured by the retained earnings-to-asset ratio and profit-to-asset ratio; and firm size (Mairesse, Hall and Mulkay, 1999; Fazzari, Hubbard and Petersen,1987; Cao and Leung, 2020).
The rest of this paper is organized as follows. Section 2 summarizes the previous studies on the role of competition and shifts toward intangibles for the recent decline in investment intensity in Canada and other advanced countries. Section 3 presents the trends in investment using both aggregate industry statistics and firm-level data. Section 4 summarizes previous studies on the role of competition and intangibles in the recent investment slowdown in the United States and other advanced countries. Section 5 examines the composition of investment to determine whether there is a shift toward intangibles in Canadian firms. Section 6 presents the results of a regression analysis for firm investment as a function of concentration, firm entry and exit rates, and other firm-specific factors. Section 6 concludes the paper.
2 Previous studies on the role of competition and intangibles
This section summarizes previous evidence on the role of competition and intangibles in the recent weakness in the United States and other advanced countries.
2.1 The role of competition
A theory of competition and investment is required to consider the effects of competition on investment. The existing theories of competition and investment highlight two offsetting effects of competition on investment: the positive escape-competition effect and negative Schumpeter effect. Firms in a competitive industry have more incentive to invest to escape the competition—this concept is called the escape-competition effect, or Arrow’s replacement effect (Arrow, 1962). The Schumpeter effect of competition is the view that imperfectly competitive markets encourage investment by allowing firms to appropriate more value from their investment (Schumpeter, 1943).
Which of these two effects is larger depends on the market structure, types of investment and innovations. It may also depend on the types of firms. If firms have more incentive to invest to escape competition from others, the escape-competition effect is likely to be larger, and competition will likely have a positive effect on investment in these firms. By contrast, if firms have less incentive to invest to escape competition from others, the escape-competition effect is likely to be smaller, and competition will likely have a negative effect on investment in these firms. A firm’s incentive to invest to escape competition depends on the difference between the post-investment and pre-investment profit of the firm. To the extent that large firms already have high market power and high profits compared with small firms, the escape-competition effect would be less significant for large firms and more significant for small firms. Thus, competition would be more likely to increase investment among small firms than among large firms.
To examine the effect of competition on investment, previous studies measure the extent of competition or competitive intensity by industry concentration and business entry and exit rates.
While high concentration of an industry typically indicates less competition, this may not be the case. Industry concentration is based on domestic sales of the firms operating in a country. It may not capture the full extent of competition, because competition in an open economy may come from foreign producers that sell in domestic markets. In theory, the extent to which high concentration is related to less competition depends on the causes of high concentration. Market conditions and production technologies in an industry, such as e-commerce, may force the least efficient firms to exit and lead to high concentration. In such cases, high concentration may not be related to less competition. By contrast, if high concentration is related to high markup, the concentration is an indicator of less competition. But the consensus is that high concentration is related to less competition. In such cases, high industry concentration is expected to reduce investment to the extent that competition increases investment.
Entry rates are also used to measure competition. In general, high firm entry rates indicate a more competitive industry with low entry barriers, fewer market frictions and declining shares of individuals in prime-entrepreneurship age (Decker et al., 2016; Hathaway and Litan, 2014). High entry rates are expected to increase investment when competition increases investment. However, high entry rates may not necessarily reflect high competition, and low entry rates may not necessarily reflect low competition. First, low entry rates may reflect changes in technologies, such as the rise of intangibles that increase the scale of efficient production and reduce the number of firms that enter and become successful. In such cases, low entry rates may not be related to low investment. Second, low entry rates may be attributable to demographic changes, with low population growth and weak demand shock following the financial crisis. In such cases, low entry rates indicate declining investment opportunities, and the decreasing entry rates are related to the declining investment.
Exit rates are also used to measure competitive intensity. In general, high firm turnover, with high exit rates, indicates a more competitive industry. In such cases, the exit rates are positively related to investment among firms when competition encourages investment. But high exit rates may also signal industries with declining investment opportunities or, in general, an unfavourable business environment. In such cases, exit rates are negatively related to investment among firms.
In general, whether changes in entry and exit rates are positively or negatively related to investment in firms depends on the underlying causes of the changes. The exact causes of recent changes in entry and exit rates in Canada and other advanced countries are still uncertain (Decker et al., 2016; Cao et al., 2017).
2.2 Role of intangibles
Intangible assets such as innovation, intellectual property assets and brand equity have long been recognized as important sources of productivity growth. However, the significance of these intangible assets gained new attention during the second half of the 1990s, when productivity growth in advanced economies picked up because of the adoption of information and communications technology (ICT) and the rise of intangibles such as software, online platforms and data that are complementary to ICT. The first attempt to develop a comprehensive measure of intangibles by Corrado, Hulten and Sichel (2005, 2009) shows that the intangibles have increased their importance over time and intangible investment is often as important as investment in tangible assets for growth in labour productivity in the United States.Note A recent paper by Gu and Macdonald (2023) found that investment in intangibles rose much faster than investment in tangible assets in the business sector for Canada. From 2006 to 2019, investment in intangibles increased at 2.4% per year in the business sector, while investment in tangible assets changed little, at 0.3% per year.
Despite the rising importance of intangibles relative to tangibles in advanced economies, much of these intangibles are not recognized as investments in the aggregate statistics produced by national statistical agencies or recorded as assets and investments in firm accounts (income statements and balance sheets). It is possible that if intangible investment is properly captured and added to the measure of investment in tangible assets, investment will not be that weak. Such is the case for the United States, as shown by Gutiérrez and Philippon (2017a) and Crouzet and Eberly (2019).
Only a small share of the intangibles that should be classified as investment that generates income streams in the future is included as capital in the current system of national accounts and in the official statistics on investment that are produced at national statistical agencies. For example, Statistics Canada includes only research and development (R&D), software, and mineral exploration in the estimates of investment in fixed capital that are presented in the industry productivity database. The same practices are followed by the U.S. Bureau of Economic Analysis and other national statistical agencies. Therefore, the evidence on weak capital investment presented above is mostly based on investment in physical capital and omits most intangibles such as data, and brand equity.
At the firm level, intangibles are more difficult to measure. The firm-level database that is used above contains accounting and income tax data such as income statements, balance sheets and records of investment that can be treated as capital for the calculation of capital cost allowance for income tax purposes. The accounting convention means that intangible investment is generally not capitalized. Though some of it may eventually be booked as intangible capital in the balance sheets, especially following mergers and acquisitions, and as the acquisition of assets or investment for assets such as patents, licences and goodwill for calculating capital consumption allowance and corporate income tax.
3 Recent trends in capital investment
This section will present recent trends in capital investment in the aggregate business sector and at the firm level. The trend for the aggregate business sector is derived from an industry productivity database, and the trend at the firm level is derived from a firm-level database. The investment and capital stock are deflated and expressed in 2012 prices.
The industry productivity database is from Statistics Canada’s Multifactor Productivity Program. The database includes multifactor productivity (MFP) and related measures (output, capital input, labour input and intermediate input) for the business sector, broad economic subsectors and their constituent industries. The industry productivity database is constructed using data from the national accounts and thus is fully consistent with the official estimates of investment, labour and output from the national accounts (Baldwin, Gu and Yan, 2007).
The firm-level database used for this paper is the National Accounts Longitudinal Microdata File (NALMF). The database provides financial variables of firms (revenues, net income, payrolls, profits, operating expenses and assets) and employment for all incorporated businesses in Canada from 2000 to 2021. The investment on that file is derived from Schedule 8 of T2 Corporation Income Tax Returns. All incorporated businesses are required to file Schedule 8 to report the purchase of tangible assets during a year and several categories of intangibles acquired, including patents, licences and goodwill, to deduct a part of the investment (called capital consumption cost allowance) from the income to derive the taxable income. The NALMF captures all investments in tangible physical assets (such as machinery and equipment); building construction by incorporated firms; and intangible investment related to patents, licences and goodwill.
3.1 Trends in capital investment in the total business sector
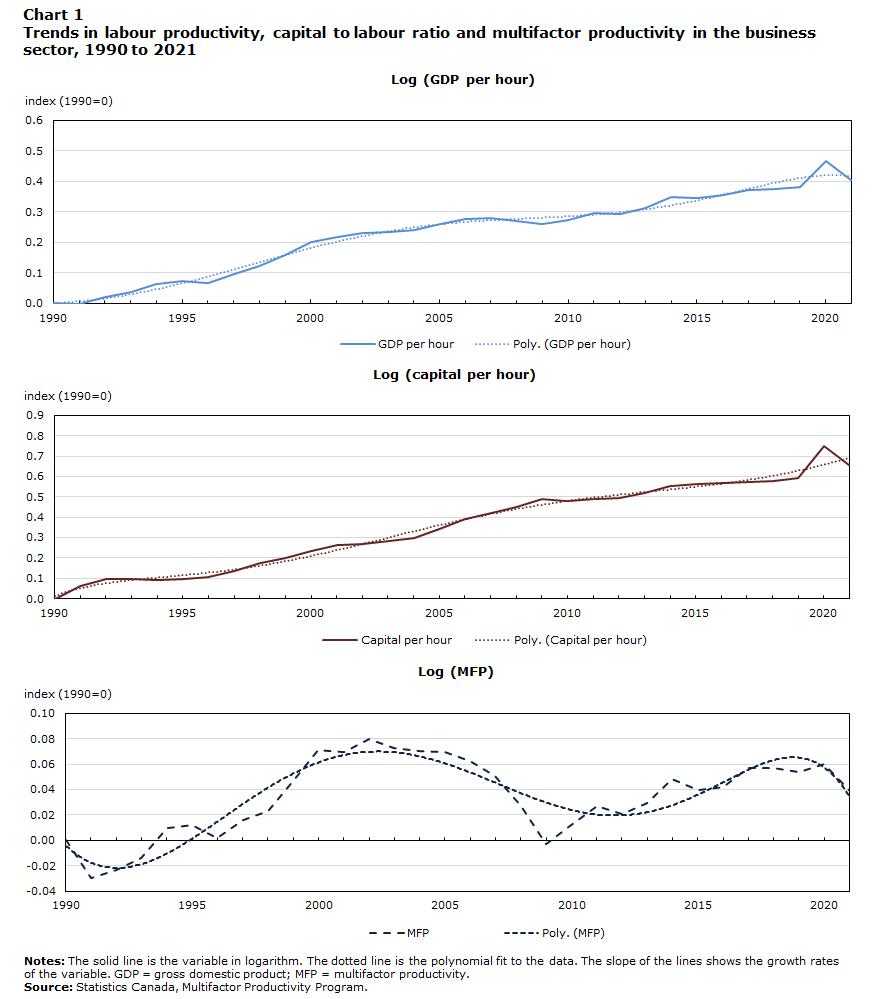
Before presenting the trends in capital investment, this section first presents the trends in labour productivity and its components, including the effect of capital deepening in the business sector. Chart 1 shows labour productivity and its two components that affect growth in labour productivity—capital intensity and MFP—for the total business sector for the period from 1990 to 2021. The third component of labour productivity growth—labour compositional changes toward more educated and more experienced workers—is not shown, because it is not the focus of this paper.
The solid lines of Chart 1 show the log levels of the series in labour productivity (gross domestic product per hour worked), capital intensity (capital input per hour worked) and MFP. The dashed lines in Chart 1 also plot the cyclically adjusted series using a polynomial trend. The slopes of these lines show the change in these series.
As is visible from Chart 1, there is a break in the slopes of these lines. The exact time when the breaks occur and when the slopes become flatter differs for those variables. The break occurs in 2000 for labour productivity and MFP. For the capital-to-labour ratio, the break occurs in 2006. The log changes or the growth in labour productivity and MFP declined after 2000, while the growth in capital intensity declined after 2006.
Data table for Chart 1
| Log (GDP per hour) | Log (capital per hour) | Log (MFP) | |
|---|---|---|---|
| index (1990=0) | |||
| 1990 | 0 | 0 | 0 |
| 1991 | -0.001 | 0.063 | -0.030 |
| 1992 | 0.021 | 0.096 | -0.024 |
| 1993 | 0.038 | 0.098 | -0.014 |
| 1994 | 0.062 | 0.091 | 0.010 |
| 1995 | 0.072 | 0.099 | 0.012 |
| 1996 | 0.067 | 0.106 | 0.002 |
| 1997 | 0.098 | 0.137 | 0.016 |
| 1998 | 0.121 | 0.173 | 0.023 |
| 1999 | 0.158 | 0.202 | 0.047 |
| 2000 | 0.201 | 0.234 | 0.071 |
| 2001 | 0.216 | 0.264 | 0.070 |
| 2002 | 0.230 | 0.268 | 0.079 |
| 2003 | 0.233 | 0.282 | 0.073 |
| 2004 | 0.239 | 0.297 | 0.070 |
| 2005 | 0.261 | 0.343 | 0.070 |
| 2006 | 0.276 | 0.390 | 0.062 |
| 2007 | 0.279 | 0.418 | 0.051 |
| 2008 | 0.269 | 0.448 | 0.027 |
| 2009 | 0.260 | 0.491 | -0.003 |
| 2010 | 0.274 | 0.479 | 0.012 |
| 2011 | 0.295 | 0.489 | 0.027 |
| 2012 | 0.294 | 0.496 | 0.020 |
| 2013 | 0.313 | 0.518 | 0.030 |
| 2014 | 0.349 | 0.554 | 0.048 |
| 2015 | 0.346 | 0.562 | 0.039 |
| 2016 | 0.354 | 0.569 | 0.042 |
| 2017 | 0.372 | 0.570 | 0.057 |
| 2018 | 0.376 | 0.575 | 0.057 |
| 2019 | 0.382 | 0.592 | 0.054 |
| 2020 | 0.465 | 0.748 | 0.060 |
| 2021 | 0.404 | 0.654 | 0.040 |
|
Notes: The solid line is the variable in logarithm. The dotted line is the polynomial fit to the data. The slope of the lines shows the growth rates of the variable. GDP = gross domestic product; MFP = multifactor productivity. Source: Statistics Canada, Multifactor Productivity Program. |
|||
As the focus of this paper is on weak investment and the slowdown in capital intensity growth, the analysis will concentrate on the break that occurs in 2006 for investment and provide a comparison of growth in labour productivity, MFP and capital intensity between the 1990-to-2006 and 2006-to-2021 periods. The comparison is presented in Table 1.
| 1990 to 2006 | 2006 to 2021 | 2020 | 2021 | |
|---|---|---|---|---|
| percent per year | ||||
| Gross domestic product growth | 3.1 | 1.3 | -6.6 | 5.0 |
| Hours growth | 1.3 | 0.5 | -14.0 | 11.6 |
| Labour productivity growth | 1.7 | 0.9 | 8.6 | -5.9 |
| Contributions to labour productivity growth | ||||
| Capital intensity | 1.0 | 0.7 | 6.7 | -3.9 |
| Labour composition | 0.4 | 0.3 | 1.1 | 0.0 |
| Multifactor productivity growth | 0.4 | -0.2 | 0.7 | -2.1 |
|
Notes: The growth rates represent annual compound growth rates. Numbers may not add up because of rounding. Source: Statistics Canada, Table 36-10-0208-01. |
||||
Labour productivity growth was relatively high in the 1990s and early 2000s. It can be traced to the implementation of the Canada–U.S. Free Trade Agreement in 1989 and the spread of ICT after the mid-1990s. But after 2006, annual labour productivity growth in the business sector declined. It declined from 1.7% in the period from 1990 to 2006 to 0.9% in the period from 2006 to 2021. This 0.8 percentage point decline in labour productivity growth after 2006 can be attributed to declines in its three components. The decline in capital intensity accounted for 0.3 percentage points, or 40%, of the 0.8 percentage point decline in the labour productivity slowdown after 2006.
For the 1990-to-2006 and 2006-to-2021 periods, investment in fixed capital has been the most important contributor to the growth in labour productivity in Canada. But the effect of capital intensity declined after 2006. The increase in capital intensity contributed 1.0 percentage point per year to labour productivity growth from 1990 to 2006. From 2006 to 2021, the increase in capital intensity contributed 0.7 percentage points to annual labour productivity in the Canadian business sector.
Charts 2 and 3 look more closely at the trend in investment rates in the business sector. Despite some large movements in employment and investment in 2000 and 2021, investment per worker and the investment-to-capital ratio continued to show a declining trend. Therefore, the two charts plot the trends for a period that includes two years during the COVID-19 pandemic. Chart 2 shows the ratio of gross capital investment to net capital stock. Chart 3 shows gross investment in constant dollars per worker that is indexed to 100 in 2006. The weakness in capital investment that started around the time of the financial crisis is evident in those two charts. From 1990 to 2006, the ratio of gross investment to net capital stock increased. It rose from 9% in 1990 to about 13% in 2006. Since then, it has shown a steady decline.Note A similar trend is observed in the series on gross investment per worker from 1990 to 2021. The investment per worker increased before 2006. Since then, it has declined, especially after the collapse of commodity prices that started in 2014 (Fay et al., 2017). From 2006 to 2021, investment per worker declined by about 15% in the business sector.

Data table for Chart 2
| Investment to capital stock | |
|---|---|
| ratio | |
| 1990 | 0.095 |
| 1991 | 0.090 |
| 1992 | 0.083 |
| 1993 | 0.081 |
| 1994 | 0.087 |
| 1995 | 0.087 |
| 1996 | 0.091 |
| 1997 | 0.103 |
| 1998 | 0.106 |
| 1999 | 0.106 |
| 2000 | 0.109 |
| 2001 | 0.108 |
| 2002 | 0.103 |
| 2003 | 0.107 |
| 2004 | 0.114 |
| 2005 | 0.122 |
| 2006 | 0.127 |
| 2007 | 0.124 |
| 2008 | 0.122 |
| 2009 | 0.098 |
| 2010 | 0.108 |
| 2011 | 0.116 |
| 2012 | 0.119 |
| 2013 | 0.119 |
| 2014 | 0.120 |
| 2015 | 0.106 |
| 2016 | 0.095 |
| 2017 | 0.096 |
| 2018 | 0.099 |
| 2019 | 0.100 |
| 2020 | 0.091 |
| 2021 | 0.095 |
| Source: Statistics Canada, Multifactor Productivity Program. | |

Data table for Chart 3
| Investment per unit of labour | SNA | NALMF |
|---|---|---|
| index (2006=100) | ||
| 1990 | 61.109 | Note ...: not applicable |
| 1991 | 62.440 | Note ...: not applicable |
| 1992 | 57.989 | Note ...: not applicable |
| 1993 | 56.968 | Note ...: not applicable |
| 1994 | 60.548 | Note ...: not applicable |
| 1995 | 61.529 | Note ...: not applicable |
| 1996 | 63.541 | Note ...: not applicable |
| 1997 | 73.594 | Note ...: not applicable |
| 1998 | 76.577 | Note ...: not applicable |
| 1999 | 77.027 | Note ...: not applicable |
| 2000 | 79.372 | Note ...: not applicable |
| 2001 | 79.346 | Note ...: not applicable |
| 2002 | 74.316 | Note ...: not applicable |
| 2003 | 77.800 | Note ...: not applicable |
| 2004 | 83.848 | Note ...: not applicable |
| 2005 | 92.907 | 95.118 |
| 2006 | 100.000 | 100.000 |
| 2007 | 99.062 | 93.394 |
| 2008 | 101.274 | 93.370 |
| 2009 | 81.856 | 86.583 |
| 2010 | 90.632 | 83.608 |
| 2011 | 99.210 | 89.767 |
| 2012 | 104.460 | 96.221 |
| 2013 | 107.206 | 98.612 |
| 2014 | 111.603 | 98.770 |
| 2015 | 97.330 | 103.226 |
| 2016 | 85.530 | 89.777 |
| 2017 | 85.913 | 84.086 |
| 2018 | 88.563 | 85.971 |
| 2019 | 89.754 | 91.846 |
| 2020 | 91.378 | 85.716 |
| 2021 | 86.069 | 81.846 |
|
... not applicable Notes: SNA = Canadian System of National Accounts; NALMF = National Accounts Longitudinal Microdata File. Source: Authors’ tabulation from the NALMF micro data base and the Canadian System of National Accounts. |
||
While the weakness in investment started around the time of the 2007/2008 financial crisis for Canada, this weakness in capital investment predated the financial crisis for the United States and many other advanced countries. For the United States, weak capital investment started in the early 2000s (Fernald et al., 2017; Bailey and Montalbano, 2016). That is, the investment slowdown in the United States occurred before the investment slowdown in Canada.
There is a disconnect between investment and profitability in Canada, as shown in Chart 4. The chart plots the after-tax internal rate of return to capital in the business sector from Statistics Canada’s Multifactor Productivity Program. The internal rate of return to capital in the chart is based on gross operating surplus and net capital stock in the national accounts and corresponds to the ratio of capital income to capital stock.Note The internal rate of return reflects a nominal rate of return to capital.

Data table for Chart 4
| Percent | |
|---|---|
| 1990 | 0.034 |
| 1991 | 0.020 |
| 1992 | 0.018 |
| 1993 | 0.027 |
| 1994 | 0.037 |
| 1995 | 0.041 |
| 1996 | 0.042 |
| 1997 | 0.041 |
| 1998 | 0.041 |
| 1999 | 0.044 |
| 2000 | 0.051 |
| 2001 | 0.057 |
| 2002 | 0.064 |
| 2003 | 0.074 |
| 2004 | 0.090 |
| 2005 | 0.102 |
| 2006 | 0.110 |
| 2007 | 0.109 |
| 2008 | 0.098 |
| 2009 | 0.086 |
| 2010 | 0.083 |
| 2011 | 0.090 |
| 2012 | 0.095 |
| 2013 | 0.094 |
| 2014 | 0.090 |
| 2015 | 0.086 |
| 2016 | 0.081 |
| 2017 | 0.079 |
| 2018 | 0.078 |
| 2019 | 0.079 |
| Source: Statistics Canada, Multifactor Productivity Program. | |
The rate of return is high after the mid-2000s relative to the historical trends. The average rate of return was 9% for the period from 2006 to 2019, which is much higher than the average rate of return of 5% for the period from 1990 to 2006. But, despite the high rate of return to capital after 2006, the ratio of gross investment to net capital stock declined after 2006, and the investment per worker was lower after 2006. These findings suggest that the search for potential explanations for the investment slowdown should include explanations other than weak demand. Weak demand following the financial crisis cannot be the only explanation for the investment slowdown.Note
3.2 Trends in capital investment by firm type
This section presents capital investment by firm type to examine whether there is a difference in investment trends between different types of firms. The estimates are obtained from the NALMF database.
The NALMF database is used by Gu (2019) to examine Canadian productivity at the firm level after 2000. This study split the data into the top 10% most productive firms by industry and compared their level of productivity with that of the other 90% of firms. The productivity growth slowdown was found to be relatively larger among the top firms. Specifically, the productivity slowdown after 2000 was attributable to (1) slower rates of innovation at Canada’s top firms, (2) a decline in the rate of innovation diffusion from Canada’s top firms to other firms and (3) a decline in resource reallocation among firms (i.e., slower creative destruction and business dynamism).
But much of the slowdown in productivity growth was caused by the slower rates of innovation at the top firms.
The findings in the Gu (2019) study suggest that capital investment may have been weaker and the decline in investment per worker more significant among large firms, as they accounted for a disproportionally larger share of the productivity slowdown. As will become clear below, the decline in investment per worker is indeed more significant for larger firms.
Firms are disaggregated by size based on employment. A firm is classified as being small if it has 1 to 99 employees, medium if it has 100 to 499 employees and large if it has 500 or more employees. Firms are also disaggregated into foreign- and domestic-controlled firms based on the country of control. The estimates are from the firm-level NALMF database, which is available for the period after 2000.
There is a break in investment on the file in 2005 as the share of firms that reported positive investment jumped from about 20% a year for the period from 2000 to 2004 to about 30% a year for the period from 2005 to 2021. The rest of the descriptive analysis will be restricted to the sample of firms from 2006 to 2021, when investment per worker was weak.
The sample of firms will be further restricted to those in the business sector, which excludes the government and public administration. The sample will also exclude firms that have no employment. The final data for the analysis consist of all incorporated firms with at least one employee in the business sector for the 2006-to-2021 period.Note
The firm-level database differs from the industry-level database in several ways. First, the coverage of firms differs between the two data sources. The data from Statistics Canada’s Multifactor Productivity Program include both incorporated and unincorporated firms, while the firm database includes only incorporated firms. Second, the coverage of asset types also differs. In the national accounts, investment includes all tangible assets and intangible assets that are capitalized in the national accounts, such as software, R&D expenditures and mineral exploration. By contrast, in the firm database, investment includes all tangible assets and intangibles that are often acquired through mergers and acquisitions, such as patents, licences and goodwill. The intangibles capitalized in the national accounts are mostly treated as operating expenses in the business accounts and the firm-level database.
Despite these differences between the two databases, the series on investment per worker from the two databases show a similar trend for the period after 2006 for which estimates from both databases are available. In Chart 3 presented above, investment per worker derived from the firm data file is added to the series on investment per worker from the industry database. Overall, the two series on investment per worker show a similar trend for the 2006-to-2021 period. The estimates from the industry database show that business investment in Canada experienced high growth from 1990 to 2006. After 2006, the estimates from the industry and firm-level databases show that investment per unit of labour declined over time, with a large decrease after 2014 and the collapse of oil and gas prices. The decline in investment per worker is slightly higher from the NALMF, at about 20% from 2006 to 2021, while the decrease is 15% from the national accounts data in the business sector. These trends are well documented in previous studies, such as those by Robson (2019) and Champagne et al. (2016).
Charts 5 and 6 present investment per worker by firm type from 2006 to 2021, where firms are disaggregated by firm size based on employment and country of ownership. The series are indexed to 100 in 2006 to focus on the difference in the trend in investment between firm types.

Data table for Chart 5
| Small | Medium | Large | All | |
|---|---|---|---|---|
| index (2006=100) | ||||
| 2006 | 100.000 | 100.000 | 100.000 | 100.000 |
| 2007 | 97.754 | 94.438 | 89.675 | 93.394 |
| 2008 | 98.663 | 95.773 | 88.717 | 93.370 |
| 2009 | 85.903 | 92.423 | 85.557 | 86.583 |
| 2010 | 87.935 | 90.481 | 80.051 | 83.608 |
| 2011 | 98.806 | 99.461 | 83.995 | 89.767 |
| 2012 | 97.858 | 93.498 | 99.075 | 96.221 |
| 2013 | 96.304 | 100.560 | 95.944 | 98.612 |
| 2014 | 98.672 | 107.622 | 100.285 | 98.770 |
| 2015 | 97.533 | 103.331 | 111.217 | 103.226 |
| 2016 | 92.409 | 102.724 | 88.337 | 89.777 |
| 2017 | 94.111 | 82.748 | 81.000 | 84.086 |
| 2018 | 92.696 | 82.416 | 85.161 | 85.971 |
| 2019 | 96.196 | 90.251 | 91.984 | 91.846 |
| 2020 | 93.652 | 75.540 | 85.960 | 85.716 |
| 2021 | 93.948 | 70.832 | 78.804 | 81.846 |
| Source: Author’s tabulation from the National Accounts Longitudinal Microdata File database. | ||||

Data table for Chart 6
| Domestic | Foreign | All | |
|---|---|---|---|
| index (2006=100) | |||
| 2006 | 100.000 | 100.000 | 100.000 |
| 2007 | 81.682 | 116.753 | 93.394 |
| 2008 | 85.963 | 106.695 | 93.370 |
| 2009 | 83.054 | 89.895 | 86.583 |
| 2010 | 78.765 | 92.094 | 83.608 |
| 2011 | 86.582 | 92.481 | 89.767 |
| 2012 | 93.220 | 96.549 | 96.221 |
| 2013 | 92.539 | 107.158 | 98.612 |
| 2014 | 90.326 | 114.120 | 98.770 |
| 2015 | 93.977 | 120.586 | 103.226 |
| 2016 | 86.738 | 91.305 | 89.777 |
| 2017 | 86.978 | 68.865 | 84.086 |
| 2018 | 88.979 | 70.424 | 85.971 |
| 2019 | 98.951 | 64.797 | 91.846 |
| 2020 | 91.675 | 62.100 | 85.716 |
| 2021 | 86.955 | 60.853 | 81.846 |
| Source: Author’s tabulation from the National Accounts Longitudinal Microdata File database. | |||
These two charts show that the decline in capital investment per worker was greater among large and medium-sized firms than in small firms from 2006 to 2021. The decline was also greater among foreign-controlled firms than domestic-controlled firms for that period.
The collapse of commodity prices that started in 2014 affected the mining and oil and gas sector, which has a relatively substantial share of large and foreign-controlled firms. The decline in investment per worker in large and foreign-controlled firms could be entirely caused by the large decline in mining and oil and gas sector investment. When firms in the mining and oil and gas sector are excluded, the difference in the trends in investment between different types of firms remains. The decline in investment per worker after 2006 was greater among large and medium-sized firms and among foreign-controlled firms, compared with small firms and domestic-controlled firms.
Table 2 presents a decomposition of changes in aggregate investment per worker into the contribution from various firm types. Investment per worker declined by $628.80 from 2006 to 2021 in the business sector, which represents a 20% decrease from investment per worker in 2006 ($3,573.00 per worker). The decline in investment among large firms contributed $454.10 per worker, or 70% of that decrease. Medium-sized firms contributed $125.40 per worker, or 22% of the overall decline, and small firms contributed $49.20 per worker, or 8% of the overall decrease. The contribution of medium-sized and large firms to the decline in investment is higher than their share of employment and investment, as large firms accounted for 51% of investment in 2021 and medium-sized firms accounted for 13% of investment. Together, medium-sized and large firms accounted for most of the decline in investment per worker from 2006 to 2021.
The decrease in investment among foreign-controlled firms contributed $199.00 per worker, or 30% of the overall decline. Domestic-controlled firms contributed $449.80 per worker, or 70% of the overall decline. The contribution of foreign-controlled firms to the decline in investment is disproportionately large, as foreign-controlled firms accounted for 21% of investment in 2021.
Table 2 also shows that investment intensity (investment per worker) is higher in large and medium-sized firms and in foreign-controlled firms compared with small firms and domestic-controlled firms, because the share of investment accounted for by large and medium-sized firms and foreign-controlled firms is higher than their shares of employment.
| Average percent share in 2021 | Contribution (dollars per worker) | Total | |||
|---|---|---|---|---|---|
| Employment | Investment | Within | Between | ||
| percent | dollars per worker | ||||
| Firm size | |||||
| Small | 47.4 | 36.6 | -68.4 | 19.1 | -49.2 |
| Medium | 16.8 | 12.7 | -151.5 | 6.0 | -145.5 |
| Large | 35.9 | 50.7 | -405.0 | -49.1 | -454.1 |
| Sum | 100.0 | 100.0 | -624.8 | -23.9 | -648.8 |
| Country of control | |||||
| Domestic | 83.4 | 79.0 | -353.4 | -96.4 | -449.8 |
| Foreign | 16.6 | 21.0 | -356.8 | 157.8 | -199.0 |
| Sum | 100.0 | 100.0 | -710.2 | 61.4 | -648.8 |
|
Notes: The within component measures the contribution of the changes in investment for firm types with the shares of firm type held constant. The between component is the contribution of changes in the share of firm types with investment held constant. Source: Author’s estimations from the National Accounts Longitudinal Microdata File database. |
|||||
4 Intangibles and the composition of capital
This section presents the trends in the composition of capital investment and examines whether the investment slowdown is related to the shift toward intangible investment.
Charts 7 and 8 show the shift in the composition of investment in fixed assets toward intangibles in Canadian firms. The share of intangible assets in total fixed assets in the balance sheets of firms increased from 6.3% to 17.3% from 2000 to 2021. The increase appears to have accelerated after 2006. The share of intangibles increased from 6.3% to 8.4%, or by about 0.35 percentage points per year, from 2000 to 2006. From 2006 to 2021, the share of intangibles increased from 8.4% to 17.3%, or by 0.59 percentage points per year.Note

Data table for Chart 7
| Small | Medium | Large | All | |
|---|---|---|---|---|
| percent | ||||
| 2000 | 5.8 | 8.7 | 6.0 | 6.3 |
| 2001 | 6.8 | 8.8 | 6.4 | 6.8 |
| 2002 | 5.9 | 9.4 | 7.7 | 7.4 |
| 2003 | 6.0 | 9.7 | 7.5 | 7.3 |
| 2004 | 6.6 | 10.9 | 7.7 | 7.8 |
| 2005 | 6.6 | 11.6 | 7.7 | 7.9 |
| 2006 | 7.1 | 11.6 | 8.4 | 8.4 |
| 2007 | 7.9 | 14.2 | 10.6 | 10.2 |
| 2008 | 8.0 | 12.1 | 11.5 | 10.5 |
| 2009 | 7.5 | 12.8 | 13.1 | 11.3 |
| 2010 | 7.6 | 14.6 | 13.9 | 12.0 |
| 2011 | 8.6 | 14.6 | 15.9 | 13.3 |
| 2012 | 8.9 | 16.9 | 15.5 | 13.5 |
| 2013 | 8.9 | 16.4 | 14.4 | 12.9 |
| 2014 | 8.9 | 18.2 | 14.9 | 13.5 |
| 2015 | 12.2 | 17.3 | 14.4 | 14.1 |
| 2016 | 10.8 | 17.7 | 15.7 | 14.4 |
| 2017 | 11.0 | 19.5 | 15.4 | 14.7 |
| 2018 | 11.8 | 19.5 | 17.2 | 16.0 |
| 2019 | 12.4 | 21.1 | 17.1 | 16.3 |
| 2020 | 12.4 | 22.6 | 16.2 | 16.0 |
| 2021 | 14.2 | 25.1 | 16.8 | 17.3 |
| Source: Author’s tabulation from the National Accounts Longitudinal Microdata File database. | ||||

Data table for Chart 8
| Domestic | Foreign | All | |
|---|---|---|---|
| percent | |||
| 2000 | 6.1 | 7.7 | 6.3 |
| 2001 | 6.4 | 9.2 | 6.8 |
| 2002 | 6.8 | 9.9 | 7.4 |
| 2003 | 6.4 | 11.6 | 7.3 |
| 2004 | 6.8 | 12.1 | 7.8 |
| 2005 | 7.2 | 10.7 | 7.9 |
| 2006 | 7.8 | 10.7 | 8.4 |
| 2007 | 7.9 | 16.7 | 10.2 |
| 2008 | 8.6 | 16.3 | 10.5 |
| 2009 | 8.9 | 18.5 | 11.3 |
| 2010 | 9.6 | 19.6 | 12.0 |
| 2011 | 10.7 | 20.4 | 13.3 |
| 2012 | 10.4 | 22.0 | 13.5 |
| 2013 | 10.8 | 18.2 | 12.9 |
| 2014 | 10.7 | 21.0 | 13.5 |
| 2015 | 10.3 | 24.1 | 14.1 |
| 2016 | 11.3 | 22.5 | 14.4 |
| 2017 | 11.8 | 22.5 | 14.7 |
| 2018 | 12.8 | 25.0 | 16.0 |
| 2019 | 12.9 | 26.6 | 16.3 |
| 2020 | 12.5 | 27.1 | 16.0 |
| 2021 | 14.4 | 26.4 | 17.3 |
| Source: Author’s tabulation from the National Accounts Longitudinal Microdata File database. | |||
Large and medium-sized firms increased their share of intangibles in total assets more than small firms. That is, the relatively large decline in investment per worker in large and medium-sized firms coincided with this greater shift toward intangibles in these firms compared with small firms. Foreign-controlled firms increased their share of intangibles more than domestic-controlled firms; at the same time, the decline in investment was relatively larger in foreign-controlled firms than the decline in domestic-controlled firms. If a more comprehensive measure of intangible capital is developed at the firm level, the difference in investment trends between small firms and large and medium-sized firms, and between foreign-controlled firms and domestic-controlled firms, will be smaller. That is, the relatively weaker investment in tangible assets in larger firms and foreign-controlled firms compared with small firms and domestic-controlled firms after 2006 can be at least partly attributed to strong investment in intangibles in larger firms and foreign-controlled firms.
5 Regression analysis on the driver of investment: The role of concentration and business dynamics
This section examines the effect of industry concentration and business entry and exit rates on investment. It first documents trends in concentration and business dynamics in Canada, then examines whether weak capital investment after 2006 is related to these trends in concentration and business dynamism during this period.
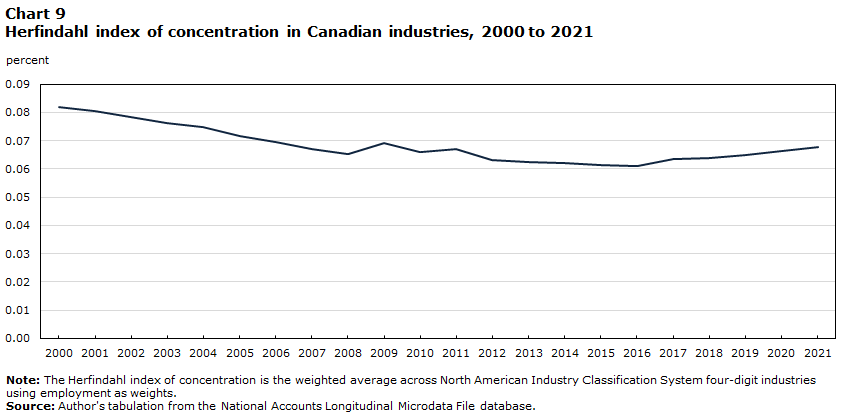
Chart 9 plots the average Herfindahl index of concentration in Canadian industries at the North American Industry Classification System (NAICS) four-digit level of industry aggregation, weighted by industry employment. It shows that concentration declined before 2014 and then increased after this year. But the overall change is small during that period. The small change in industry concentration in Canada differs from the large increase in industry concentration found in the United States (Gutiérrez and Philippon, 2017b).Note
Data table for Chart 9
| Percent | |
|---|---|
| 2000 | 0.082 |
| 2001 | 0.080 |
| 2002 | 0.078 |
| 2003 | 0.076 |
| 2004 | 0.075 |
| 2005 | 0.072 |
| 2006 | 0.070 |
| 2007 | 0.067 |
| 2008 | 0.065 |
| 2009 | 0.069 |
| 2010 | 0.066 |
| 2011 | 0.067 |
| 2012 | 0.063 |
| 2013 | 0.062 |
| 2014 | 0.062 |
| 2015 | 0.061 |
| 2016 | 0.061 |
| 2017 | 0.064 |
| 2018 | 0.064 |
| 2019 | 0.065 |
| 2020 | 0.066 |
| 2021 | 0.068 |
|
Note: The Herfindahl index of concentration is the weighted average across North American Industry Classification System four-digit industries using employment as weights. Source: Author's tabulation from the National Accounts Longitudinal Microdata File database. |
|
Chart 10 shows the average business entry and exit rates in Canadian industries from 2000 to 2021, weighted by industry employment. The entry rates are calculated as the share of new firms in a year to the total number of firms in the year. The exit rates are calculated as the share of exiting firms in a year in the total number of firms in the year. Entry rates declined in the period before the pandemic, while exit rates changed very little during this period. The decline in entry rates is large. The average entry rate declined from 12% in 2006 to 9% in 2019.Note A large increase in exit rates and a large decline in entry rates were recorded in 2020 and 2021, because of the COVID-19 pandemic and business responses to the restrictions imposed during this period. The trend in entry and exit rates in Canada is similar to the trend reported in the United States by Decker et al. (2016). This 2016 study found that firm entry rates declined from 13% in 1981 to 8% in 2013 in the United States, while firm exit rates changed little during the same period.

Data table for Chart 10
| Average entry rate | Average exit rate | |
|---|---|---|
| percent | ||
| 2000 | 14.60 | 10.26 |
| 2001 | 14.70 | 10.29 |
| 2002 | 11.86 | 9.59 |
| 2003 | 10.90 | 9.37 |
| 2004 | 12.96 | 9.36 |
| 2005 | 12.34 | 8.62 |
| 2006 | 11.85 | 9.42 |
| 2007 | 12.94 | 8.75 |
| 2008 | 10.79 | 9.27 |
| 2009 | 9.98 | 9.57 |
| 2010 | 9.60 | 8.63 |
| 2011 | 9.69 | 8.58 |
| 2012 | 10.21 | 7.88 |
| 2013 | 9.54 | 8.13 |
| 2014 | 9.42 | 8.80 |
| 2015 | 9.06 | 8.91 |
| 2016 | 8.75 | 9.14 |
| 2017 | 9.24 | 10.15 |
| 2018 | 9.37 | 9.04 |
| 2019 | 9.57 | 9.35 |
| 2020 | 7.75 | 10.68 |
| 2021 | 7.34 | 12.17 |
|
Note: The entry and exit rates are the weighted averages across North American Industry Classification System four-digit industries using employment as weights. Source: Author's tabulation from the National Accounts Longitudinal Microdata File database. |
||
The estimates of exit rates in this paper extend the previous estimates of Macdonald (2014), who presents a long-term trend in entry and exit rates from 1984 to 2013. Macdonald (2014) shows that entry rates declined over time in Canadian industries after 1984. Exit rates declined from 1984 to 2005 and then changed little from 2005 to 2013. These trends documented by Macdonald (2014) for the period before 2013 also continued after 2013.
5.1 Empirical framework
To examine whether the changes in concentration and business dynamics are related to the decline in investment per worker after 2006, a regression analysis is conducted to estimate an investment equation at the firm level that is a function of industry concentration, industry business dynamics and other variables that are expected to affect firms’ investment decisions. The regression analysis determines whether firms reduced investment when there was an increase in concentration and a decrease in firm entry rates in the industries in which they operate, consistent with the theory that industry concentration and firm entry rates are measures of competition, and competition increases investment.
The dependent variable in the regression model is investment intensity. It can be defined as the ratio of investment to revenues, business investment per worker or the ratio of investment to net capital. The business investment per worker is used in this paper because it is more closely related to the growth of the capital-to-labour ratio, which is a major source of labour productivity growth. The investment-to-capital-stock ratio is not readily available in the firm-level database, which is based on accounting data. In the accounting data, only the book value of capital assets is available, not the replacement value of capital for estimating the investment-to-capital ratio.Note
The investment equation being estimated is
where subscript indexes firm; indexes industry; indexes year; the variable is investment per worker; the variable is the Herfindahl index of concentration in percentage points; is the entry rate in percentage points; is the exit rate in percentage points; and represents firm-specific variables that are expected to affect investment, which include the debt-to-asset ratio, the retained-earnings-to-asset ratio, the profit-to-asset ratio, effective tax rates and firm size.
The regression equation for investment can be derived from the accelerator model of investment with error correction. Alternatively, the equation can be derived from an Euler equation for optimal investment with adjustment costs. The accelerator model of investment was first introduced in investment studies by Bean (1981) and was further elaborated by Bond et al. (2003) and Mairesse, Hall and Mulkay (1999). The basic idea is to nest a long-run specification for a firm’s demand for capital within a regression model that allows flexible specification for short-run investment dynamics. The Euler equation for investment rates is derived from the first-order condition for the optimal investment decision for maximizing the present discounted values of expected future profits with adjustment costs (Abel, 1980; Hayashi, 1982).
The regression controls for firm-specific effects and year-specific effects . is the error term for the regression equation. The main variables of interest are industry concentration and industry entry and exit rates that capture competition and business dynamism and affect investment among firms. The industry concentration is included to examine the effect of competition on investment. Entry rates are included to examine the effects of the factors that drive the change in entry rates on investment, such as competition, technological changes and demographic changes. Exit rates are included to examine the effects of the factors that drive the change in exit rates on investment, such as competition, the growth and decline of industries, and macroeconomic conditions.
The other variables for investment equations are (1) leverage, defined as the debt-to-asset ratio; (2) the retained-earnings-to-asset ratio; (3) profit-to-asset ratios; (4) effective tax rates; and (5) firm size.
The variable debt-to-asset ratio is included to examine the effect of leverage on investment. It is expected that leverage is negatively related to investment for several reasons. High levels of debt may motivate firms to defer or forgo investment projects, possibly because of difficulties in accessing financing and financial constraints (Cao and Leung, 2020). High levels of debt are associated with an increased probability of financial distress and the demand for high returns by potential suppliers of funds, thus displaying a negative relationship with investment (Hernando and Martínez-Carrascal, 2008; Farinha and Prego, 2013; Gebauer, Setzer and Westphal2017).
The variables retained-earnings-to-asset ratio and profit-to-asset ratios are included to examine the cash flow investment hypothesis—a positive relationship between cash flow and investment. Lewellen and Lewellen (2016) listed three potential explanations for the positive effect of cash flow on investment. First, internal funds are less costly than external funds. Second, managers may overspend available internal funds. Third, cash flow may be correlated with investment opportunities and high profits, and retained earnings signal a high rate of returns to investment. The macro trends on high profit rates and the declining investment intensity after 2006 in the business sector suggest that investment was not affected by profits during this period. In addition, the positive cash flow–investment relationship can be a consequence of financial constraints (Fazzari et al., 1987) or the result of managerial risk aversion to excess debt. The existing empirical evidence on this relationship between cash flow and investment is mixed.
5.2 Data for estimation
The sample of firms covers the period from 2006 to 2019. Since investment decisions in 2020 and 2021 could have been affected by the COVID-19 pandemic and various health measures, these years are excluded from the sample for regression. The sample is further restricted to the firms with positive investment in at least one year during the sample period. The firms with no investment over this 13-year period are excluded; they account for 40% of firm-year observations, 20% of total revenue and 11% of total employment.
Several procedures are used to clean the data of outliers.
First, the database is cleaned for outliers using a method based on the outlier principle developed by John Tukey (Tukey, 1977; Cette et al., 2017), which removes values located beyond quartile 1 that are less than 10 times (and values beyond quartile 3 that are more than 10 times) the interquartile range of investment per worker at the NAICS two-digit level of industry classification in a year. This procedure removed 70% of the investments in the sample, while the remaining sample accounted for 30% of total investment in the original data. This procedure removed too much of the investment from the sample and was not used to remove outliers in this paper.
Second, the top 1% of the sample with the highest investment per worker in a NAICS two-digit industry and in a year are considered outliers and removed from the sample. The firms considered outliers accounted for less than 1% of employment and about 25% of total investment.
Third, the top 5% of the sample with the highest investment per worker in a NAICS two-digit industry and in a year are considered outliers and removed from the sample. The firms considered outliers accounted for less than 7% of employment and about 60% of total investment. This procedure removed too large a share of investment. For the main regression analysis, only firms in the top 1% of investment per worker were removed.
The fact that the top 1% and 5% of firms account for a large share of total investment (25% and 60%, respectively) is a result of the skewness of the investment data and not necessarily caused by measurement error. The regression results in this paper should be seen as capturing the determinants of investment for most firms. For the few firms that make large investments, the factors affecting their investments may be different. Future analysis should focus on the drivers of these superstar firms.
5.3 Regression results
Table 3 presents the empirical results from estimating the investment equation using the sample from 2006 to 2019. The results are presented for three specifications.
| Column 1 (Model 1) | Column 2 (Model 2) | Column 3 (Model 3) | |
|---|---|---|---|
| Concentration | |||
| Coefficient | -3.6075Note ** | -3.6206Note ** | -3.7048Note ** |
| T-statistics | 2.9350 | 2.9420 | 2.9910 |
| Entry rates | |||
| Coefficient | 38.1660Note *** | 38.1618Note *** | 41.0034Note *** |
| T-statistics | 3.7330 | 3.7250 | 4.0370 |
| Exit rates | |||
| Coefficient | -34.3710Note *** | -34.3739Note *** | -30.7146Note *** |
| T-statistics | 5.1360 | 5.1150 | 4.5950 |
| Debt to assets | |||
| Coefficient | Note ...: not applicable | 0.0003 | 0.0003 |
| T-statistics | Note ...: not applicable | 0.6030 | 0.4940 |
| Profit to assets | |||
| Coefficient | Note ...: not applicable | 0.0003 | 0.0003 |
| T-statistics | Note ...: not applicable | 0.6450 | 0.6400 |
| Retained earnings to assets | |||
| Coefficient | Note ...: not applicable | 0.0006 | 0.0005 |
| T-statistics | Note ...: not applicable | 1.1380 | 1.0580 |
| Effective tax rates | |||
| Coefficient | Note ...: not applicable | Note ...: not applicable | -0.0117Note *** |
| T-statistics | Note ...: not applicable | Note ...: not applicable | 5.6310 |
| Constant | |||
| Coefficient | 7,649.5619Note *** | 7,661.7149Note *** | 7,515.1689Note *** |
| T-statistics | 40.6730 | 40.6620 | 40.1380 |
| number | |||
| R squared | 0.3864 | 0.3861 | 0.3869 |
| Number of observations | 8,122,106 | 8,108,311 | 8,079,022 |
|
... not applicable * significantly different from reference category (p < 0.05)
Source: Author’s estimations from the National Accounts Longitudinal Microdata File database. |
|||
Concentration is negatively related to investment in Canada. The coefficient estimate on the industry concentration variable is statistically significant in all specifications. This finding suggests that increasing concentration and declining competition are related to declining investment. The positive escape-competition effect dominates the negative Schumpeter effect of competition, and competition encourages investment.
A 1 percentage point increase in the Herfindahl index of concentration is associated with a $3.70 decline in investment per worker (column 3). While concentration is negatively related to investment, the changes in concentration in industries do not contribute to weaker investment for the period after 2006, as the Herfindahl index of concentration changed little in Canadian industries in that period.
The entry rate is positively related to investment, and the relationship is statistically significant at the 5% level in all specifications. This finding is consistent with the view that high entry rates indicate high competition and competition encourages investment. The estimates suggest that a 1 percentage point decline in the entry rate is associated with a decline of $41.00 in investment per worker in 2012 prices (column 3). From 2006 to 2019, the weighted average entry rate in Canadian industries declined by 2.3 percentage points, from 11.9% in 2006 to 9.6% in 2019. This decrease in entry rates led to a decline of $93.00 per worker in investment intensity during this period.Note For the sample of firms, there was a decline of $291.00 per worker over this period. The decline in entry rates accounted for about 30% of the decline in investment per worker during this period.
The exit rate is negatively related to investment. The coefficient estimate on the exit rate is negative and statistically significant at the 1% significance level. The negative effect of exit rates on investment is consistent with the view that high exit rates indicate declining investment opportunities from weak demand following the financial crisis, and firms in industries with high exit rates have less incentive to invest. While the estimated effect of exits is large, the trend in exits rates does not explain weak investment after 2006, as there is little change in exit rates from 2006 to 2019.
The debt-to-asset ratio is not related to investment. The coefficient estimate on the debt-to-asset ratio is not statistically significant. On average, leverage has no effect on investment in Canadian firms from 2006 to 2019.
Retained earnings and profitability are not related to investment in Canada. As retained earnings and profitability are correlated, the two variables are also introduced separately in the regression. When that is done, the coefficient estimates on the two variables are found not to be statistically significant. The lack of relationship between profits and investment is consistent with the evidence from the industry-level database—investment is weak after 2006 despite the relatively high rate of return during this period.
The effective tax rate is negatively related to investment. The decline in business tax rates over this period should have increased business investment.
It may take time for firms to adjust to the changes in industry concentration and firm entry and exit rates. To address this lagged response by firms, industry concentration and firm entry and exit rates in the regression are replaced with one- or two-year lags. The coefficient estimates on those lagged variables are virtually unchanged and remain statistically significant.
Competition may have different effects on investment for different types of firms, as the two effects of competition (the escape-competition effect and the Schumpeter effect) may vary from one type of firm to another. In Table 4, firms in a NAICS four-digit industry are divided into two groups: large firms (the firms in the top quartile or the top 10 percentile in sales) and small firms (all other firms). In Table 5, the investment equation is estimated separately for large and medium-sized firms (with at least 100 employees) and small firms with fewer than 100 employees.
| Large - top quartile | Small - other | Large - top 10 percentile | Small - other | |
|---|---|---|---|---|
| Concentration | ||||
| Coefficient | 2.7409 | -4.4745Note ** | 5.4585 | -3.9617Note ** |
| T-statistics | 1.2070 | 2.8830 | 1.1450 | 3.0400 |
| Entry rates | ||||
| Coefficient | 35.9437Note *** | 44.8961Note ** | 39.8234Note *** | 40.6781Note *** |
| T-statistics | 4.3960 | 3.2380 | 4.1700 | 3.5430 |
| Exit rates | ||||
| Coefficient | 0.0090 | -40.8789Note *** | 2.2569 | -35.9869Note *** |
| T-statistics | 0.0010 | (-4.553) | -0.2810 | (-4.801) |
| Debt to assets | ||||
| Coefficient | 0.0002 | 0.0005 | 1.9326Note ** | 0.0017 |
| T-statistics | 1.2690 | 0.1630 | 3.0180 | 0.8520 |
| Profit to assets | ||||
| Coefficient | 0.0004 | 0.0006 | 0.0002 | 0.0010 |
| T-statistics | 0.3900 | 0.8700 | 0.9960 | 1.9530 |
| Retained earnings to assets | ||||
| Coefficient | 0.0002 | 0.0023 | 0.0034Note * | 0.0011 |
| T-statistics | 1.9410 | 1.3950 | 2.2370 | 1.4100 |
| Effective tax rates | ||||
| Coefficient | -0.0122Note *** | -0.0306 | 0.0013 | -0.0117Note *** |
| T-statistics | 5.7990 | 0.4820 | 0.8690 | 6.9030 |
| Constant | ||||
| Coefficient | 6,693.3458Note *** | 7,512.4130Note *** | 5,980.3961Note *** | 7,387.5551Note *** |
| T-statistics | 18.4120 | 30.5360 | 10.0520 | 35.7620 |
| number | ||||
| R-squared | 0.4523 | 0.4168 | 0.4882 | 0.3963 |
| Number of observations | 2,038,647 | 6,040,375 | 819,311 | 7,259,711 |
Source: Author’s estimations from the National Accounts Longitudinal Microdata File database. |
||||
| Column 1 - medium and large | Column 2 - small | |
|---|---|---|
| Concentration | ||
| Coefficient | 17.8799Note ** | -3.8821Note ** |
| T-statistics | 2.6370 | 3.0640 |
| Entry rates | ||
| Coefficient | 36.4932Note * | 39.3143Note *** |
| T-statistics | 2.1670 | 3.7440 |
| Exit rates | ||
| Coefficient | 50.2046Note *** | -34.3760Note *** |
| T-statistics | 5.9130 | 4.9230 |
| Debt to assets | ||
| Coefficient | 10.0067 | -0.0032 |
| T-statistics | 1.5360 | 1.7470 |
| Profit to assets | ||
| Coefficient | 0.0006 | 0.0001 |
| T-statistics | 0.4830 | 0.2540 |
| Retained earnings to assets | ||
| Coefficient | 10.2602 | 0.0005 |
| T-statistics | 1.6000 | 1.0470 |
| Effective tax rates | ||
| Coefficient | -0.0677Note *** | -0.0115Note *** |
| T-statistics | 7.6330 | 4.6240 |
| Constant | ||
| Coefficient | 2,770.4910Note *** | 7,505.3912Note *** |
| T-statistics | 10.9250 | 38.8040 |
| number | ||
| R-squared | 0.6353 | 0.3871 |
| Number of observations | 174,245 | 7,904,777 |
Source: Author’s estimations from the National Accounts Longitudinal Microdata File database. |
||
For small firms, industry concentration is negatively related to investment. For large firms, industry concentration is positively related to investment or has insignificant effects on investment. This result is consistent with a theory of investment and competition that finds that for small firms, the escape-competition effect (by which competition promotes investment as firms invest to overtake other firms) dominates the Schumpeter effect (by which less competitive industries promote investment by allowing firms to appropriate more value from their investment). For large firms, the Schumpeter effect dominates or offsets the escape-competition effect. Therefore, the overall effect of industry concentration on investment is either positive or insignificant for large firms.
The entry rate is positively related to investment for both large and small firms. The coefficient estimates on the entry rate variable are similar for large and small firms. While the absolute change in investment per worker from changes in entry rates as captured by the coefficient is similar for the two types of firms, the percentage change as measured by the absolute change divided by the average level of investment per worker is smaller for large firms as they have higher investment intensity. Once again, this suggests that competition has a relatively larger effect on investment among small firms than among large firms.
The exit rate is negatively related to investment for small firms. For large firms, the effect of the exit rate on investment is positive or insignificant. To the extent that the increase in exit rates signals declining investment opportunities, this lack of investment opportunities mainly affects investment for small firms.
6 Conclusion
Investment in fixed capital has been weak in Canada since the mid-2000s. The ratio of investment to net capital stock and investment per worker declined after 2006, especially after the collapse of commodity prices that started in 2014. As a result of this investment slowdown, growth in labour productivity declined in Canada during this period. This paper examines the sources of this weakness in capital investment in Canada using a firm-level database.
Investment per worker declined by $628.80 from 2006 to 2021 in Canadian firms, representing a 20% decline from an investment of $3,573.00 per worker in 2006.
The decline in investment per worker after 2006 was more significant in large and medium-sized firms and foreign-controlled firms compared with small firms and domestic-controlled firms. Large and medium-sized firms accounted for 90% of the overall decline in investment per worker from 2006 to 2021. Foreign-controlled firms contributed to 30% of the decline in investment per worker, although they accounted for 20% of investment in 2021.
The weakness in capital investment after 2006 coincided with a change in the mix of investment toward intangible investment, and the shift toward intangibles was more pronounced among large and foreign-controlled firms.
An increase in industry concentration and a decline in firm entry rates had a negative effect on firm investment, and the effect was relatively larger among small firms. This result is interpreted as evidence that a decline in competition reduces investment, or competition promotes investment among firms, especially among small firms. For the period after 2006, industry concentration changed little, while firm entry rates declined sharply. These declining entry rates contributed to 30% of the decline in investment per worker after 2006.
Capital investment in Canada has become weaker since 2006 and is also much lower than investment in other advanced countries. This paper focused on the investment slowdown in Canada after 2006 and found that the investment slowdown is partly explained by declining competition and a shift toward intangibles that are not yet captured in the investment estimates. Future analysis should focus on the sources of Canada’s lower investment, compared with other countries, and examine whether the difference in competition and the pace of the shift toward intangible knowledge capital between Canada and other advanced countries contributed to this investment gap in Canada.
References
Abel, A.B. 1980, “Empirical Investment Equations: An Integrative Framework,” in K. Brunner and A. Meltzer (eds), On the State of Macroeconomics, Carnegie-Rochester Conference Series 12(1980), 39-93.
Arrow, K. (1962) “Economic Welfare and the Allocation of Resources for Invention.” In The Rate and Direction of Inventive Activity, 609–25. Princeton, New Jersey: Princeton University Press.
Bailey, M. and N. Montalbano. 2016. “Why is U.S. productivity growth so slow? Possible Explanations and Policy Responses”, Hutchins Center Working Paper No. 22.
Baldwin, J. R. and W. Gu, 2007, “Investment and Long-term Productivity Growth in the Canadian Business Sector”. The Canadian Productivity Review, Statistics Canada.
Baldwin, J. R., W. Gu, and B. Yan 2007, “User Guide for Statistics Canada's Annual Multifactor Productivity Program.” The Canadian Productivity Review, No. 14.
Bean, C. R., 1981. “An Econometric Model of Manufacturing Investment in the UK,” The Economic Journal. 91, 106-121.
Bond, S. et al. 2003. “Financial Factors and Investment in Belgium, France, Germany and the United Kingdom: A Comparison Using Company Panel Data.” The Review of Economics and Statistics, 85(1).
Bussière, M., L.t Ferrara, and J. Milovich. 2015. “Explaining the Recent Slump in Investment: The Role of Expected Demand and Uncertainty.” Working Paper No. 571. Banque de France.
Cao, S. et al. 2017. “Trends in Firm Entry and New Entrepreneurship in Canada.” Canadian Public Policy, Vol. 43, No. 3.
Cao, S. and D. Leung. 2020. “Credit Constraints and Productivity of SMEs: Evidence from Canada.” Economic Modelling, Volume 88, June 2020, pp. 163-180.
Cette, G., S. Corde and R. Lecat, 2017. “Stagnation of Productivity in France: A Legacy of the Crisis or a Structural Slowdown?” Working paper, Banque de France.
Champagne, J. et al. 2016. “The Complex Adjustment of the Canadian Economy to Lower Commodity Prices.” Bank of Canada Staff Analytical Note, 2016-1.
Corrado, C. J. et al. (2022), “Intangible Capital and Modern Economies,” Journal of Economic Perspectives. Summer 2022. Pp. 3-28.
Corrado, C.l, C. R. Hulten, and D. Sichel. 2005. “Measuring Capital and Technology: An Expanded Framework.” In Measuring Capital in the New Economy, Vol. 66, Studies in Income and Wealth, edited by Carol Corrado, John Haltiwanger, and Daniel Sichel, 11–46. Chicago: National Bureau of Economic Research, University of Chicago Press.
Corrado, C.l, C. R. Hulten, and D. Sichel. (2009), “Intangible Capital and U.S. Economic Growth.” The Review of Income and Wealth 55 (3): 661–85.
Crouzet, N. and J.C. Eberly, 2019, “Understanding Weak Capital Investment: The Role of Market Concentration and Intangibles,” National Bureau of Economic Research working paper 25869.
Decker, Ryan, John Haltiwanger, Ron S. Jarmin, and Javier Miranda, 2016, “Declining Business Dynamism: Implications for Productivity?” Hutchins Center Working Papers, #23, Brookings.
Farinha, L., P., Prego 2013. “Investment Decisions and Financial Standing of Portuguese Firms – Recent Evidence,” Financial Stability Report. Banco de Portugal, May, 105-125.
Fay, R., et al. 2017. “Why Is Global Business Investment So Weak? Some Insights from Advanced Economies,” Bank of Canada Review, Spring 2017.
Fazzari S., R.G. Hubbard and B.C. Petersen, 1987. “Financial Constraints and Corporate Investment,” National Bureau of Economic Research Working Paper 2387.
Fernald J. et al. 2017. “The Disappointing Recovery of Output after 2009.” Brookings Papers on Economic Activity, Spring 2017.
Gebauer, S., Setzer, R., and Westphal, A. 2017. “Corporate Debt and Investment: A Firm-level Analysis for Stressed Euro Area Countries,” European Central Bank working paper series, 2101, September.
Gutiérrez, G., and T. Philippon. 2017. “Declining Competition and Investment in the U.S.” National Bureau of Economic Research Working Paper 23583.
Gu, W. 2019, “Frontier Firms, Productivity Dispersion and Aggregate Productivity Growth in Canada,” International Productivity Monitor, vol. 37, 96-119.
Gu, W. and R. Macdonald, 2023, “Data, Intangible Capital, and Economic Growth in Canada,” paper presented at the IARIW–CIGI conference on “The Valuation of Data,” November 2 to 3, 2023, Waterloo, Ontario, Canada.
Gu, W. and M. Willox. 2018. “Productivity Growth in Canada and the United States, Recent Industry Trends and Potential Explanations.” International Productivity Monitor, Vol. 35.
Gutiérrez, G. and T. Philippon 2017a. “Investment-less Growth: An Empirical Investigation,” Brookings Papers on Economic Activities.
Gutiérrez, G. and T. Philippon 2017b. “Declining Competition and Investment in the U.S.,” National Bureau of Economic Research working paper 23583.
Haskel J. and S. Westlake, 2017. Capitalism without Capital, the Rise of Intangible Economy, Princeton, New Jersey, Princeton University Press.
Hathaway, I. and R. E. Litan. 2014. “Declining Business Dynamism in the United States: A Look at States and Metros.” Technical Report, The Brookings Institution.
Hayashi, F. 1982. “Tobin’s Marginal q and Average q: A Neoclassical Interpretation,” Econometrica, 50-1.
Hernando, I., Martínez-Carrascal, C. 2008. “The Impact of Financial Variables on Firms’ Real Decisions: Evidence from Spanish Firm-level Data,” Journal of Macroeconomics, 30(1), 543-561.
Lewellen, J., Lewellen, K. 2016. “Investment and Cash Flow: New Evidence,” Journal of Financial and Quantitative Analysis, 51(4), 1135-1164.
Macdonald, R. 2014. “Business Entry and Exit Rates in Canada: A 30-year Perspective,” Economic Insights, Statistics Canada.
Mairesse, J. B.H. Hall and B. Mulkay, 1999. “Firm-level Investment in France and the United States: An Explanation of What We Have Learned in Twenty Years,” Annals of Economics and Statistics, pp. 55-56.
Ollivaud, P., Y. Guillemette and D. Turner, 2016. “Links Between Weak Investment and the Slowdown in Productivity and Potential Output Growth across the OECD,” OECD Economic Department Working Papers No. 1304.
Robson W. 2019. “Thin Capitalization: Weak Business Investment Undermines Canadian Workers,” C. D. Howe Institute Commentary No. 550.
Schumpeter, J., 1943. Capitalism, Socialism and Democracy. London: Allen Unwin.
Statistics Canada 2022. “Research to Insights: Investment, Productivity and Living Standards,” Catalogue no. 11-631-X.
Tukey, JW. 1977, Exploratory Data Analysis. Addison-Wesely.
- Date modified: