
Analytical Studies Branch Research Paper Series
The Neighbourhood Ties of Long-term Residents in Lower-income Neighbourhoods
DOI: https://www.doi.org/10.25318/11f0019m2023004-eng
Skip to text
Text begins
Acknowledgement
Funding for this paper was provided by the Department of Canadian Heritage. We thank our colleagues at Canadian Heritage for their support and helpful comments over the course of the research initiative.
Abstract
This paper examines the social ties that Canadians have in their neighbourhoods, identified in terms of their social contact with neighbours, trust in people in their neighbourhood, and sense of inclusion and belonging. The analysis is positioned at the intersection of neighbourhood income and individual duration of residence, with long-term residents in lower-income neighbourhoods of particular interest. The modest economic resources of this group, as well as characteristics such as health and household composition, suggest that supports and resources derived from local networks may be important. Cross-tabulations show that long-term residents in lower-income neighbourhoods report less social contact, less trust and a weaker sense of inclusion in their neighbourhood than long-term residents in higher-income neighbourhoods. When other individual-level characteristics are taken into account using multivariate techniques, the social contacts observed among long-term residents in lower- and higher-income neighbourhoods do not differ significantly. However, significant differences in levels of trust and sense of inclusion remain. Measures of social ties yielded mixed results across individuals who identified as South Asian, Chinese, Black, Arab, Latin American, Southeast Asian, West Asian or White. Expectations that a lost wallet would be returned if found by someone in the neighbourhood were lower among individuals who identified as Chinese, Black, Latin American or Southeast Asian than among individuals who identified as White. Conversely, sense of community belonging and/or satisfaction with feeling part of the community were higher among individuals who identified as South Asian, West Asian, Arab and Black than among individuals who identified as White. The likelihood of knowing someone in the neighbourhood well enough to ask for a favour did not generally differ across groups.
Keywords: social capital, trust, inclusion, neighbourhoods, low-income, duration of residence
Executive summary
This paper examines the social ties that Canadians have in their neighbourhoods, identified in terms of their social contact with neighbours, trust in people in their neighbourhood, and sense of inclusion and belonging. Long-term residents in lower-income neighbourhoods are of particular interest. Supports and resources derived from local ties may be particularly important for this group, given generally modest economic resources and sociodemographic characteristics such as health, household composition and age. Theoretical expectations regarding the strength of the social ties reported by long-term residents in lower-income neighbourhoods are mixed. While individual-level duration of neighbourhood residence is positively correlated with the strength of people’s local ties, lower neighbourhood income has been associated with weaker ties. One question this raises is whether long-term residency mitigates the tendency of social ties to be weaker in lower-income neighbourhoods.
For this study, dissemination areas (DAs) were categorized as lower-, middle- and higher-income neighbourhoods using the 2016 Census, and these designations were appended to 2020 General Social Survey (GSS) respondents and 2018 Canadian Housing Survey (CHS) respondents residing in urban areas. This yielded an analytical sample composed of approximately 28,000 GSS respondents residing in approximately 15,500 DAs and approximately 41,000 CHS respondents living in just over 17,000 DAs. An individual’s duration of residence in their neighbourhood was drawn from GSS and CHS responses, with individuals classified as “short-term,” “medium-term” and “long-term” residents. The intersection of the neighbourhood income and duration of residence variables yields nine population groups, of which long-term residents in lower-, middle- and higher-income neighbourhoods are of particular interest.
The characteristics of these groups vary markedly. For example, median adult-equivalent adjusted family income among long-term residents in lower- and higher-income neighbourhoods was $40,000 and $82,000, respectively, while the shares residing in a rented dwelling were 43% and 4%, respectively. In terms of sociodemographic characteristics, 26% of long-term residents in lower-income neighbourhoods lived alone, compared with 10% of those in higher-income neighbourhoods, while the shares rating their general health as “very good” or “excellent” were 49% and 63%, respectively.
Cross-tabulations show that long-term residents in lower-income neighbourhoods report less social contact, less trust and a weaker sense of inclusion in their neighbourhood than long-term residents in higher-income neighbourhoods. For example, 15% of long-term residents in lower-income neighbourhoods said they did not know anyone in their neighbourhood well enough to ask a favour, compared with 8% of long-term residents in higher-income neighbourhoods. Participation in neighbourhood groups or organizations (prior to the COVID-19 pandemic) varied modestly. Long-term residents in lower-income neighbourhoods were less likely to say their neighbourhood is a helpful place than long-term residents in higher-income neighbourhoods (74% and 86%, respectively) and were less likely to expect a lost wallet containing $200 to be returned if found by someone in the neighbourhood. Long-term residents in lower-income neighbourhoods were slightly less satisfied in feeling part of the community than long-term residents in higher-income neighbourhoods, with scores of 6.9 and 7.4, respectively, on a scale from 0 to 10.
When other individual-level characteristics are taken into account using multivariate techniques, the social contacts observed among long-term residents in lower- and higher-income neighbourhoods do not differ significantly. However, significant differences in levels of trust and sense of inclusion remain.
Other individual-level characteristics included in the analysis yield large correlations. Consistent with the literature, homeownership is strongly and consistently associated with social ties at the local level, net of neighbourhood income and other individual-level characteristics. Individuals residing in a dwelling that is rented rather than owned were 9 percentage points less likely to know someone in the neighbourhood well enough to ask a favour, 6 percentage points less likely to have done a favour for a neighbour or received a favour from a neighbour, and 3 percentage points less likely to have participated in a neighbourhood group or organization. Levels of trust were lower as well, as individuals in rented dwellings were 11 percentage points less likely to say their neighbourhood is a helpful place and 11 percentage points less likely to expect it would be “very likely” their lost wallet would be returned, and they scored 0.12 points lower on the neighbourhood trust scale.
Individuals who rated their general health as “poor” or “fair” reported weaker social ties on most measures than those who rated their general health as “very good” or “excellent.” For example, those in “poor” or “fair” health were almost 9 percentage points less likely to know someone in the neighbourhood well enough to ask a favour, 7 percentage points less likely to view the neighbourhood as a place where people help each other and 9 percentage points less likely to rate their sense of community belonging as “very strong.”
Across the nine population groups included in this study, there were no significant differences in the likelihood of knowing someone in the neighbourhood well enough to ask a favour. That said, individuals who identified as Chinese, Arab, Latin American, Southeast Asian or West Asian were less likely than individuals who identified as White to say they knew six or more people in their neighbourhood well enough to ask a favour. This suggests that local networks are larger among individuals who identified as White. Compared with them, individuals in most other groups were less likely to say they had done a favour for a neighbour or received one from a neighbour in the past month. In terms of trust, individuals who identified as Chinese, Black, Latin American or Southeast Asian were less likely than individuals who identified as White to expect it to be “very likely” that their lost wallet would be returned if found by someone in the neighbourhood. Individuals who identified as Black or Latin American scored lower on the neighbourhood trust scale as well.
While these results point to weaker local ties among these groups, other results point to more positive outcomes. Compared with individuals who identified as White, those who identified as South Asian, Arab or West Asian were more likely to report a “very strong” sense of belonging to their local community. Satisfaction with feeling part of the community was relatively high among most groups as well.
1 Introduction
This paper examines the social ties that Canadians have in their neighbourhoods, identified in terms of their social contact with neighbours, trust in people in their neighbourhood, and sense of inclusion and belonging. The analysis is positioned at the intersection of two characteristics: the relative income of neighbourhoods and the length of time individuals have lived there. Long-term residents in lower-income neighbourhoods are of particular interest.
It is well documented that individual-level duration of residence is positively correlated with the strength of people’s ties in their local neighbourhood (Kasarda and Janowitz 1974; Sampson 1988; Carpiano 2006; Schellenberg, Lu, Schimmele and Hou 2018; Cornwell and Goldman 2021). Social connections take time to develop. By contrast, weaker social ties have been observed in lower-income neighbourhoods compared with higher-income neighbourhoods (Rankin and Quane 2000; Small 2007). One question this raises is whether long-term residency mitigates the tendency of social ties to be weaker in lower-income neighbourhoods—do long-term residents in lower-income neighbourhoods have weaker local ties than their counterparts in higher-income neighbourhoods?
The strength of social ties at the local level has implications for informal supports and resources available to individuals (Cornwell and Goldman 2021; Mair 2019). For example, knowing someone in the neighbourhood well enough to ask a favour distinguishes those with or without access to such resources. The compositional characteristics of long-term residents in lower-income neighbourhoods are important in this regard. Lower family income, lower rates of homeownership and lower levels of educational attainment are indicative of limited economic resources among this group. While higher incidences of poorer health and older age suggest a need for support and assistance at home, the prevalence of single-person households indicates that there is often no one there to provide it. Supports and resources derived from local networks may be important for individuals in such circumstances.
Cross-tabulations presented in this study show that long-term residents in lower-income neighbourhoods report less social contact, less trust and a weaker sense of inclusion in their neighbourhood than long-term residents in higher-income neighbourhoods. When other individual-level characteristics are taken into account (e.g., family income, homeownership, household composition and health) the social contact observed among long-term residents in lower- and higher-income neighbourhoods did not differ significantly. However, significant differences in levels of trust and sense of inclusion remained.
In the next section, an overview of selected research literature is provided, drawing connections between neighbourhood characteristics—particularly income—and the strength of social ties at the local level. Data sources and methods are discussed in the section that follows. This includes information on the compositional characteristics of long-term residents in lower-, middle- and higher-income neighbourhoods, as well as definitions of those terms. While differences between lower- and higher-income neighbourhoods are to be expected, the magnitude of these differences is noteworthy. Descriptive information on the strength of social ties at the local level is subsequently presented, followed by multivariate estimations of the correlations between neighbourhood- and individual-level characteristics and the neighbourhood contact, trust and inclusion reported by survey respondents. Concluding points follow.
2 Context
Urbanization and social ties have long been of interest in the social sciences. Early writers expected the emergence of large, densely populated and diverse urban centres to weaken ties between people, reduce the importance of local communities and increase social isolation (e.g., Wirth 1938; Sampson, 1988; Kasarda and Janowitz 1974). Other writers viewed urban neighbourhoods as dynamic systems of networks into which new residents are assimilated, while the community itself passes through its own lifecycle (e.g. Park, 1936).
Duration of residency—both at the neighbourhood and individual levels—stands out as a key determinant of neighbourhood social ties. Longer durations of residence provide greater opportunity for social connections to be made and neighbourhood attachment to take root (Kasarda and Janowitz 1974; Sampson 1988; Carpiano 2006; Schellenberg, Lu, Schimmele and Hou 2018; Cornwell and Goldman 2021). Longer durations also provide opportunities for individuals to select into (and out of) neighbourhoods, with those who establish social relationships in their area more likely to stay than those who do not (Clark, Duque-Calvache and Palomares-Linares 2015).
Neighbourhood characteristics and the strength of local ties have been approached in other ways, including the relationships between neighbourhood characteristics, such as green space, communal spaces and walkability, and the strength of local ties. As Small and Adler (2019) note, urbanists such as Jane Jacobs “ … have long argued that parks, plazas, and establishments in cities and neighborhoods contribute to social interaction among strangers” (p. 117). In their review of recent studies, Mazumdar, Learnihan, Cochrane and Davey (2017) generally find positive correlations between walkability or access to “destinations,” such as retail stores, sports and recreation facilities, and health clinics, and the strength of local ties (p. 16).
Neighbourhood ethnic diversity and the strength of local ties are another line of inquiry. Many studies directly test Putnam’s (2007) contention that individuals in ethnically diverse areas are more likely to disengage from social life than those in less diverse areas. Based on their reviews of this literature, van der Meer and Tolsma (2014) report that individuals in ethnically diverse neighbourhoods report lower levels of trust in their neighbours and have less contact with them than individuals in less diverse neighbourhoods. Dinesen, Schaeffer and Sønderskov (2020) report that ethnic diversity has a stronger negative impact on neighbourhood trust than on trust in people overall.
Another line of inquiry emphasizes neighbourhood poverty, physical deterioration of urban areas and social “disorganization” as factors eroding the strength of local ties. It is argued, for example, that concerns about personal safety and fear of crime cause local residents to avoid certain areas and curtail social activities, thereby increasing individual social isolation and, in turn, diminishing neighbourhood capacity for collective action (Gault and Silver 2008; Campbell and Lee 1992; Mesch and Manor 2001; Tigges, Browne and Green 1998; Small 2007).
Assessing the relationships between a potentially large and diverse set of neighbourhood characteristics and the strength of social ties at the local level is beyond the scope of this paper. Instead, neighbourhood income is used as an organizing concept that captures a range of neighbourhood characteristics that are relevant to people’s social ties at the local level. Results from the 2016 Census of Population show that census tracts with lower incomes are generally characterized by larger shares of the population residing in dwellings that are rented, rather than owned; by relatively large shares of the population residing in multi-unit dwellings, rather than single-detached houses; and, to a lesser extent, by relatively large shares of the population residing in their dwelling for less than one year (Beaumont, Bocci, Fonberg and Schellenberg 2021). A profile emerges of neighbourhoods that differ in terms of housing, population mobility and income.
Homeownership is one aspect of this profile and these differences. DiPasquale and Glaeser (1999) argue that homeowners’ ties to physical property and lower mobility incentivize their investment in social capital to protect the value of their investments. Hilber (2010) finds that the relationship between homeownership and social capital is concentrated in neighbourhoods where “house price capitalization incentives” are higher. Neighbourhood income is also central in studies of “socio-economic burden” in inner-city neighbourhoods and the impacts this has on residents and their local ties (Carpiano 2006, p. 169).
A Statistics Canada study based on the 2021 Census (Statistics Canada 2022a) highlights the demographic composition of low-income neighbourhoods: “In large urban centres, poverty is often concentrated in specific neighbourhoods, where more vulnerable populations such as racialized groups, recent immigrants, students, young adults and persons living alone or with roommates are more likely to live.”
This highlights the distinct compositional characteristics of lower-income neighbourhoods and raises implications for duration of residence. For some of these groups, such as students and young adults, duration of residence is likely to be short, given the well-documented relationship between age and residential mobility. Similarly, duration of residence may be short among new immigrants (Chastko 2021; Statistics Canada 2022b). Like students and young adults, new immigrants are in a transitional phase of their lives and at an early stage of their housing careers in Canada. Spatial assimilation theoryposits that during their initial years in a host country, immigrants “ … cluster together in low-income immigrant enclaves for both economic and social reasons” but move on to higher-quality housing and neighbourhoods with better amenities as they acquire economic resources (Myles and Hou, 2003, pp. 1-2). Put simply, duration of residence is expected to be short for some.
Overall, neighbourhood income is interrelated with a range of neighbourhood characteristics that are relevant to local ties, and it offers an effective and parsimonious way to sort people geospatially for this analysis. Neighbourhood income offers other advantages as well. It can be measured in small areas with precision, can be analyzed and presented using well-established measures and techniques, and is both intuitive and transparent.
In this study, survey respondents are sorted into lower-, middle- and higher-income neighbourhoods, and their neighbourhood contact, trust and inclusion are examined in terms of their duration of residence in the neighbourhood and other individual socioeconomic characteristics.
Long-term residents in lower-income neighbourhoods are of particular interest. While their longer duration of residence in their neighbourhood may strengthen social ties, characteristics of the neighbourhood itself may weaken or impede those ties. The outcome of this juxtaposition matters, given the modest economic resources observed among this group, and the potential importance of support and resources accessed through local ties. The modest economic resources of this group also suggest that housing options may be particularly constrained, increasing the possibility that residence in lower-income neighbourhoods is attributable to necessity, rather than choice (i.e., self-selection). In terms of demographic composition, relatively large shares of long-term residents in lower-income neighbourhoods are immigrants to Canada, and relatively large shares identify as Black, South Asian, Arab and members of other such groups listed in the Employment Equity Act. The strength of the local ties of these groups is one aspect of “social participation,” one of the key areas of intervention in Canada’s Anti-Racism Strategy.
3 Data, concepts and methods
This study uses Statistics Canada’s 2020 General Social Survey (GSS) and 2018 Canadian Housing Survey (CHS), combined with a neighbourhood-level income variable from the 2016 Census of Population. The theme of the 2020 GSS (Cycle 35) was social identity. Data were collected between August 2020 and February 2021, during the COVID-19 pandemic, and included an oversample of selected population groups identified in the Employment Equity Act.Note Interviews were conducted using computer-assisted telephone interviewing (CATI) and electronic questionnaires, with an overall response rate of 40.3%. The 2018 CHS provides information about the perspectives of Canadians on housing and how it affects their lives. The target population was Canadians living in the 10 provinces and the 3 territories. Data were collected between November 2018 and March 2019 using a self-response electronic questionnaire, CATI or computer-assisted personal interviewing. The CHS prioritized survey completion by the individual with the most knowledge of the household’s housing situation. The overall response rate was 50%.Note
To estimate neighbourhood-level income, median adult-equivalent adjusted (AEA) family income was calculated for dissemination areas (DAs). DAs are “a small, relatively stable geographic unit … with an average population of 400 to 700 persons.” (Statistics Canada, 2017). The geographic detail afforded by DAs is notable when one considers that census tracts, another commonly used geographic unit, “… usually have populations of less than 10,000 persons” (Statistics Canada 2017). Geographic proximity is an important factor in the formation of social ties (Small and Adler 2019).
DA-level neighbourhood income can be measured with precision using administrative tax data and can be presented using well-established measures and techniques. In this study, family income is adjusted to reflect differences in family size (i.e., AEA) and DAs are defined as lower-, middle- or higher-income neighbourhoods, based on their position in the distribution of DA-level AEA family income. Lower-income neighbourhoods are those in the bottom 25% of the DA distribution (Q1), middle-income neighbourhoods are those in the middle 50% of the distribution (Q2 and Q3) and higher-income neighbourhoods are those in the top 25% of the distribution (Q4).
The designation of lower-, middle- or upper-income DA was appended to 2020 GSS respondents and 2018 CHS respondents residing in census tracts, mainly in Canada’s 35 census metropolitan areas (CMAs). This yielded an analytical sample composed of approximately 28,000 GSS respondents residing in approximately 15,500 DAs and approximately 41,000 CHS respondents living in just over 17,000 DAs. Statistics Canada does not assign census tracts (of which DAs are a subunit) in smaller cities, towns and rural areas, and, consequently, Canadians residing in such areas are out of scope for this study. Local ties have been shown to be strong in these areas (Turcotte 2005). Instead, this is analysis is based predominantly on survey respondents in Canada’s 35 CMAs and some larger cities.Note
The duration of time individuals have resided in their neighbourhood was drawn from GSS and CHS survey responses. GSS respondents were asked how long they had been living in their neighbourhood. In this study, those who had been residing in their neighbourhood for less than 3 years were identified as “short-term” residents, those who had been residing there for 3 to 10 years were identified as “medium-term” residents, and those who had been residing there for “more than 10 years” were identified as “long-term” residents. It is not possible to disaggregate the category of “more than 10 years” into smaller units, given the information collected. CHS respondents were only asked how long they had been living in their current dwelling, and this was recoded into the categories listed above. Despite this being a narrower definition than the GSS, the authors opted to include CHS respondents in the study, given the complementary measures of local ties that the survey provides.
The intersection of the neighbourhood income and duration of residence variables described above yields the 3x3 matrix and nine population groups observed in Table 1. This table shows the shares of individuals in each neighbourhood income category who were short-, medium- and long-term residents. Short-term residents account for a larger share of the population in lower-income neighbourhoods (26%) than they do in higher-income neighbourhoods (18%). Conversely, long-term residents account for a smaller share of individuals in lower-income than higher-income neighbourhoods (41% and 53%, respectively). Nonetheless, it is notable that the largest share of individuals in lower-income neighbourhoods are long-term residents.
| Duration of residence | Lower income DAs | Middle income DAs | Higher income DAs |
|---|---|---|---|
| percent | |||
| Less than 3 years | 25.8 | 22.0 | 18.2 |
| 3 to 10 years | 32.9 | 29.6 | 28.6 |
| More than 10 years | 41.3 | 48.3 | 53.2 |
| Total | 100.0 | 100.0 | 100.0 |
|
Notes: DA - Dissemination area. Lower income DAs are those in the bottom quartile (Q1), middle income DAs are those in middle quartiles (Q2 and Q3) and higher income DAs are those in the top quartile (Q4). Sources: Statistics Canada, 2020 General Social Survey and 2016 Census of Population. |
|||
Each of the nine groups shown in Table 1 is included in the present analysis. For the multivariate portion, long-term residents in high-income neighbourhoods are used as the reference group, against which the outcomes of long-term residents in lower- and middle-income neighbourhoods are the main focus of comparison. These groups are shown across the third row of Table 1. In addition, the strength of social ties withinlower-income neighbourhoods (Q1) is compared across short-, medium- and long-term residents, highlighting the importance of duration of residence for illustrative and comparative purposes. Appendix tables 1 and 2 provide more detailed information on all nine groups shown in Table 1.
In addition to neighbourhood income and individual duration of residence, a suite of other individual-level characteristics is included in the analysis. These include family income, housing tenure, dwelling type, educational attainment, sex, age group, household composition, immigrant status, selected employment equity group, self-assessed general health, self-assessed mental health, CMA category of residence and survey response mode. Many of these characteristics differ starkly between long-term residents in lower-, middle- and higher-income neighbourhoods, as highlighted in Table 2.
4 Compositional characteristics of long-term residents
Beginning with financial characteristics, median AEA family income was about twice as high among long-term residents in higher-income neighbourhoods than those in lower-income neighbourhoods, at $82,000 and $40,000, respectively. Large differences in homeownership are also observed, with 43% of long-term residents in lower-income neighbourhoods residing in a rented dwelling, compared with 4% of those in higher-income neighbourhoods. In terms of dwelling types, 35% of long-term residents in lower-income neighbourhoods resided in single-detached houses, compared with 84% of long-term residents in higher-income neighbourhoods. These results highlight the differences in the financial resources and capacities of individuals in these neighbourhoods.
Educational attainment is a further consideration, given its impact on earnings. Among long-term residents, 42% of those in lower-income neighbourhoods had a high school diploma or less, compared with 23% of those in higher-income neighbourhoods. The capacity of households to field two earners also differs, with 26% of long-term residents in lower-income neighbourhoods living alone, compared with 10% of those in higher-income neighbourhoods.
In terms of other sociodemographic characteristics, a larger share of long-term residents in lower-income neighbourhoods than of those in higher-income neighbourhoods was female (56% vs. 49%); a larger share was also aged 65 or older (32% vs. 28%). Differences in health are observed as well. Just under half (49%) of long-term residents in lower-income neighbourhoods rated their general health as “very good” or “excellent”, compared with 63% of long-term residents in higher-income neighbourhoods. Respondents’ ratings of their mental health have a similar contrast, but differences across neighbourhoods are not as large.
Given that long-term residents are defined as individuals who have resided in their neighbourhood for “more than 10 years”, only immigrants who have been in Canada for at least a decade can be included in this category. With this in mind, immigrants account for a larger share of long-term residents in lower-income neighbourhoods (32%) than they do of long-term residents in higher-income neighbourhoods (23%).
Nine population groups are included in the multivariate analysis below. These include individuals who identify as White, South Asian, Chinese, Black, Arab, Latin American, Southeast Asian and West Asian, as well as an “other” category composed of other responses for which the sample size was not sufficient to generate robust estimates for long-term residents in the three neighbourhood income categories. Compositional characteristics for four of the nine groups are shown in Table 3 for illustrative purposes.
Individuals who identify as Chinese comprise 5% of long-term residents in higher-income neighbourhoods and about 7% of long-term residents in lower-income neighbourhoods. This is a smaller difference than that observed among other groups. Individuals who identify as South Asian comprise about 3% of long-term residents in higher-income neighbourhoods and almost 9% of long-term residents in lower-income neighbourhoods, while individuals who identify as Black comprise less than 2% of long-term residents in higher-income neighbourhoods and 8% of those in lower-income neighbourhoods. Individuals who identify as White comprise 84% of long-term residents in higher-income neighbourhoods and 65% of those in lower-income neighbourhoods.
GSS respondents were asked a series of questions regarding their experiences, if any, of discrimination or unfair treatment on the basis of various factors. Two variables were constructed from these responses, the first aggregating reports of discrimination or unfair treatment on the basis of sex, age, physical appearance, disability, gender identity, sexual identity or another reason, and the second aggregating reports of discrimination or unfair treatment on the basis of race or colour, ethnicity or culture, language, or religion. The shares of long-term residents reporting discrimination or unfair treatment on these bases did not vary across neighbourhood income categories. However, the share of long-term residents reporting discrimination or unfair treatment on the basis of race or colour, ethnicity or culture, language, or religion was 21% among those in lower-income neighbourhoods and about 14% among those in higher-income neighbourhoods. Whether the experience of discrimination or unfair treatment occurred in the neighbourhood cannot be determined from the information collected on the 2020 GSS.
The correlations between each of these individual-level variables, as well as the main variable of interest, are presented and discussed in the multivariate results section below.
| Dissemination areas | Long-term residents | ||
|---|---|---|---|
| Lower income DAs | Middle income DAs | Higher income DAs | |
| dollars | |||
| Family income | |||
| Median adult-equivalent adjusted income | 39,800 | 57,200 | 81,900 |
| percent | |||
| Housing tenure | |||
| Reside in rented dwelling | 42.6 | 13.6 | 4.1 |
| Dwelling type | |||
| Reside in single-detached house | 34.7 | 65.5 | 84.4 |
| Reside in semi-detached house, row house or duplex | 22.5 | 19.3 | 10.4 |
| Reside in apartment | 42.8 | 15.2 | 5.2 |
| Age groups | |||
| 20 to 34 | 16.2 | 14.0 | 13.7 |
| 65 or older | 32.2 | 29.5 | 28.2 |
| Sex | |||
| Female | 55.5 | 49.0 | 49.3 |
| Household composition | |||
| Reside alone | 26.0 | 15.6 | 10.3 |
| Couple with children | 21.9 | 30.0 | 33.3 |
| Education | |||
| High school diploma or less | 41.7 | 37.8 | 29.9 |
| General health status | |||
| Very good or excellent | 49.2 | 55.6 | 63.3 |
| Mental health status | |||
| Very good or excellent | 62.2 | 65.9 | 67.1 |
| Immigrant status | |||
| Immigrated to Canada | 31.6 | 25.6 | 23.4 |
| Selected population groups | |||
| Chinese | 6.9 | 5.5 | 5.0 |
| South Asian | 8.9 | 5.8 | 3.3 |
| Black | 8.2 | 2.8 | 1.5 |
| White | 65.3 | 76.4 | 83.6 |
| Discrimination 1 | |||
| Experienced discrimination | 23.0 | 25.4 | 22.8 |
| Discrimination 2 | |||
| Experienced discrimination | 21.1 | 18.1 | 13.5 |
|
Notes: DA - Dissemination area. Lower income DAs are those in bottom quartile (Q1), middle income DAs are those in middle quartiles (Q2 and Q3) and higher income DAs are those in the top quartile (Q4). Discrimination 1: Discrimination or unfair treatment on the basis of sex, age, physical appearance, disability, gender identity, sexual orientation or other reasons. Discrimination 2: Discrimination or unfair treatment on the basis of race or colour, ethnicity or culture, language, or religion. Sources: Statistics Canada, 2020 General Social Survey and 2016 Census of Population. |
|||
5 Social ties at the local level
Regarding dependent variables, social ties at the local level are measured using eight questions, six asked of 2020 GSS respondents and two of 2018 CHS respondents. These eight questions offer a multidimensional approach to social ties at the local level, presented here in terms of social contact, trust and belonging.
Social contact is captured using three questions. GSS respondents were asked how many people in the neighbourhood they know well enough to ask a favour, and a second question asks whether they had done a favour for a neighbour or received one from a neighbour in the prior month. Because the 2020 GSS was fielded during the pandemic, exchanges of favours with neighbours were no doubt diminished, as people assessed their risk of infection and responded to public health measures (e.g., physical distancing). A third measure of social contact—whether respondents had participated in a community group or organization in the previous year—was drawn from the 2018 CHS, well before the pandemic. These three social contact questions imply acquaintance or interactions with specific individuals in their neighbourhood.
Descriptive results on these measures are shown for selected groups in Table 3. Long-term residents in lower-income neighbourhoods were more likely not to know anyone in the neighbourhood well enough to ask a favour (15%) than long-term residents in middle-income (11%) and higher-income (8%) neighbourhoods. Participation in neighbourhood groups or organizations prior to the pandemic varied modestly, from 14% among long-term residents in lower-income neighbourhoods to 17% among those in higher-income neighbourhoods. No significant difference between these groups is observed on doing or receiving a favour. Withinlower-income neighbourhoods, 38% of short-term residents and 15% of long-term residents said they did not know anyone well enough to ask a favour.Note
Neighbourhood trust is measured using three questions. Respondents to the 2020 GSS were asked about their expectations regarding whether their lost wallet would be returned with $200 still in it if it were found by someone in the neighbourhood. Another question asked respondents whether their neighbourhood is a place where neighbours help each other, and a third asked them to rate their trust in people in their neighbourhood on a scale from 1 to 5, with 1 meaning “cannot be trusted at all” and 5 meaning “can be trusted completely.”
As shown in Table 3, long-term residents in lower-income neighbourhoods were less likely to say that their neighbourhood is a helpful place than long-term residents in higher-income neighbourhoods were (74% and 86%, respectively). Likewise, long-term residents in lower-income neighbourhoods scored lower than those in higher-income neighbourhoods on the trust scale and were less optimistic that their lost wallet would be returned. Within lower-income neighbourhoods, the share of individuals who assessed the neighbourhood as a helpful place was 27 percentage points lower among short-term residents than long-term residents, while the percentage saying it was “very likely” that their wallet would be returned was 6 percentage points lower.
Survey respondents’ sense of inclusion in their neighbourhood is captured by two questions. Respondents to the 2020 GSS were asked to rate their sense of belonging to the local community on a 4-point scale from “very weak” to “very strong” (as well as a “no opinion” response), while 2018 CHS respondents were asked to rate their satisfaction with feeling part of the community on a scale from 0 to 10.Note
The share of long-term residents reporting a “very strong” sense of belonging to the local community was 5 percentage points lower for those in lower-income neighbourhoods than those in higher-income neighbourhoods (27% and 32%, respectively). Similarly, long-term residents in lower-income neighbourhoods reported lower levels of satisfaction with feeling part of their community than long-term residents in higher-income neighbourhoods (at 6.9 and 7.4, respectively on a scale from 0 to 10). Withinlower-income neighbourhoods, short-term residents were less satisfied than long-term residents with feeling part of their community (at 6.1 and 6.9, respectively), although differences were not observed on sense of community belonging.
| Social contact | Trust | Inclusion | ||||||
|---|---|---|---|---|---|---|---|---|
| Don't know any neighbours well enough to ask for a favour | Did a favour for a neighbour or received a favour from a neighbour | Participate in a neighbourhood organization | Say the neighbourhood is a place where neighbours help each other | Say it is very likely a lost wallet would be returned if found by a neighbour | Mean trust in neighbours on a 1 to 5 scale | Report a very strong sense of community belonging | Mean satisfaction with feeling part of the community on a 0 to 10 scale | |
| percent | ||||||||
| Lower-income DAs | ||||||||
| Short-term residents | 37.7 | 50.7 | 11.6 | 46.9 | 36.3 | 3.3 | 25.3 | 6.1 |
| Medium-term residents | 21.6 | 56.3 | 12.9 | 65.0 | 33.4 | 3.2 | 24.7 | 6.3 |
| Long-term residents | 15.0 | 68.5 | 14.3 | 74.3 | 42.3 | 3.4 | 27.0 | 6.9 |
| Middle-income DAs | ||||||||
| Long-term residents | 11.4 | 68.7 | 15.3 | 82.5 | 55.2 | 3.6 | 28.4 | 7.1 |
| Higher-income DAs | ||||||||
| Long-term residents | 8.0 | 71.2 | 16.8 | 86.0 | 66.4 | 3.8 | 31.9 | 7.4 |
|
Notes: DA - Dissemination area. Lower income DAs are those in bottom quartile (Q1), middle income DAs are those in middle quartiles (Q2 and Q3) and higher income DAs are those in the top quartile (Q4). Sources: Statistics Canada, 2020 General Social Survey, 2018 Canadian Housing Survey and 2016 Census of Population. |
||||||||
Overall, the descriptive results above suggest that social ties at the local level are somewhat weaker among long-term residents in lower-income neighbourhoods than higher-income neighbourhoods. This is observed on measures of social contact, trust and inclusion, although some measures capture larger between-group differences than others.
6 Multivariate correlates of neighbourhood social contact, trust and inclusion
Differences across neighbourhoods could reflect the individual-level characteristics of people residing in those areas. For example, immigrants are overrepresented in lower-income neighbourhoods and this, rather than neighbourhood characteristics, may account for weaker social ties in those areas. To estimate this, ordinary least squares (OLS) or multinomial logistic regressions were run on each social contact, trust and inclusion measure. These models estimate how much change in the outcome of interest is associated with a specified characteristic, relative to a reference group (e.g., women relative to men), taking into account other characteristics in the model. The multinomial results are presented as marginal effects, expressed as the percentage-point difference in an outcome associated with a specific characteristic. The results for neighbourhood trust (scale from 1 to 5) and satisfaction with feeling part of the community (scale from 0 to 10) are presented as OLS coefficients. The results for all other models (did or received a favour, neighbourhood as a place where neighbours help each other, and member or participant in a community group in the neighbourhood) are estimates presented from linear probability models, where the coefficients are marginal effects. All models are estimated using survey weights and cluster-robust standard errors to correct for unobserved similarities among respondents within DAs. This approach is similar to hierarchical linear modelling—it addresses data clustering but is interpreted as a single-level model (McNeish, Stapleton and Silverman 2017).
6.1 Duration of residency and neighbourhood income
The correlations between the main variables of interest—duration of residence and neighbourhood income—and individuals’ social contact, trust and inclusion are examined first. Results from Table 4 are shown graphically in charts 1 through 5 for ease of presentation.
Long-term residents in lower-income neighbourhoods do not generally report weaker social contact than their counterparts in higher-income neighbourhoods, net of other individual-level characteristics. Few significant between-group differences are observed for doing or receiving a favour, or for participating in a neighbourhood group or organization (Table 4). Likewise, long-term residents in lower-income neighbourhoods were no less likely than those in higher-income neighbourhoods to know someone well enough to ask a favour. That said, long-term residents in lower- and middle-income neighbourhoods were less likely than those in higher-income neighbourhoods to know six or more people well enough to ask a favour (see Chart 1), suggesting that local networks are larger among higher-income neighbourhoods.
The three bars on the right side of Chart 1 show the differing likelihood of short-, medium- and long-term residents in lower-income neighbourhoods knowing six or more people well enough to ask a favour, relative to long-term residents in high-income neighbourhoods.
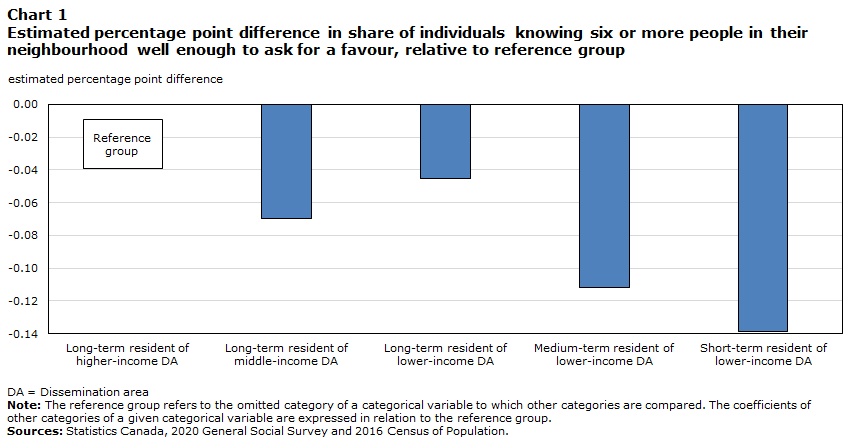
Data table for Chart 1
| estimated percentage point difference | |
|---|---|
| Long-term resident of higher-income DA | Note ...: not applicable |
| Long-term resident of middle-income DA | -0.07 |
| Long-term resident of lower-income DA | -0.05 |
| Medium-term resident of lower-income DA | -0.11 |
| Short-term resident of lower-income DA | -0.14 |
|
... not applicable DA = Dissemination area Note: The reference group refers to the omitted category of a categorical variable to which other categories are compared. The coefficients of other categories of a given categorical variable are expressed in relation to the reference group. Sources: Statistics Canada, 2020 General Social Survey and 2016 Census of Population. |
|

Data table for Chart 2
| estimated percentage point difference | |
|---|---|
| Long-term resident of higher-income DA | Note ...: not applicable |
| Long-term resident of middle-income DA | -0.02 |
| Long-term resident of lower-income DA | -0.05 |
| Medium-term resident of lower-income DA | -0.08 |
| Short-term resident of lower-income DA | -0.25 |
|
... not applicable DA = Dissemination area Note: The reference group refers to the omitted category of a categorical variable to which other categories are compared. The coefficients of other categories of a given categorical variable are expressed in relation to the reference group. Sources: Statistics Canada, 2020 General Social Survey and 2016 Census of Population. |
|
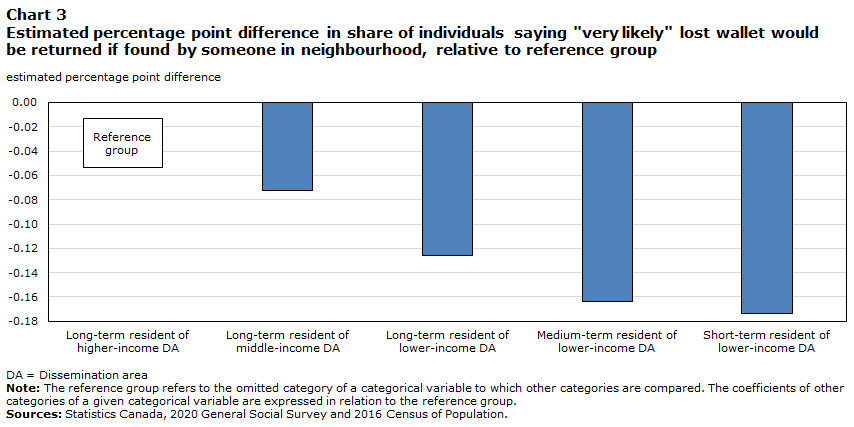
With regard to trust, large and consistent differences are observed. Long-term residents in lower- and middle-income neighbourhoods were less likely than their counterparts in higher-income neighbourhoods to report that their neighbourhood is a place where people help each other (Chart 2) and were less likely to expect their lost wallet to be returned (Chart 3). Responses on the neighbourhood trust scale follow a similar pattern, with long-term residents in middle- and lower-income neighbourhoods expressing lower levels of trust (Chart 4).
Data table for Chart 3
| estimated percentage point difference | |
|---|---|
| Long-term resident of higher-income DA | Note ...: not applicable |
| Long-term resident of middle-income DA | -0.07 |
| Long-term resident of lower-income DA | -0.13 |
| Medium-term resident of lower-income DA | -0.16 |
| Short-term resident of lower-income DA | -0.17 |
|
... not applicable DA = Dissemination area Note: The reference group refers to the omitted category of a categorical variable to which other categories are compared. The coefficients of other categories of a given categorical variable are expressed in relation to the reference group. Sources: Statistics Canada, 2020 General Social Survey and 2016 Census of Population. |
|

Data table for Chart 4
| estimated percentage point difference | |
|---|---|
| Long-term resident of higher-income DA | Note ...: not applicable |
| Long-term resident of middle-income DA | -0.19 |
| Long-term resident of lower-income DA | -0.22 |
| Medium-term resident of lower-income DA | -0.33 |
| Short-term resident of lower-income DA | -0.27 |
|
... not applicable DA = Dissemination area Note: The reference group refers to the omitted category of a categorical variable to which other categories are compared. The coefficients of other categories of a given categorical variable are expressed in relation to the reference group. Sources: Statistics Canada, 2020 General Social Survey and 2016 Census of Population. |
|
In terms of inclusion, the 2018 CHS question regarding satisfaction with feeling part of the community yields results consistent with those above (Chart 5). Net of other individual-level characteristics, long-term residents in lower- and middle-income neighbourhoods expressed lower satisfaction with feeling part of the community than their counterparts in higher-income neighbourhoods (Chart 5). Results on the community belonging variable were weaker, with only long-term residents in middle-income neighbourhoods—but not lower-income neighbourhoods—expressing a more limited sense of belonging than long-term residents in higher-income neighbourhoods.

Data table for Chart 5
| estimated percentage point difference | |
|---|---|
| Long-term resident of higher-income DA | Note ...: not applicable |
| Long-term resident of middle-income DA | -0.20 |
| Long-term resident of lower-income DA | -0.28 |
| Medium-term resident of lower-income DA | -0.36 |
| Short-term resident of lower-income DA | -0.44 |
|
... not applicable DA = Dissemination area Note: The reference group refers to the omitted category of a categorical variable to which other categories are compared. The coefficients of other categories of a given categorical variable are expressed in relation to the reference group. Sources: Statistics Canada, 2020 General Social Survey and 2016 Census of Population. |
|
Overall, the strength of social ties at the local level observed among long-term residents varies across social contact, trust and inclusion. Evidence of weaker social contact among long-term residents in lower-income neighbourhoods than those in higher-income neighbourhoods is limited, at best. By contrast, long-term residents in lower- and middle-income neighbourhoods consistently expressed less trust than those in higher-income neighbourhoods. And in terms of inclusion, long-term residents in lower- and middle-income neighbourhoods were less satisfied with feeling part of the community than those in higher-income neighbourhoods, but with weaker evidence observed on sense of community belonging.
6.2 Housing and sociodemographic covariates
The multivariate results highlight large differences in social ties at the local level, observed across individual-level economic and sociodemographic characteristics. Consistent with the literature cited above, homeownership is strongly and consistently associated with strong social ties at the local level, even when characteristics such as neighbourhood income and family income are taken into account. Individuals residing in a dwelling that is rented rather than owned by a household member were 9 percentage points less likely to know someone in the neighbourhood well enough to ask a favour, 6 percentage points less likely to have done a favour for a neighbour or received one from a neighbour, and 3 percentage points less likely to have participated in a neighbourhood group or organization. Levels of trust were lower as well, as individuals in rented dwellings were 11 percentage points less likely to say their neighbourhood is a helpful place and 11 percentage points less likely to expect it would be “very likely” their lost wallet would be returned, and they scored 0.12 points lower on the neighbourhood trust scale. Individuals in rented dwellings also reported less favourable results on the measures of community belonging and satisfaction with inclusion.
The type of dwelling in which individuals resided, regardless of whether it was owned or rented, is also correlated with the strength of local ties. Overall, such ties are weaker among individuals residing in multi-unit dwellings than among those in single-detached houses, although some nuance is warranted here. Compared with individuals in single-detached houses, individuals in apartments and other multi-unit dwellings (i.e., row houses, duplexes and semi-detached houses) report lower levels of trust and lower satisfaction with feeling part of their community. However, only individuals in apartments are significantly less likely than those in single-detached houses to know someone in their neighbourhood well enough to ask a favour or to have done or received a favour in the previous month. Social contact, it appears, is particularly weak in apartment buildings. Whether this reflects circumstances unique to the COVID-19 pandemic or a broader correlation between dwelling types and social contact cannot be discerned from the cross-sectional data being used.
The vulnerabilities of long-term residents in lower-income neighbourhoods were highlighted above, along with the potential need for local assistance. However, individuals who rated their general health as “poor” or “fair” reported weaker social ties on most measures than those who rated their general health as “very good” or “excellent.” For example, those in “poor” or “fair” health were almost 9 percentage points less likely to know someone in the neighbourhood well enough to ask a favour, 7 percentage points less likely to view the neighbourhood as a place where people help each other and 9 percentage points less likely to rate their sense of community belonging as “very strong.” They also scored 0.78 points lower on the question about satisfaction with inclusion than individuals in “very good” or “excellent health.” Respondents’ assessments of their mental health yielded similar results on most measures. Notably, individuals who rated their mental health as “poor” or “fair” scored 1.52 points lower on the measure of satisfaction with feeling part of the community than individuals who rated their mental health as “very good” or “excellent”. Poorer health could inhibit investment in social ties, and weak social ties could diminish health. Direction of causality aside, the combination of poorer health, lower family incomes and weaker ties suggests multiple vulnerabilities among long-term residents in lower-income neighbourhoods.
Regarding sociodemographic characteristics, the strength of local ties was weak among young adults aged 20 to 34, relative to the reference group of those aged 35 to 49. Young adults may have little incentive to develop local ties if their social networks are mainly composed of friends, fellow students or co-workers elsewhere, or if they view their neighbourhood residence as temporary. That said, young adults scored low with regard to satisfaction with feeling part of the community, suggesting that weak ties may not be entirely by choice. Seniors had positive scores on seven of the eight measures of local ties. This may reflect an unobserved duration of residence effect among this group, as the “more than 10 years” response category available on the GSS makes it impossible to differentiate respondents who have resided in their neighbourhood for 35 years from those who have resided there for 11 years. Still, the strength and importance of local ties among older adults have been documented in the literature (Cornwell and Goldman 2021).
In terms of other sociodemographic characteristics, women were 2 percentage points more likely than men to report a “very strong” sense of community belonging, were 3 percentage points more likely to have participated in a neighbourhood group or organization, and scored 0.12 points higher on the scale of satisfaction with feeling part of the community. Differences are not observed on most other measures.
In terms of immigrant status, the only notable result is observed in community belonging, with immigrants being 7 percentage points morelikely to report a “very strong” sense of belonging to their local community than their Canadian-born counterparts. Community belonging has been shown to reflect neighbourhood features in addition to social contact, such as recreational amenities, accessibility amenities, confidence in local merchants, and perceptions of crime and safety (Schellenberg, Lu, Schimmele and Hou 2018). Such features may foster community belonging among new immigrants through the settlement process, even though their social contact and trust are much like those of the Canadian-born population.
Across the nine population groups included in this study, there were no significant differences in the likelihood of knowing someone in the neighbourhood well enough to ask a favour. That said, individuals who identified as Chinese, Arab, Latin American, Southeast Asian and West Asian were less likely than individuals who identified as White to say they knew six or more people in their neighbourhood well enough to ask a favour. This suggests that local networks are larger among individuals who identified as White. Compared with them, individuals in most other groups were less likely to say they had done a favour for a neighbour or received one from a neighbour in the past month. Regarding trust, individuals who identified as Chinese, Black, Latin American or Southeast Asian were less likely than individuals who identified as White to expect it to be “very likely” that their lost wallet would be returned if found by someone in their neighbourhood; individuals who identified as Black or Latin American scored lower on the neighbourhood trust scale as well.
While these results point to weaker local ties among these groups, other results point to more positive outcomes. Compared with individuals who identified as White, those who identified as South Asian, Arab or West Asian were more likely to report a “very strong” sense of belonging to their local community. Satisfaction with feeling part of the community was relatively high among most groups as well.
Reports of discrimination or unfair treatment on the basis of race or colour, ethnicity or culture, language, or religion (Discrimination 2 in Table 4) were not statistically correlated with social contact, but they were negatively correlated with trust and inclusion. Individuals reporting discrimination or unfair treatment on these bases were 4 percentage points less likely to expect it to be “very likely” that their lost wallet would be returned if found by a neighbour, 6 percentage points less likely to say their neighbourhood is a helpful place and 4 percentage points less likely to report a “very strong” sense of community belonging.
Finally, the strength of social ties at the local level is correlated with survey mode. Online survey respondents reported weaker ties on a range of measures than respondents who answered via CATI. For example, compared with CATI respondents, online survey respondents were 5 percentage points more likely to say they did not know anyone well enough to ask for a favour, 5 percentage points less likely to have done or received a favour, 7 percentage points less likely to view the neighbourhood as a helpful place, and 4 percentage points less likely to report a “very strong” sense of belonging to the local community. One interpretation is that, in the presence of an interviewer, survey respondents are less willing to accurately report on their local ties because of concerns about losing face (e.g., being embarrassed about not having a friend in the neighbourhood) or because they think their response could elicit a negative response from the interviewer.
| DA income and duration of residence (ref.: long-term resident of higher-income DA) | How many people know well enough to ask for a favour (ref.: 1 to 5) | Did or received a favour | Neighourhood a place where neighbours help each other | Neighbourhood trust | Likelihood of return of lost wallet by neighbour (ref.: somewhat likely) | Sense of belonging to local community (ref.: somewhat strong) | Member or participant in a community group in neighbourhood | Satisfaction with feeling part of the community | ||||||
|---|---|---|---|---|---|---|---|---|---|---|---|---|---|---|
| None | 1 to 5 | 6 or more | 0-No/1-Yes | 0-No/1-Yes | 1-to-5 scale | Not likely at all | Somewhat likely | Very likely | Weak/No opinion | Somewhat strong | Very strong | 0-No/1-Yes | 0-to-10 scale | |
| Short-term resident of lower-income DA | 0.127Note *** | 0.012 | -0.139Note *** | -0.067Table 4 Note † | -0.251Note *** | -0.270Note ** | 0.077Note *** | 0.097Note * | -0.173Note *** | 0.061Table 4 Note † | -0.016 | -0.045 | 0.017 | -0.438Note *** |
| Medium-term resident of lower-income DA | 0.023 | 0.088Note ** | -0.112Note *** | -0.034 | -0.080Note ** | -0.334Note *** | 0.069Note *** | 0.095Note ** | -0.164Note *** | 0.082Note ** | -0.018 | -0.063Note * | 0.022 | -0.357Note *** |
| Long-term resident of lower-income DA | 0.003 | 0.043 | -0.045Table 4 Note † | 0.033 | -0.054Note * | -0.215Note *** | 0.052Note *** | 0.073Note ** | -0.126Note *** | 0.016 | 0.016 | -0.032 | 0.006 | -0.279Note *** |
| Short-term resident of middle-income DA | 0.223Note *** | -0.064Table 4 Note † | -0.159Note *** | -0.086Note * | -0.242Note *** | -0.361Note *** | 0.071Note ** | 0.072Table 4 Note † | -0.143Note *** | 0.030 | 0.053 | -0.083Note * | 0.001 | -0.237Note * |
| Medium-term resident of middle-income DA | 0.062Note * | 0.034 | -0.095Note *** | -0.023 | -0.030 | -0.255Note *** | 0.032Note * | 0.089Note ** | -0.121Note *** | 0.021 | 0.057Table 4 Note † | -0.078Note ** | 0.003 | -0.172Table 4 Note † |
| Long-term resident of middle-income DA | 0.038Note ** | 0.032Table 4 Note † | -0.070Note *** | -0.009 | -0.023Table 4 Note † | -0.189Note *** | 0.029Note ** | 0.044Note * | -0.073Note *** | 0.030Table 4 Note † | 0.013 | -0.043Note ** | 0.003 | -0.202Note *** |
| Short-term resident of higher-income DA | 0.145Note *** | -0.018 | -0.127Note *** | -0.035 | -0.103Note *** | -0.115Table 4 Note † | 0.016 | -0.030 | 0.014 | 0.059Note * | 0.040 | -0.099Note *** | 0.013 | -0.143 |
| Medium-term resident of higher-income DA | 0.016 | 0.038 | -0.054Note ** | 0.027 | -0.003 | -0.151Note *** | 0.015 | 0.032 | -0.047Table 4 Note † | 0.036 | 0.028 | -0.064Note ** | 0.032Note * | 0.038 |
| Long-term resident of higher-income DA (ref.) | Note ...: not applicable | Note ...: not applicable | Note ...: not applicable | Note ...: not applicable | Note ...: not applicable | Note ...: not applicable | Note ...: not applicable | Note ...: not applicable | Note ...: not applicable | Note ...: not applicable | Note ...: not applicable | Note ...: not applicable | Note ...: not applicable | Note ...: not applicable |
| Log of adult-equivalent adjusted family income | -0.007 | 0.010 | -0.003 | -0.010 | -0.009 | 0.016 | -0.007Table 4 Note † | -0.009 | 0.017Table 4 Note † | 0.002 | -0.004 | 0.002 | -0.010Note * | -0.079Note ** |
| Housing tenure | ||||||||||||||
| Rented | 0.090Note *** | -0.082Note *** | -0.008 | -0.057Note ** | -0.114Note *** | -0.122Note ** | 0.054Note *** | 0.051Note * | -0.105Note *** | 0.046Note ** | -0.064Note ** | 0.018 | -0.034Note *** | -0.201Note *** |
| Owned (ref.) | Note ...: not applicable | Note ...: not applicable | Note ...: not applicable | Note ...: not applicable | Note ...: not applicable | Note ...: not applicable | Note ...: not applicable | Note ...: not applicable | Note ...: not applicable | Note ...: not applicable | Note ...: not applicable | Note ...: not applicable | Note ...: not applicable | Note ...: not applicable |
| Dwelling type | ||||||||||||||
| Single-detached house (ref.) | Note ...: not applicable | Note ...: not applicable | Note ...: not applicable | Note ...: not applicable | Note ...: not applicable | Note ...: not applicable | Note ...: not applicable | Note ...: not applicable | Note ...: not applicable | Note ...: not applicable | Note ...: not applicable | Note ...: not applicable | Note ...: not applicable | Note ...: not applicable |
| Semi-detached house, row house or duplex | 0.003 | 0.001 | -0.004 | -0.012 | -0.046Note ** | -0.099Note ** | 0.004 | 0.043Note * | -0.047Note * | 0.004 | 0.009 | -0.013 | 0.003 | -0.152Note ** |
| Apartment | 0.053Note ** | -0.031 | -0.022Table 4 Note † | -0.110Note *** | -0.070Note *** | -0.102Note ** | 0.006 | 0.053Note * | -0.059Note ** | 0.009 | 0.019 | -0.028 | 0.004 | -0.108Table 4 Note † |
| Education | ||||||||||||||
| High school diploma or less | 0.023Table 4 Note † | 0.003 | -0.027Note * | -0.038Note * | 0.021 | -0.108Note ** | 0.038Note *** | 0.016 | -0.054Note ** | -0.014 | 0.004 | 0.010 | -0.082Note *** | 0.274Note *** |
| Non-university postsecondary | -0.001 | 0.016 | -0.016 | 0.000 | 0.029Note * | -0.066Note * | 0.014 | 0.032Note * | -0.045Note ** | -0.030Note * | 0.017 | 0.013 | -0.041Note *** | 0.050 |
| University (ref.) | Note ...: not applicable | Note ...: not applicable | Note ...: not applicable | Note ...: not applicable | Note ...: not applicable | Note ...: not applicable | Note ...: not applicable | Note ...: not applicable | Note ...: not applicable | Note ...: not applicable | Note ...: not applicable | Note ...: not applicable | Note ...: not applicable | Note ...: not applicable |
| Age | ||||||||||||||
| 15 to 19 | 0.010 | -0.006 | -0.004 | -0.079Table 4 Note † | -0.021 | -0.082 | 0.003 | 0.028 | -0.032 | -0.112Note *** | -0.025 | 0.137Note ** | 0.017 | -0.649Note ** |
| 20 to 34 | 0.047Note ** | -0.012 | -0.035Note * | -0.069Note *** | -0.035Note * | -0.108Note ** | 0.002 | 0.051Note * | -0.053Note ** | 0.012 | -0.017 | 0.005 | -0.046Note *** | -0.388Note *** |
| 35 to 49 (ref.) | Note ...: not applicable | Note ...: not applicable | Note ...: not applicable | Note ...: not applicable | Note ...: not applicable | Note ...: not applicable | Note ...: not applicable | Note ...: not applicable | Note ...: not applicable | Note ...: not applicable | Note ...: not applicable | Note ...: not applicable | Note ...: not applicable | Note ...: not applicable |
| 50 to 64 | -0.001 | 0.005 | -0.004 | 0.010 | -0.003 | 0.018 | -0.004 | -0.014 | 0.017 | -0.046Note ** | 0.027 | 0.019 | 0.000 | 0.220Note *** |
| 65 or older | -0.035Note * | 0.038Note * | -0.003 | 0.058Note ** | 0.015 | 0.146Note *** | -0.021Table 4 Note † | -0.032 | 0.053Note ** | -0.090Note *** | 0.054Note ** | 0.036Note * | 0.089Note *** | 0.924Note *** |
| Sex | ||||||||||||||
| Women | -0.001 | 0.006 | -0.005 | -0.033Note * | 0.005 | 0.030 | -0.008 | -0.008 | 0.016 | -0.027Note * | 0.005 | 0.022Table 4 Note † | 0.032Note *** | 0.121Note ** |
| Men (ref.) | Note ...: not applicable | Note ...: not applicable | Note ...: not applicable | Note ...: not applicable | Note ...: not applicable | Note ...: not applicable | Note ...: not applicable | Note ...: not applicable | Note ...: not applicable | Note ...: not applicable | Note ...: not applicable | Note ...: not applicable | Note ...: not applicable | Note ...: not applicable |
| Household composition | ||||||||||||||
| Unattached individual | 0.051Note *** | 0.003 | -0.053Note *** | -0.023 | -0.053Note ** | -0.069Table 4 Note † | 0.026Note * | 0.005 | -0.030 | 0.083Note *** | -0.051Note ** | -0.032Table 4 Note † | -0.025Note ** | -0.323Note *** |
| Single parent | 0.038Table 4 Note † | -0.014 | -0.024 | -0.029 | -0.057Note * | -0.130Note * | 0.045Note * | -0.023 | -0.022 | 0.057Note * | -0.057Note * | 0.000 | -0.034Note ** | -0.351Note *** |
| Couple with no children | 0.021 | 0.014 | -0.035Note ** | -0.008 | -0.032Note * | -0.041 | 0.013 | 0.007 | -0.019 | 0.058Note *** | -0.043Note * | -0.015 | -0.030Note *** | -0.118Note * |
| Couple with children (ref.) | Note ...: not applicable | Note ...: not applicable | Note ...: not applicable | Note ...: not applicable | Note ...: not applicable | Note ...: not applicable | Note ...: not applicable | Note ...: not applicable | Note ...: not applicable | Note ...: not applicable | Note ...: not applicable | Note ...: not applicable | Note ...: not applicable | Note ...: not applicable |
| Other | 0.084Note *** | -0.031 | -0.053Note ** | -0.129Note *** | -0.094Note *** | -0.097Table 4 Note † | 0.016 | 0.037 | -0.054Note * | 0.092Note *** | -0.026 | -0.065Note ** | -0.017 | -0.175Table 4 Note † |
| Self-assessed mental health | ||||||||||||||
| Fair or poor | 0.047Note * | 0.013 | -0.059Note *** | -0.028 | -0.059Note ** | -0.166Note *** | 0.032Note * | 0.037 | -0.068Note ** | 0.131Note *** | -0.026 | -0.105Note *** | 0.015 | -1.518Note *** |
| Good | 0.023Table 4 Note † | 0.013 | -0.036Note ** | -0.023 | -0.013 | -0.099Note ** | 0.005 | 0.033Table 4 Note † | -0.038Note * | 0.063Note *** | 0.008 | -0.071Note *** | 0.004 | -0.654Note *** |
| Very good or excellent (ref.) | Note ...: not applicable | Note ...: not applicable | Note ...: not applicable | Note ...: not applicable | Note ...: not applicable | Note ...: not applicable | Note ...: not applicable | Note ...: not applicable | Note ...: not applicable | Note ...: not applicable | Note ...: not applicable | Note ...: not applicable | Note ...: not applicable | Note ...: not applicable |
| Immigrant status | ||||||||||||||
| Immigrated to Canada | 0.007 | 0.000 | -0.007 | -0.008 | -0.001 | 0.064Table 4 Note † | 0.006 | 0.041Note * | -0.047Note * | -0.078Note *** | 0.006 | 0.072Note *** | -0.010 | -0.037 |
| Born in Canada (ref.) | Note ...: not applicable | Note ...: not applicable | Note ...: not applicable | Note ...: not applicable | Note ...: not applicable | Note ...: not applicable | Note ...: not applicable | Note ...: not applicable | Note ...: not applicable | Note ...: not applicable | Note ...: not applicable | Note ...: not applicable | Note ...: not applicable | Note ...: not applicable |
| Population group | ||||||||||||||
| South Asian | -0.023 | 0.032 | -0.009 | -0.011 | 0.074Note ** | 0.104 | -0.013 | 0.009 | 0.004 | -0.150Note *** | -0.034 | 0.184Note *** | -0.006 | 0.264Note * |
| Chinese | 0.028 | 0.053Table 4 Note † | -0.081Note *** | -0.066Note * | -0.001 | -0.008 | 0.025 | 0.055Table 4 Note † | -0.080Note * | 0.035 | 0.008 | -0.043 | -0.027 | 0.144Table 4 Note † |
| Black | 0.024 | 0.000 | -0.024 | -0.074Table 4 Note † | 0.067Table 4 Note † | -0.186Note * | 0.015 | 0.075Table 4 Note † | -0.090Note * | -0.019 | -0.018 | 0.037 | 0.064Note ** | 0.261Note * |
| Arab | -0.018 | 0.105Note ** | -0.086Note *** | -0.008 | 0.025 | -0.081 | -0.028 | -0.079Table 4 Note † | 0.107Note * | -0.088Note * | -0.017 | 0.105Note * | Note ..: not available for a specific reference period | Note ..: not available for a specific reference period |
| Latin American | 0.020 | 0.041 | -0.061Note * | -0.089Table 4 Note † | -0.040 | -0.173Table 4 Note † | -0.022 | 0.134Note ** | -0.112Note * | -0.019 | -0.001 | 0.020 | Note ..: not available for a specific reference period | Note ..: not available for a specific reference period |
| Southeast Asian | 0.002 | 0.074 | -0.077Note * | -0.123Note * | 0.026 | -0.119 | 0.010 | 0.101Table 4 Note † | -0.110Table 4 Note † | -0.020 | -0.015 | 0.035 | Note ..: not available for a specific reference period | Note ..: not available for a specific reference period |
| West Asian | 0.109 | -0.007 | -0.102Note ** | -0.159Table 4 Note † | -0.017 | 0.057 | -0.071Note *** | -0.017 | 0.088 | -0.103 | -0.119 | 0.222Note ** | Note ..: not available for a specific reference period | Note ..: not available for a specific reference period |
| Other | 0.064Note * | 0.000 | -0.064Note ** | -0.071Note * | 0.002 | -0.147Note * | 0.016 | 0.077Note * | -0.093Note ** | -0.066Note * | 0.043 | 0.023 | -0.038Note *** | 0.278Note *** |
| White (ref.) | Note ...: not applicable | Note ...: not applicable | Note ...: not applicable | Note ...: not applicable | Note ...: not applicable | Note ...: not applicable | Note ...: not applicable | Note ...: not applicable | Note ...: not applicable | Note ...: not applicable | Note ...: not applicable | Note ...: not applicable | Note ...: not applicable | Note ...: not applicable |
| Discrimination 1 | ||||||||||||||
| Yes | -0.014 | 0.016 | -0.002 | 0.068Note *** | -0.024 | -0.100Note ** | -0.001 | 0.013 | -0.012 | 0.026Table 4 Note † | -0.005 | -0.022 | Note ...: not applicable | Note ...: not applicable |
| No (ref.) | Note ...: not applicable | Note ...: not applicable | Note ...: not applicable | Note ...: not applicable | Note ...: not applicable | Note ...: not applicable | Note ...: not applicable | Note ...: not applicable | Note ...: not applicable | Note ...: not applicable | Note ...: not applicable | Note ...: not applicable | Note ...: not applicable | Note ...: not applicable |
| Discrimination 2 | ||||||||||||||
| Yes | -0.015 | -0.003 | -0.012 | 0.017 | -0.055Note *** | -0.156Note *** | 0.042Note *** | 0.000 | -0.042Note * | 0.053Note ** | -0.009 | -0.044Note ** | Note ...: not applicable | Note ...: not applicable |
| No (ref.) | Note ...: not applicable | Note ...: not applicable | Note ...: not applicable | Note ...: not applicable | Note ...: not applicable | Note ...: not applicable | Note ...: not applicable | Note ...: not applicable | Note ...: not applicable | Note ...: not applicable | Note ...: not applicable | Note ...: not applicable | Note ...: not applicable | Note ...: not applicable |
| Place of residence | ||||||||||||||
| Toronto (ref.) | Note ...: not applicable | Note ...: not applicable | Note ...: not applicable | Note ...: not applicable | Note ...: not applicable | Note ...: not applicable | Note ...: not applicable | Note ...: not applicable | Note ...: not applicable | Note ...: not applicable | Note ...: not applicable | Note ...: not applicable | Note ...: not applicable | Note ...: not applicable |
| Montréal | -0.025 | 0.076Note *** | -0.051Note *** | 0.048Note * | 0.009 | -0.030 | 0.013 | 0.054Note * | -0.067Note ** | -0.001 | 0.045Table 4 Note † | -0.044Note * | -0.052Note *** | -0.004 |
| Vancouver | 0.016 | -0.008 | -0.008 | 0.033 | -0.016 | 0.027 | 0.017 | 0.006 | -0.023 | -0.037Table 4 Note † | 0.038 | 0.000 | 0.039Note ** | -0.157Note * |
| Medium-sized CMA | -0.014 | 0.010 | 0.004 | 0.024 | 0.010 | 0.023 | -0.012 | 0.026 | -0.014 | -0.012 | 0.016 | -0.004 | -0.005 | -0.139Note * |
| Small CMA | -0.009 | -0.010 | 0.019 | 0.025 | -0.003 | 0.026 | -0.007 | 0.000 | 0.006 | -0.026 | 0.034 | -0.008 | 0.010 | 0.020 |
| Outside CMA (CAs only) | 0.012 | 0.014 | -0.026 | 0.004 | -0.011 | 0.036 | -0.013 | 0.034 | -0.021 | -0.004 | 0.012 | -0.009 | -0.004 | -0.131 |
| Survey mode | ||||||||||||||
| Computer-assisted telephone interview (ref.) | Note ...: not applicable | Note ...: not applicable | Note ...: not applicable | Note ...: not applicable | Note ...: not applicable | Note ...: not applicable | Note ...: not applicable | Note ...: not applicable | Note ...: not applicable | Note ...: not applicable | Note ...: not applicable | Note ...: not applicable | Note ...: not applicable | Note ...: not applicable |
| Self-administered online questionnaire | 0.048Note *** | 0.026 | -0.074Note *** | -0.047Note ** | -0.068Note *** | -0.052 | -0.029Note ** | 0.083Note *** | -0.053Note ** | 0.034Note * | 0.005 | -0.039Note * | Note ...: not applicable | Note ...: not applicable |
| Constant | Note ...: not applicable | Note ...: not applicable | Note ...: not applicable | 0.936Note *** | 1.081Note *** | 3.885Note *** | Note ...: not applicable | Note ...: not applicable | Note ...: not applicable | Note ...: not applicable | Note ...: not applicable | Note ...: not applicable | 0.301Note *** | 8.375Note *** |
|
.. not available for a specific reference period ... not applicable
Sources: Statistics Canada, 2020 General Social Survey, 2018 Canadian Housing Survey and 2016 Census of Population. |
||||||||||||||
7 Conclusion
Social ties are multidimensional. Each of the three measures in this study—social contact, trust and inclusion—captures different facets of neighbourly bonds. The strength of these local social ties similarly varies by neighbourhood income, duration of residency and the socioeconomic characteristics of individuals.
Social contact—meaning neighbourhood acquaintances one could exchange a favour with, and participation in local community groups or associations—is one type of social tie. While long-term residents in lower-income neighbourhoods report weaker social ties across all three measures, compared with their higher-income neighbourhood counterparts, accounting for individual characteristics suggests that neighbourhood income is only weakly linked to the strength of social contact. By contrast, results indicate housing tenure, age, health and household composition are reliable predictors of social contact.
Though trust in one’s neighbours is built over time, findings suggest that trust is predominantly linked to neighbourhood income over temporal factors, such as duration of residency. Long-term residents in lower- and middle-income neighbourhoods consistently express less trust in the people in their neighbourhood than those in higher-income neighbourhoods. Markedly, higher trust in higher-income neighbourhoods stands out, relative to the somewhat similarly lower trust observed in lower- and middle-income neighbourhoods.
As for neighbourhood inclusion, long-term residents in lower- and middle-income neighbourhoods are typically less satisfied with feeling part of the community than those in higher-income neighbourhoods. However, there is weaker evidence observed in terms of sense of community belonging. By contrast, lower satisfaction with feeling part of the community captures respondents’ appraisal or valuation of belonging, rather than their feeling of belonging per se. This difference may correct for possible self-selection biases that arise from respondents with potentially lower sense of belonging (e.g., immigrants, renters) frequently living in lower-income neighbourhoods. Moreover, control variables accounting for such factors could explain the weaker evidence observed in terms of sense of community belonging.
Overall, findings support the notion that long-term residency does in fact mitigate the trend of weaker social ties in low-income neighbourhoods, but that differences in social ties by neighbourhood income remain. Despite duration of residency acting as a mitigating factor, weaker social ties—particularly in terms of trust and inclusion—appear to act as another layer of vulnerability for some lower-income neighbourhood residents. Stark differences in housing tenure, dwelling types, household composition and health across neighbourhood income levels underscore this point.
Neighbourhood income is used as an organizational concept that captures an array of local characteristics. Ranging from neighbour characteristics to those of the built environment, neighbourhood income captures variance in residential vicinities that complements respondents’ individual characteristics. Despite existing evidence of socioeconomic differences by neighbourhood income, the magnitude of these differences, particularly with regard to housing, warrants further consideration.
Moving forward, deteriorating housing affordability could widen present gaps between lower- and higher-income neighbourhood residents. Exacerbating current rifts in homeownership between lower- and higher-income neighbourhoods (57% and 96%, respectively) risks replicating socioeconomic gaps across the built environment. A rise in the proportion of renters, given renters’ propensity for short-term residencies, could constitute a drag on the formation of social ties. Beyond housing tenure, changing concentrations of dwelling types (e.g., higher proportion of single-detached dwellings in middle- and higher-income neighbourhoods) continue to redefine the urban landscape and are likely to impact neighbourhood social ties.
This study contributes to a growing literature on the value of neighbourhood-level analyses of social ties. The availability of DA-level estimates is particularly beneficial because it approximates neighbourhood geographies. Future research could seek to further disaggregate how lower-income households in lower-income neighbourhoods compare with lower-income households in higher-income neighbourhoods. This could shed significant light on issues relating to social mobility and income mixing.
Appendix
| Social contact | Trust | Inclusion | ||||||
|---|---|---|---|---|---|---|---|---|
| Don't know any neighbours well enough to ask for a favour | Did a favour for a neighbour or received a favour from a neighbour | Participate in a neighbourhood organization | Say the neighbourhood is a place where neighbours help each other | Say it is very likely a lost wallet would be returned if found by a neighbour | Mean trust in neighbours on a 1 to 5 scale | Report a very strong sense of community belonging | Mean satisfaction with feeling part of the community on a 0 to 10 scale | |
| percent | ||||||||
| Lower-income DAs | ||||||||
| Short-term residents | 37.70 | 50.71 | 11.64 | 46.86 | 36.26 | 3.29 | 25.32 | 6.14 |
| Medium-term residents | 21.55 | 56.29 | 12.85 | 64.97 | 33.44 | 3.20 | 24.7 | 6.34 |
| Long-term residents | 14.97 | 68.46 | 14.34 | 74.25 | 42.29 | 3.42 | 27.03 | 6.86 |
| Total | 23.01 | 59.88 | 12.99 | 64.11 | 37.83 | 3.31 | 25.82 | 6.45 |
| Middle-income DAs | ||||||||
| Short-term residents | 37.27 | 55.84 | 10.90 | 60.45 | 43.02 | 3.29 | 23.08 | 6.39 |
| Medium-term residents | 17.99 | 65.26 | 13.92 | 77.40 | 48.26 | 3.45 | 24.85 | 6.69 |
| Long-term residents | 11.39 | 68.69 | 15.30 | 82.46 | 55.23 | 3.57 | 28.41 | 7.11 |
| Total | 19.07 | 64.84 | 13.87 | 76.07 | 50.47 | 3.47 | 26.18 | 6.81 |
| Higher-income DAs | ||||||||
| Short-term residents | 28.97 | 62.23 | 13.82 | 69.93 | 58.35 | 3.56 | 20.81 | 6.66 |
| Medium-term residents | 12.41 | 70.63 | 17.55 | 83.25 | 57.13 | 3.59 | 25.12 | 7.00 |
| Long-term residents | 7.97 | 71.19 | 16.80 | 85.97 | 66.38 | 3.81 | 31.86 | 7.39 |
| Total | 13.05 | 69.40 | 16.53 | 82.26 | 62.28 | 3.70 | 27.93 | 7.13 |
|
Note: DA - Dissemination area. Sources: Statistics Canada, 2020 General Social Survey, 2018 Canadian Housing Survey and 2016 Census of Population. |
||||||||
| Lower income DAs | Middle income DAs | Higher-income DAs | |||||||
|---|---|---|---|---|---|---|---|---|---|
| Short-term residents | Medium-term residents | Long-term residents | Short-term residents | Medium-term residents | Long-term residents | Short-term residents | Medium-term residents | Long-term residents | |
| dollars | |||||||||
| AEA family income | 38,300 | 38,400 | 39,800 | 56,300 | 57,100 | 57,200 | 63,900 | 71,200 | 81,900 |
| percent | |||||||||
| Housing tenure | |||||||||
| Owned | 26.8 | 35.7 | 57.4 | 52.6 | 73.1 | 86.4 | 67.5 | 85.5 | 95.9 |
| Rented | 73.2 | 64.3 | 42.6 | 47.4 | 26.9 | 13.6 | 32.5 | 14.5 | 4.1 |
| Total | 100.0 | 100.0 | 100.0 | 100.0 | 100.0 | 100.0 | 100.0 | 100.0 | 100.0 |
| Dwelling type | |||||||||
| Single-detached house | 16.7 | 17.2 | 34.7 | 37.9 | 49.1 | 65.5 | 53.4 | 69.8 | 84.4 |
| Semi-detached house, row house or duplex | 18.3 | 22.6 | 22.5 | 24.4 | 26.0 | 19.3 | 23.8 | 16.8 | 10.4 |
| Apartment | 65.0 | 60.3 | 42.8 | 37.7 | 25.0 | 15.2 | 22.9 | 13.4 | 5.2 |
| Total | 100.0 | 100.0 | 100.0 | 100.0 | 100.0 | 100.0 | 100.0 | 100.0 | 100.0 |
| Age group | |||||||||
| 15 to 19 | 4.2 | 5.2 | 5.4 | 8.7 | 6.4 | 6.8 | 6.2 | 8.7 | 7.9 |
| 20 to 34 | 52.3 | 31.6 | 16.2 | 47.4 | 30.0 | 14.0 | 45.8 | 25.8 | 13.7 |
| 35 to 49 | 26.8 | 33.4 | 16.6 | 24.4 | 34.9 | 19.1 | 24.3 | 38.0 | 16.4 |
| 50 to 64 | 9.1 | 19.3 | 29.7 | 12.3 | 17.9 | 30.7 | 14.6 | 18.1 | 33.9 |
| 65 or older | 7.7 | 10.4 | 32.2 | 7.2 | 10.9 | 29.5 | 9.1 | 9.4 | 28.2 |
| Total | 100.0 | 100.0 | 100.0 | 100.0 | 100.0 | 100.0 | 100.0 | 100.0 | 100.0 |
| Sex | |||||||||
| Men | 56.1 | 49.1 | 44.5 | 50.3 | 48.6 | 51.0 | 47.0 | 52.1 | 50.7 |
| Women | 43.9 | 50.9 | 55.5 | 49.7 | 51.4 | 49.0 | 53.0 | 47.9 | 49.3 |
| Total | 100.0 | 100.0 | 100.0 | 100.0 | 100.0 | 100.0 | 100.0 | 100.0 | 100.0 |
| Household composition | |||||||||
| Reside alone | 20.5 | 21.5 | 26.0 | 14.0 | 13.6 | 15.6 | 9.1 | 7.8 | 10.3 |
| Single parent | 7.3 | 7.7 | 7.4 | 3.5 | 6.2 | 6.8 | 3.8 | 3.6 | 5.7 |
| Couple with children | 19.8 | 30.8 | 21.9 | 28.1 | 38.8 | 30.0 | 32.5 | 45.0 | 33.3 |
| Couple with no children | 27.8 | 20.0 | 22.5 | 28.7 | 22.5 | 25.8 | 36.9 | 19.8 | 27.2 |
| Other | 24.7 | 19.9 | 22.3 | 25.7 | 19.0 | 21.9 | 17.7 | 23.8 | 23.5 |
| Total | 100.0 | 100.0 | 100.0 | 100.0 | 100.0 | 100.0 | 100.0 | 100.0 | 100.0 |
| Education | |||||||||
| High school diploma or less | 27.4 | 35.5 | 41.7 | 28.3 | 30.7 | 37.8 | 23.0 | 24.5 | 29.9 |
| Non-university postsecondary | 26.1 | 28.7 | 30.5 | 28.0 | 29.8 | 34.4 | 23.6 | 29.1 | 30.3 |
| University degree | 46.5 | 35.9 | 27.8 | 43.7 | 39.5 | 27.8 | 53.4 | 46.4 | 39.8 |
| Total | 100.0 | 100.0 | 100.0 | 100.0 | 100.0 | 100.0 | 100.0 | 100.0 | 100.0 |
| General health status | |||||||||
| Fair or poor | 9.2 | 18.1 | 16.5 | 11.9 | 10.8 | 11.9 | 8.4 | 8.6 | 8.8 |
| Good | 28.5 | 29.1 | 34.4 | 28.9 | 33.2 | 32.5 | 28.4 | 29.0 | 27.9 |
| Very good or excellent | 62.3 | 52.9 | 49.2 | 59.3 | 56.0 | 55.6 | 63.2 | 62.4 | 63.3 |
| Total | 100.0 | 100.0 | 100.0 | 100.0 | 100.0 | 100.0 | 100.0 | 100.0 | 100.0 |
| Mental health status | |||||||||
| Fair or poor | 15.1 | 19.2 | 12.1 | 15.5 | 14.7 | 11.6 | 14.2 | 12.0 | 11.3 |
| Good | 25.8 | 20.7 | 25.7 | 24.7 | 24.7 | 22.4 | 27.2 | 26.9 | 21.7 |
| Very good or excellent | 59.1 | 60.1 | 62.2 | 59.8 | 60.6 | 65.9 | 58.6 | 61.1 | 67.1 |
| Total | 100.0 | 100.0 | 100.0 | 100.0 | 100.0 | 100.0 | 100.0 | 100.0 | 100.0 |
| Immigrant status | |||||||||
| Born in Canada | 57.6 | 56.0 | 68.4 | 59.0 | 60.3 | 74.4 | 62.0 | 63.1 | 76.7 |
| Recent immigrant | 27.3 | 18.1 | Note x: suppressed to meet the confidentiality requirements of the Statistics Act | 21.1 | 14.0 | Note x: suppressed to meet the confidentiality requirements of the Statistics Act | 17.8 | 13.8 | Note x: suppressed to meet the confidentiality requirements of the Statistics Act |
| Established immigrant | 15.1 | 26.0 | Note x: suppressed to meet the confidentiality requirements of the Statistics Act | 19.9 | 25.6 | Note x: suppressed to meet the confidentiality requirements of the Statistics Act | 20.3 | 23.1 | Note x: suppressed to meet the confidentiality requirements of the Statistics Act |
| Total | 100.0 | 100.0 | 100.0 | 100.0 | 100.0 | 100.0 | 100.0 | 100.0 | 100.0 |
| Population group | |||||||||
| South Asian | 9.7 | 12.5 | 8.9 | 12.4 | 12.9 | 5.8 | 8.4 | 7.3 | 3.3 |
| Chinese | 5.6 | 8.3 | 6.9 | 8.2 | 8.1 | 5.5 | 8.7 | 8.1 | 5.0 |
| Black | 9.5 | 8.9 | 8.2 | 6.2 | 4.0 | 2.8 | Note x: suppressed to meet the confidentiality requirements of the Statistics Act | Note x: suppressed to meet the confidentiality requirements of the Statistics Act | 1.5 |
| Arab | 4.5 | 4.0 | 2.7 | 3.3 | 3.3 | 1.6 | Note x: suppressed to meet the confidentiality requirements of the Statistics Act | 3.0 | 1.5 |
| Latin American | 3.1 | 2.6 | 1.2 | 3.3 | 2.5 | 1.3 | Note x: suppressed to meet the confidentiality requirements of the Statistics Act | 2.9 | 0.8 |
| Southeast Asian | Note x: suppressed to meet the confidentiality requirements of the Statistics Act | 1.4 | 1.2 | Note x: suppressed to meet the confidentiality requirements of the Statistics Act | 2.1 | 1.0 | Note x: suppressed to meet the confidentiality requirements of the Statistics Act | 1.2 | 0.8 |
| West Asian | Note x: suppressed to meet the confidentiality requirements of the Statistics Act | 1.5 | 0.4 | Note x: suppressed to meet the confidentiality requirements of the Statistics Act | 1.2 | 0.6 | Note x: suppressed to meet the confidentiality requirements of the Statistics Act | Note x: suppressed to meet the confidentiality requirements of the Statistics Act | 0.6 |
| Other | 8.5 | 8.5 | 5.2 | 8.8 | 7.3 | 5.0 | 4.2 | 5.4 | 2.9 |
| White | 54.7 | 52.4 | 65.3 | 55.4 | 58.7 | 76.4 | 68.5 | 68.9 | 83.6 |
| Total | 100.0 | 100.0 | 100.0 | 100.0 | 100.0 | 100.0 | 100.0 | 100.0 | 100.0 |
| Discrimination 1 | |||||||||
| No | 72.4 | 74.5 | 77.0 | 65.4 | 70.9 | 74.7 | 72.5 | 71.4 | 77.2 |
| Yes | 27.6 | 25.5 | 23.0 | 34.6 | 29.1 | 25.4 | 27.6 | 28.6 | 22.8 |
| Total | 100.0 | 100.0 | 100.0 | 100.0 | 100.0 | 100.0 | 100.0 | 100.0 | 100.0 |
| Discrimination 2 | |||||||||
| No | 70.0 | 71.6 | 78.9 | 71.3 | 70.9 | 81.9 | 80.9 | 76.2 | 86.5 |
| Yes | 30.0 | 28.4 | 21.1 | 28.7 | 29.1 | 18.1 | 19.1 | 23.8 | 13.5 |
| Total | 100.0 | 100.0 | 100.0 | 100.0 | 100.0 | 100.0 | 100.0 | 100.0 | 100.0 |
|
x suppressed to meet the confidentiality requirements of the Statistics Act Notes: DA - Dissemination area; AEA - Adult equivalent adjusted. Discrimination 1: Discrimination or unfair treatment on the basis of sex, age, physical appearance, disability, gender identity, sexual orientation or other reasons. Discrimination 2: Discrimination or unfair treatment on the basis of race or colour, ethnicity or culture, language, or religion. Sources: Statistics Canada, 2020 General Social Survey, 2018 Canadian Community Health Survey and 2016 Census of Population. |
|||||||||
References
Beaumont, J.-F., Bocci, C., Fonberg, J., & Schellenberg, G. (2021). Measuring social capital at the neighbourhood level: Experimental estimates of sense of belonging to the local community measured at the census tract level. Analytical Studies — Methods and References. Statistics Canada.
Campbell, K. E., & Lee, B. A. (1992). Sources of personal neighbor networks: Social integration, need, or time? Social forces. 70(4), 1077-1100.
Carpiano, R. M. (2006). Toward a neighborhood resource-based theory of social capital for health: can Bourdieu and sociology help? Social Science & Medicine. 62(1), 165-175.
Chastko, Karl (2021). Internal migration: Overview 2016/2017 to 2018/2019. Report on the Demographic Situation in Canada, Statistics Canada. Catalogue no. 91-209-X.
Clark, W. A., Duque‐Calvache, R., & Palomares‐Linares, I. (2015). Place attachment and the decision to stay in the neighbourhood. Population, Space and Place. 23(2).
Cornwell, E.Y. & Goldman, A.W. (2021). Local ties in the social networks of older adults. Journals of Gerontology: Social Sciences. 76(4), 790-800.
Dinesen, P.T., Schaeffer, M. and Mannemar Sønderskov K. (2020). Ethnic diversity and social trust: A narrative and meta-analytical review. Annual Review of Political Science. 23(1), 441-465.
DiPasquale, D., & Glaeser, E. L. (1999). Incentives and social capital: Are homeowners better citizens? Journal of Urban Economics. 45(2), 354-384.
Gault, M., & Silver, E. (2008). Spuriousness or mediation? Broken windows according to Sampson and Raudenbush (1999). Journal of Criminal Justice. 36(3), 240-243.
Hilber, C.A.L. (2010). New housing supply and the dilution of social capital. Journal of Urban Economics. 67(3), 419-437.
Kasarda, J. D., & Janowitz, M. (1974). Community attachment in mass society. American Sociological Review. 39(3), 328-339.
Mair, C. A. (2019). Alternatives to aging alone?: “Kinlessness” and the importance of friends across European contexts. The Journals of Gerontology, Series B: Psychological Sciences and Social Sciences. 74(8), 1416-1428.
Mazumdar, S., Learnihan, V., Cochrane, T., & Davey, R. (2017). The built environment and social capital: A systematic review. Environment and Behavior. 50(2), 119-158.
McNeish, D., Stapleton, L. M., & Silverman, R. D. (2017). On the unnecessary ubiquity of hierarchical linear modeling. Psychological Methods. 22(1), 114-140.
Mesch, G. S., & Manor, O. (2001). Ethnic differences in urban neighbour relations in Israel. Urban Studies. 38(11), 1943-1952.
Myles, J., & Hou, F. (2003). Neighbourhood attainment and residential segregation among Toronto’s visible minorities. Statistics Canada, Analytical Studies Branch Research Paper Series.
Park, R. E. (1936). Succession: An ecological concept. American Sociological Review. 1(2), 171-179.
Putnam, R.D. (2007). E pluribus unum: Diversity and community in the twenty-first century. The 2006 Johan Skytte prize lecture. Scandinavian Political Studies. 30(2),137-174.
Rankin, B.H., & Quane, J.M. (2000). Neighborhood poverty and the social isolation of inner-city African American families. Social Forces. 79(1), 139-164.
Sampson, R. J. (1988). Local friendship ties and community attachment in mass society: A multilevel systemic model. American Sociological Review. 53(5), 766-779.
Schellenberg, G., Lu, C., Schimmele, C., & Hou, F. (2018). The correlates of self-assessed community belonging in Canada: Social capital, neighbourhood characteristics, and rootedness. Social Indicators Research. 140(2), 597-618.
Small, M. L. (2007). Racial differences in networks: Do neighborhood conditions matter? Social Science Quarterly. 88(2), 320-343.
Small, M. L., & Adler, L. (2019). The role of space in the formation of social ties. Annual Review of Sociology. 45, 111-132.
Statistics Canada (2017). Illustrated Glossary. Catalogue no. 92-195-X.
Statistics Canada (2022a). Census in brief: Disaggregated trends in poverty from the 2021 census of population. Cat. # 98-200-X, Issue 2021009 (November 9).
Statistics Canada (2022b). Estimates of the components of interprovincial migration, by age and sex, annual. Table 17-10-0015-01.
Tigges, L. M., Browne, I., & Green, G. P. (1998). Social isolation of the urban poor: Race, class, and neighborhood effects on social resources. Sociological Quarterly. 39(1), 53-77.
Turcotte, M. (2005). Social engagement and civic participation: Are rural and small town populations really at an advantage? Rural and Small Town Canada Analysis Bulletin. 6(4), 1-24.
van der Meer, T., & Tolsma, J. (2014). Ethnic diversity and its effect on social cohesion. Annual Review of Sociology. 40, 459-478.
Wirth, L. (1938). Urbanism as a way of life. American Journal of Sociology. 44(1), 1-24.
- Date modified: