
Analytical Studies Branch Research Paper Series
Who are the Men and Women Entering Business Ownership in Canada?
Skip to text
Text begins
Acknowledgements
This study is funded by Women and Gender Equality Canada (WAGE). The authors would like to thank reviewers from WAGE, Innovation, Science and Economic Development Canada, colleagues at Statistics Canada, Marc Duhamel and Joao da Fonseca for valuable comments.
Abstract
This study analyzes the determinants of entry into business ownership (defined as ownership of private incorporated businesses). Entrants into business ownership are defined as individuals who were primarily business owners in 2016, but not in 2015. An individual can become an entrant by starting an enterprise or acquiring shares of an existing private enterprise. Using a matched employer–employee database over the 2011-to-2016 period for approximately 24 million individuals, this study assesses the role of factors including personal characteristics, labour market experience and family characteristics. The descriptive statistics show that entrants were more likely than non-business owners to have experience in more than one industry, to be the owner of an unincorporated business in 2015, and to have a spouse who is the owner of a business (unincorporated or incorporated) in 2015. Female entrants were more likely than their male counterparts to have suffered from a major negative income shock during the 2011-to-2015 period, but were less likely to have experience in the goods-producing sector. The regression-based analysis indicates that these factors have a strong influence on entry, especially the factor of having a spouse who is a business owner. Although women and men were influenced by almost the same factors, statistically significant gender differences were found for all variables and showed that men tended to enter business ownership proportionately more than women. This study’s findings are relevant in the context of the COVID-19 pandemic since the pandemic has generated shocks that echo factors analyzed in the paper. For example, individuals who were without employment in 2015 or who had suffered from a major negative income shock tended to pursue entry into business ownership. Men were attracted to men-owned enterprises, and women were attracted to women-owned enterprises and equally owned enterprises.
Keywords: entrepreneurship, business ownership, entry, gender, men-owned enterprises, women-owned enterprises, equally owned enterprises
Executive summary
Understanding the factors that influence an individual’s decision to become a business owner has received considerable attention in the literature. Studies have discussed several factors, such as individual-specific factors, environmental factors and life events that could motivate or compel individuals to become business owners. Although gender issues have been discussed, the literature is silent about the factors that influence individuals to enter women-owned enterprises (WOE), men-owned enterprises (MOE) or equally owned enterprises (EOE).
This paper fills this gap by using the Canadian Employer–Employee Dynamics Database (CEEDD) over the 2011-to-2016 period to analyze entrepreneurship through the lens of incorporated business ownership, which is defined as ownership of private incorporated businesses, captured through an administrative tax schedule (T2 Schedule 50). An individual is identified as a business owner if business ownership is their primary employment activity (i.e., they generate most of their income from business ownership). Entrants into business ownership are identified as individuals who were business owners in 2016, but not in 2015.
This paper starts by comparing, for women and men, the socio-economic characteristics of entrants, business owners already in activity and non-business owners over the 2011-to-2016 period. The results suggest that the labour market experience of entrants differed from that of non-business owners. Entrants were more likely than non-business owners to have been owners of an unincorporated business in 2015, and to have experience in more than one industry over the 2011-to-2015 period (80% versus 50%).
Entrants were more likely than non-business owners to be immigrants, to have a spouse who was a business owner (unincorporated or incorporated) in 2015, and to have children younger than age 7. Entrants had also accumulated more family income than non-business owners over the 2011-to-2015 period (where “family” is the census family concept).
Female entrants were more likely than their male counterparts to have suffered from a major negative income shock (at least a 10% shock) during the 2011-to-2015 period, and to have been unemployed in 2015, but were less likely to have experience in the goods-producing sector. They had a lower cumulative personal income over the 2011-to-2015 period, but a higher cumulative family income, which could be explained by the fact that women were relatively more likely than men to be married or in a common-law relationship. Male entrants were concentrated in MOE, while the distribution of female entrants was more balanced across all types of enterprises.
The regression-based analysis (logit and multinomial logit models) shows that women and men were influenced by almost the same factors. However, women’s probability to enter business ownership represented 53% of men’s. In other words, women were about two times less likely than men to enter business ownership. Despite similarities in the sign of the marginal effects, statistically significant gender differences in favour of men were found for all variables. For example, women with experience in the goods-producing sector were about two times less likely than their male counterparts to enter business ownership. Furthermore, although female entrants were proportionately more likely to have a spouse who is a business owner, the probability of entry for a woman whose spouse was a business owner was 2.34 percentage points (pp) lower than that of a man whose spouse was a business owner.
When the role of spouses in an individual’s decision to enter business ownership was assessed, having a spouse who was a business owner in 2015 had the highest marginal effect on entry (3.4 pp compared with those who did not have a spouse).
The findings from the regression-based analysis are relevant in the context of recovering from the COVID-19 pandemic. Indeed, this pandemic has generated shocks that echo the factors analyzed in this paper. For example, individuals without employment in 2015 were more likely to enter business ownership than paid employees. Similarly, having suffered from a major negative income shock, being a caregiver, being a recent immigrant, and being widowed, divorced or separated tended to push individuals toward business ownership. Interestingly, these factors tended to attract men to MOE and women to WOE and EOE. Having young children tended to attract men to MOE and EOE, and women to WOE and EOE. However, this paper found that having a disability or living in a rural area was associated with not entering business ownership. Family income and experience in the goods-producing sector pulled women toward MOE or EOE, while having a spouse tended to attract both women and men to EOE, regardless of the spouse’s employment status (except for men, who tended to enter MOE when their spouse was a business owner).
This paper makes four important contributions that are relevant for policymaking. First, it offers a detailed socio-economic profile of entrants, other business owners and non-business owners, which provides information on key gender differences within and between these groups. Second, the regression-based analysis (logit models) provides an understanding of the factors that influence an individual’s decision to enter business ownership, as well as a contrast of their importance across gender. Third, the regression-based analysis (multinomial logit models) investigates how these factors influence entry in MOE, WOE or EOE for women and men. Factors that could potentially explain performance gaps between these types of enterprises are highlighted. Finally, the findings are relevant in the context of recovering from the COVID-19 pandemic, which has generated shocks that echo the factors analyzed in the paper (e.g., non-employment and major negative income shock).
1 Introduction
Entrepreneurship is important for job creation, innovation, economic growth and the competitiveness of countries (Conway, Janod and Nicoletti 2005). Therefore, understanding the factors that influence an individual’s decision to become an entrepreneur has received considerable attention in the literature.Note The literature has discussed individual-specific factors (e.g., motivation, skill and all forms of capital), environmental factors (e.g., access to financing, institutional environment, political stability) and life events (e.g., recent maternity) that can affect an individual’s decision to become an entrepreneur.Note
This paper analyzes entrepreneurship through the lens of incorporated self-employment (business ownership), which is typically larger, employs more people, uses more capital per worker, and has much higher output per worker than unincorporated enterprises (Baldwin and Rispoli 2010; Baldwin, Leung and Rispoli 2011).Note This paper investigates gender issues through three broad questions. First, what are the characteristics of entrants into business ownership, and how do these entrants compare with other Canadians? Second, what are the factors correlated with entering business ownership in Canada? Third, do factors lead to entry into men-owned enterprises (MOE), women-owned enterprises (WOE) or equally owned enterprises (EOE)?Note
The interest in gender issues among business owners is not new. For example, in her review of the literature, Brush (1992) suggested that male and female business owners had similar demographics in terms of marital status, age and family background, and business characteristics. However, they presented differences in terms of entry determinants, such as education, work experience and performance. Goyal and Yadav (2014) showed that the challenges faced by women entrepreneurs in developing countries include access to financing, socio-cultural biases against women, low self-esteem, institutional voids, and a lack of skills and entrepreneurial education. The literature also shows that minority business owners faced greater challenges in accessing market and financial resources (Brush 1992; De Groot 2001). Furthermore, Hebert (forthcoming) found that female-founded startups in France were less likely to raise external equity in general, but were more likely to raise capital in female-dominated sectors. She also showed that, conditional on being backed with equity, female-led startups in male-dominated sectors and male-led startups in female-dominated sectors outperformed their counterparts led by entrepreneurs in the sector’s dominant group. Using Canadian data, Grekou (2020) found that male entrants into business ownership seemed to have more pertinent labour market experience than their female counterparts, and that this trait was positively correlated with revenues and the number of employees of the owned enterprise.
A limitation of the literature on entry into entrepreneurship is the lack of understanding of factors that influence entry into WOE, MOE or EOE. To the authors’ knowledge, this question has never been studied. Given the important business performance gaps that have been observed between these types of enterprises, frequently to WOE’s disadvantage, understanding factors that influence entry into these types of enterprises is relevant.Note Indeed, factors that could potentially explain these performance gaps might trace back to the entry determinants of entrepreneurship.Note
This paper contributes to the understanding of gender issues surrounding transitions into business ownership in Canada. It studies the factors that favoured or impeded entry into business ownership in 2016. It relies on a large Statistics Canada matched employer–employee administrative database, the Canadian Employer–Employee Dynamics Database (CEEDD), over the 2011-to-2016 period. The CEEDD presents many advantages for this paper. First, it allows for the identification of both business owners and entrants, as well as non-business owners. Second, it offers a rich set of information, including personal characteristics (e.g., age, immigrant status), labour experience (e.g., job status, experience in a given industry) and family characteristics (e.g., family income, number of children, spouse’s labour status) for all individuals. Third, it allows for the identification of enterprise types (i.e., MOE, WOE or EOE) and important enterprise features, such as industry.
This paper makes four important contributions that are relevant for policymaking. First, it offers a detailed socio-economic profile of entrants, other business owners and non-business owners, which provides information on key gender differences within and between these groups. Second, it provides an understanding of the factors that influence an individual’s decision to enter business ownership. Specifically, the analysis of logit models discusses human capital, financial capital and social capital, along with socio-demographic factors, and contrasts their importance across gender. Third, using multinomial logit models, this paper also investigates how factors influence entry in MOE, WOE or EOE for women and men. Factors that could potentially explain performance gaps between these types of enterprises are highlighted. Finally, the findings are relevant in the context of recovery from the COVID-19 pandemic. Indeed, the pandemic has generated shocks that echo the factors analyzed in this paper (e.g., non-employment and major negative income shock).
The paper is organized as follows. The next section presents the data and definitions. Section 3 compares the characteristics of entrants, incumbent business owners and non-business owners prior to 2016. Section 4 presents the analytical results. Section 5 concludes.
2 Data and definitions
2.1 Data
A detailed description of the data can be found in Grekou (2020). The present paper builds on Statistics Canada’s CEEDD, which provides information on the individuals, their family, and the businesses they own or work for. Specifically, it contains detailed information about paid workers and business owners, such as age, gender, marital status, immigrant status, earnings from paid jobs, self-employment income, earnings from owned corporations, spousal employment status, spousal income, and number of children by age group. This information is augmented with information on the sector of activity of their workplace.
This paper uses the CEEDD to gather information on entry into business ownership in 2016, and information on entrants and non-entrants from 2011 to 2015. It also uses the Longitudinal Immigration Database, which contains information from 1980 to present.
The analysis file is restricted to individuals aged 18 to 80.Note Business owners whose enterprise’s activity is in the public sector are removed.Note These restrictions leave 25,535,000 individuals for analysis.
2.2 Defining entry into business ownership
The definition of entry into business ownership follows the definition used in the study by Grekou and Liu (2018). Specifically, the universe of business owners is restricted to individuals listed in Schedule 50 of a T2 tax return whose employment status generating the highest income (i.e., their primary activity) is business ownership.Note Business owners in this paper are therefore defined as private incorporated business owners with at least 10% share, whose business ownership activity is their primary activity. Furthermore, entrants into business ownership are defined as individuals who were business owners in 2016, but not in 2015.
Important clarifications are necessary. First, this paper considers primary employment status only. The possible employment statuses in the CEEDD are business ownership, self-employment (i.e., unincorporated business owners), paid employment (identified with a T4 form), and non-employment (if not identified in any of the other three categories). Hence, in this paper, individuals who own an incorporated business but derive most of their income from self-employment or paid employment are not considered business owners. This intends to restrict the focus to true business owners since the CEEDD is a large administrative database, not a dedicated database on business owners.Note However, this restriction makes entry into business ownership more restrictive. Second, in the CEEDD, individuals can become business owners by starting a new enterprise or by buying shares in an existing enterprise.Note
This paper also explores whether the importance of determinants of entry changes with the gender ownership type of enterprises. The latter is defined as in Grekou, Li and Liu (2018). Essentially, if the shares owned by women (men) are greater than or equal to 51%, the enterprise is considered as women-owned (men-owned); if women and men own 50% of the shares, the enterprise is considered equally owned.
The variables used in the paper are described in detail in Table A.1 in the Appendix.
3 Descriptive statistics
Descriptive statistics are presented in Table 1, which has three panels that explain differences pertaining to business ownership in the Canadian population. The first panel shows the entrants into business ownership in 2016 (i.e., the individuals of interest for this paper). The second panel shows the individuals who were already business owners in 2015 (incumbents). The third panel shows the individuals who were not business owners in 2016. The distinction between the three groups is important to make appropriate comparisons when the regression analysis is implemented. Totals by gender are presented in Table A.2 of the Appendix. For each variable in Table 1, all the differences within and across panels are statistically different except those reported in Table A.3. To keep the discussion concise, this section focuses on entrants.
In 2016, there were 207,000 entrants, 1,413,000 incumbents and 23,915,000 non-business owners.Note Men were more prevalent than women among entrants and incumbents, accounting for more than 60% of these categories. Women accounted for 53% of non-business owners.
| Themes, statistics or categories | Entrants | Incumbents | Non-business owners | |||
|---|---|---|---|---|---|---|
| Men | Women | Men | Women | Men | Women | |
| number | ||||||
| Sample (number of individuals) | 129,000 | 78,000 | 902,000 | 511,000 | 11,446,000 | 12,469,000 |
| Age (mean) | 45 | 45 | 52 | 52 | 46 | 47 |
| percent | ||||||
| Immigration | ||||||
| Immigrants | 30.3 | 27.8 | 19.2 | 18.3 | 19.1 | 20.2 |
| Recent immigrants | 7.8 | 6.1 | 1.8 | 1.6 | 4.2 | 4.5 |
| Marital status | ||||||
| Married or common law | 72.1 | 77.1 | 81.5 | 81.6 | 57.5 | 56.1 |
| Single | 20.3 | 13.6 | 10.2 | 8.3 | 34.1 | 28.9 |
| Widowed, divorced or separated | 7.6 | 9.2 | 8.2 | 10.1 | 8.3 | 14.9 |
| Unstated | 0.1 | 0.1 | 0.0 | 0.0 | 0.1 | 0.1 |
| Miscellaneous individual characteristics | ||||||
| Live in rural areas | 15.7 | 15.9 | 18.9 | 18.5 | 17.1 | 16.1 |
| Disability | 0.6 | 0.8 | 0.9 | 1.1 | 2.8 | 2.5 |
| Caregivers | 2.4 | 2.0 | 2.8 | 2.0 | 1.7 | 1.5 |
| Attended eligible education programs | 18.3 | 22.0 | 8.2 | 12.6 | 18.0 | 21.6 |
| 2006 constant dollars | ||||||
| Personal income, 2011 to 2015 | ||||||
| Mean of the sum | 394,000 | 266,000 | 573,000 | 398,000 | 237,000 | 162,000 |
| Median of the sum | 231,000 | 180,000 | 336,000 | 274,000 | 177,000 | 120,000 |
| Family income, 2011 to 2015 | ||||||
| Mean of the sum | 478,000 | 534,000 | 641,000 | 692,000 | 331,000 | 323,000 |
| Median of the sum | 342,000 | 392,000 | 451,000 | 496,000 | 279,000 | 263,000 |
| percent | ||||||
| Suffered from negative income shock (>=10%) | 0.5 | 7.6 | 0.2 | 4.2 | 0.4 | 5.6 |
| 2006 constant dollars | ||||||
| Indicator of saving capacity, 2011 to 2015, RPP or RRSP | ||||||
| Mean | 34,000 | 30,000 | 43,000 | 37,000 | 26,000 | 21,000 |
| Median | 20,000 | 18,000 | 27,000 | 23,000 | 16,000 | 12,000 |
| percent | ||||||
| Contributed to RPP or RRSP | 51.3 | 51.7 | 58.4 | 56.5 | 45.3 | 42.7 |
| Primary occupation in 2015 | ||||||
| Business owner | 0.0 | 0.0 | 100.0 | 100.0 | 0.7 | 0.4 |
| Self-employed | 37.5 | 35.2 | 0.0 | 0.0 | 9.0 | 7.6 |
| Employee | 41.8 | 43.1 | 0.0 | 0.0 | 63.8 | 59.9 |
| Non-employed | 4.2 | 9.0 | 0.0 | 0.0 | 20.3 | 27.4 |
| Missing | 16.5 | 12.8 | 0.0 | 0.0 | 6.2 | 4.7 |
| Industry experience over 2011 to 2015 | ||||||
| Experience in at least two industries (NAICS 2) | 82.8 | 77.3 | 93.0 | 90.1 | 55.8 | 50.2 |
| Experience in goods-producing sector only | 10.4 | 3.5 | 11.9 | 5.8 | 12.3 | 3.1 |
| Experience in services sector only | 53.8 | 68.8 | 57.9 | 69.0 | 49.4 | 65.8 |
| Experience in goods-producing and services sectors | 32.6 | 21.6 | 29.4 | 24.1 | 22.7 | 9.9 |
| Unknown | 3.2 | 6.0 | 0.7 | 1.2 | 15.6 | 21.1 |
| Spouse's primary occupation in 2015 | ||||||
| Business owner | 10.3 | 23.6 | 33.8 | 59.5 | 1.1 | 3.7 |
| Self-employed | 11.9 | 16.1 | 6.0 | 5.5 | 5.0 | 5.9 |
| Employee | 31.3 | 24.9 | 32.1 | 12.5 | 32.4 | 32.2 |
| Non-employed | 8.2 | 3.1 | 7.6 | 2.3 | 15.0 | 11.1 |
| Not applicable (no spouse) | 28.0 | 22.9 | 18.4 | 18.4 | 42.5 | 43.9 |
| Missing | 10.3 | 9.4 | 2.1 | 1.7 | 4.0 | 3.1 |
| Age group of children, as available in the data | ||||||
| No children younger than 16 years old | 97.1 | 93.7 | 97.9 | 96.0 | 98.5 | 95.8 |
| Had children younger than 7 years old only | 1.7 | 3.6 | 1.3 | 2.3 | 1.0 | 2.7 |
| Had children aged 7 to 16 only | 1.0 | 2.3 | 0.7 | 1.5 | 0.5 | 1.4 |
| Had children younger than 7 years old and children aged 7 to 16 | 0.1 | 0.4 | 0.1 | 0.3 | 0.0 | 0.2 |
| Gender ownership | ||||||
| Men-owned | 79.0 | 23.1 | 78.6 | 25.9 | Note ...: not applicable | Note ...: not applicable |
| Women-owned | 4.1 | 44.2 | 3.4 | 39.6 | Note ...: not applicable | Note ...: not applicable |
| Equally owned | 17.0 | 32.7 | 18.0 | 34.4 | Note ...: not applicable | Note ...: not applicable |
|
… not applicable Note: See Table A.1 in the Appendix for variables definitions. Incumbents are the individuals who were already business owners in 2015. Percentages for themes may not add up to 100.0% because of rounding. Negative income shock indicates a loss of at least 10% of family income from one year to the other at any time between 2011 and 2015; RPP: Registered Pension Plan; RRSP: Registered Retirement Savings Plan; NAICS 2: two-digit industry level of the North American Industry Classification System; sectors are groupings of industries. For each variable, all the differences within and across panels are statistically different except those reported in Table A.3 in the Appendix. Source: Statistics Canada, authors’ calculations based on data from the Canadian Employer–Employee Dynamics Database, 2011 to 2016. |
||||||
3.1 Social characteristics
Entrants were younger, and there was a proportionately larger share (about one-third) of immigrants among them compared with incumbents and non-business owners (about one-fifth for each category). Unlike what was observed for non-business owners, male entrants and incumbents were slightly more likely than female entrants to be immigrants. Also, compared with non-business owners, the share of recent immigrants was proportionately higher among entrants and lower among incumbents.
Entrants and incumbents were proportionately more likely to be married or in a common-law relationship than non-business owners (over 70% versus approximately 56%). Female entrants were more likely than their male counterparts to be married or in a common-law relationship, whereas the shares were similar across gender in the other categories. Across all categories, men were proportionately more likely than women to be single.
The shares of individuals living in rural areas were similar across all categories (within a 15% to 19% range).
Although education level is not available in CEEDD, a flag can be derived from tax forms to determine whether an individual attended an eligible full-time or part-time education program (see Table A.1 for details). The share of individuals who attended such education programs between 2011 and 2015 was the highest among entrants (18.2% and 22.0% for men and women, respectively). Across all categories, women were more likely to have attended such educational programs.
The prevalence of individuals with a disability was below 1% among entrants. The share of caregivers was proportionately higher among incumbents and entrants. Across all categories, the proportion of individuals who were caregivers was higher among men.
3.2 Income and savings capacity
Financial constraints are important for the life of a business (see Evans and Jovanovic [1989]; Leung, Ostrovsky and Picot [2018] for Canada; and Buera, Kaboski and Shin [2015] for an in-depth review). Myers and Majluf (1984) proposed a pecking order theory of finance, where internal and personal funds were the first level of finance chosen by business owners, followed by debt and external equity financing.
The CEEDD allows for the examination of individuals’ personal and family income, and crude indicators of savings capacity, which are all key contributors to the first level of finance. On average, incumbents had the highest level of cumulative own or family income over five years, followed by entrants. For example, entrants’ mean own income was about 1.7 times as high as that of their non-business-owner counterparts. Across all categories, men’s own cumulative income exceeded that of women; women’s income accounted for about 70% of that of men. Interestingly, women’s cumulative family income was higher than that of their male counterparts among entrants and incumbents, but not for non-business owners. This result was described in Grekou (2020).
Although savings are not observable in the CEEDD, a crude indicator of savings capacity can be derived by examining whether individuals made contributions to a Registered Pension Plan or Registered Retirement Savings Plan. Business owners were proportionately more likely to accumulate such savings than non-business owners. Incumbents had the highest levels of savings, followed by entrants ($34,000 and $30,000 for men and women, respectively).
The fact that men seemed to have a higher savings capacity is important since savings will likely represent an important share of the initial investment in a firm. Paulson and Townsend (2004), for instance, showed that in both the United States and Thailand, savings from family and friends represented about two-thirds of the initial investment in small firms.
The proportion of the population that experienced a 10% negative income shock (defined as a decrease of at least 10% in family income on a year-to-year basis from 2011 to 2015) was substantially higher among women across all categories.Note Women were therefore more likely than men to have suffered from a significant income shock.
3.3 Labour market experience
The CEEDD provides detailed employment status information on the years preceding entry. In Table 1, employment status in 2015 is organized into mutually exclusive categories: primarily business owners, primarily self-employed, primarily employed, non-employed, and missing.Note Consistent with findings from Grekou and Liu (2018), entrants into business ownership tended to be primarily employees (more than 40% of the entrants) or self-employed (slightly more than one-third of the entrants) in the year preceding entry.Unsurprisingly, the individuals who were primarily employed in the previous year accounted for the highest share of non-business owners (about 60%).
Interestingly, the vast majority of incumbents (more than 90%) and entrants (about 80%) had experience in more than one industry at the two-digit industry level of the North American Industry Classification System (NAICS 2) between 2011 and 2015. This is proportionately higher than what was observed for non-business owners (about 50%), and aligns with Lazear (2005), who found that individuals with experience in at least two industries were more likely to enter business ownership. Across all categories, men had a more diversified experience.
Looking at sectoral experience (i.e., NAICS 2 groupings), individuals with experience in the services sector were the most prevalent (49% to 58% for men, 66% to 69% for women), followed by individuals with combined experience in goods and services sectors (23% to 33% for men, 10% to 24% for women).Note It can also be noted that, across all categories, men were proportionately more likely than women to have experience that involved goods producing. The ratio of men with experience in the goods-producing industries to their female counterparts was 1.71 for entrants (43% versus 25%).
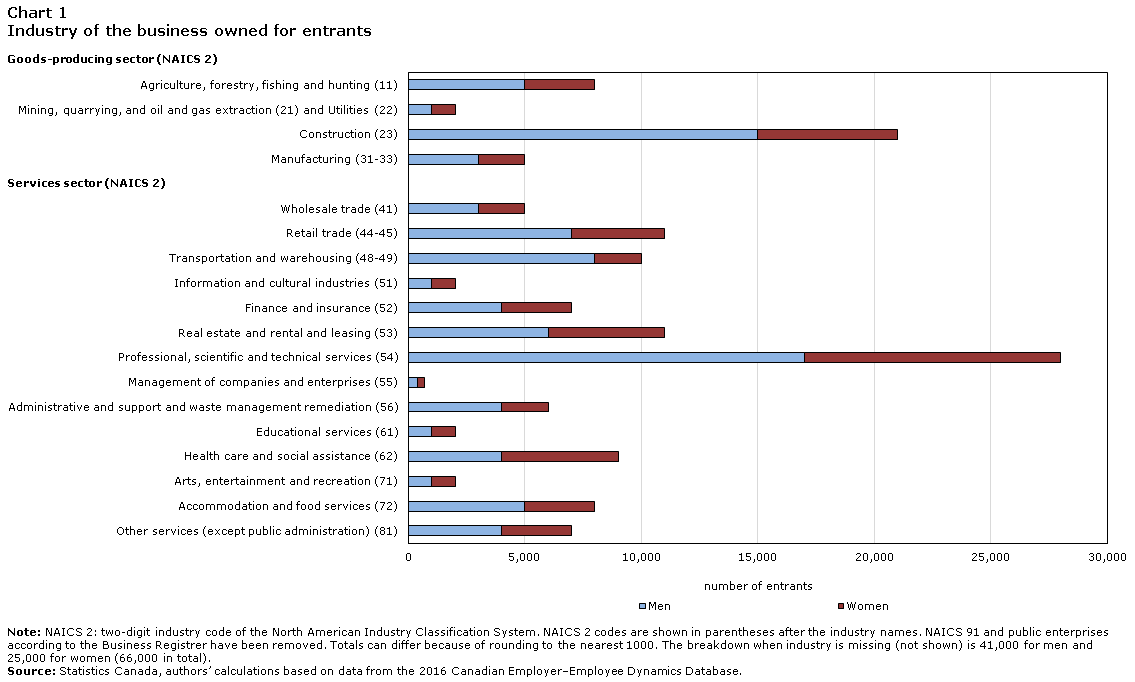
The breakdown of entrants by industry of the business owned (Chart 1) showed that there was a higher share of male entrants across all industries except health and social assistance. It also showed that entry into the service sector was more common (73% for men and 78% for women), but that men were proportionately more likely than women to enter businesses in the goods-producing sector.
These findings are consistent with the literature, which shows that men are more likely than women to have a business in the goods-producing sectors (e.g., Grekou, Li and Liu 2018) and that male entrants are more likely than their female counterparts to have experience in the activity sector of the business owned (Grekou 2020). These findings are also consistent with the fact that women are proportionately less likely than men to pursue an education in science, technology, engineering and mathematics, which are the fields associated with the goods-producing sector (Frenette and Frank 2016).
Data table for Chart 1
| Men | Women | |
|---|---|---|
| number of entrants | ||
| Services sector (NAICS 2) | ||
| Other services (except public administration) (81) | 4,000 | 3,000 |
| Accommodation and food services (72) | 5,000 | 3,000 |
| Arts, entertainment and recreation (71) | 1,000 | 1,000 |
| Health care and social assistance (62) | 4,000 | 5,000 |
| Educational services (61) | 1,000 | 1,000 |
| Administrative and support and waste management remediation (56) | 4,000 | 2,000 |
| Management of companies and enterprises (55) | 400 | 300 |
| Professional, scientific and technical services (54) | 17,000 | 11,000 |
| Real estate and rental and leasing (53) | 6,000 | 5,000 |
| Finance and insurance (52) | 4,000 | 3,000 |
| Information and cultural industries (51) | 1,000 | 1,000 |
| Transportation and warehousing (48-49) | 8,000 | 2,000 |
| Retail trade (44-45) | 7,000 | 4,000 |
| Wholesale trade (41) | 3,000 | 2,000 |
| Goods-producing sector (NAICS 2) | ||
| Manufacturing (31-33) | 3,000 | 2,000 |
| Construction (23) | 15,000 | 6,000 |
| Mining, quarrying, and oil and gas extraction (21) and Utilities (22) | 1,000 | 1,000 |
| Agriculture, forestry, fishing and hunting (11) | 5,000 | 3,000 |
|
Note: NAICS 2: two-digit industry code of the North American Industry Classification System. NAICS 2 codes are shown in parentheses after the industry names. NAICS 91 and public enterprises according to the Business Register have been removed. Totals can differ because of rounding to the nearest 1000. The breakdown when industry is missing (not shown) is 41,000 for men and 25,000 for women (66,000 in total). Source: Statistics Canada, authors’ calculations based on data from the 2016 Canadian Employer–Employee Dynamics Database. |
||
3.4 Family characteristics and spouse’s labour status
Across all panels in Table 1, there was a higher share of women with children compared with men, and the proportions were similar across categories.
A lower share of entrants had a spouse who was a business owner, although the share for women was higher, at 23.6%, than for men (10.3%). In comparison, less than 4% of non-business owners had a spouse who was a business owner.
The share of female (male) entrants with a spouse who was primarily self-employed was proportionately three (two) times higher than that of incumbents or non-business owners.
For all categories, men’s spouses were paid employees for about one-third of the cases. This proportion was lower for women business owners (12.5% for incumbents and 24.9% for entrants).
3.5 Type of enterprise owned
The ownership structure (i.e., men-owned, women-owned or equally owned) of an enterprise is important to consider since the literature has established differences in indicators such as the number of enterprises, sales and employment (e.g., Fairlie and Robb 2009; Rosa and Sylla 2016; Grekou, Li and Liu 2018).
The proportions for men were similar among entrants and incumbents and were concentrated in MOE. Women had a more balanced distribution. However, the share of WOE decreased from entrants to incumbents (44.2% for entrants versus 39.6% for incumbents), while the share MOE (23.1% for entrants versus 25.9% for incumbents) and EOE (32.7% for entrants to 34.4% for incumbents) increased. These shifts in ownership type are consistent with several competing business dynamics (e.g., poor-performing businesses changing ownership or high-performing businesses merging with others). More work is necessary to understand these patterns.
4 Analytical results
This section analyzes factors that favour or impede entry into business ownership. The regression strategy relies on variants of logit models that regress a dummy variable that indicates entry into business ownership on a set of provincial dummies, and the individual and family characteristics depicted in Section 3. The regressions correct for heteroscedasticity and cluster residuals at the census subdivision level of the individuals’ residence. This specification intends to capture within-group correlation (e.g., shocks in the local labour market) that cannot be observed in the data.Note
Two sets of regressions are estimated. In the first set, the (logit) regressions are implemented regardless of the ownership type of the enterprises (MOE, WOE or EOE). In the second set, the (multinomial logit) regressions are implemented to determine whether factors favour entry into one ownership type or the other. For both sets, regressions are also run by entrant gender. The analysis is restricted to the entrants and non-business owners from Section 3.
The tables show average marginal effects and, therefore, represent changes in probability. For continuous variables, a positive (negative) coefficient of means that a one unit change in the independent variable implies a percentage-point increase (decrease) in the probability of becoming a business owner. For factor variables, is the change in probability from the base level. The results do not establish causality and should be interpreted as conditional correlations.
4.1 Entry into business ownership
The effects on entry into business ownership are shown for all observations (Table 2, panel 1), for men only (Table 2, panel 2) and for women only (Table 2, panel 3).
Women and men were influenced by almost the same variables. However, women were less likely than men to enter business ownership.
This study found that women and men were influenced by almost the same variables. Therefore, the signs of variables were the same across genders. However, women were 0.54 pp less likely than men to enter business ownership (Table 2, panel 1). Although this number seems small, it must be compared with the probabilities to be an entrant. Specifically, the estimated probabilities of entry (i.e., the margins, not shown in Table 2) were 0.61% for women and 1.15% for men, which represents a ratio of 53% (0.61/1.15). This suggests that women were about two times less likely to enter business ownership than men. The result is consistent with the literature, which finds a lower participation rate for women in Canada and in Organisation for Economic Co-operation and Development countries (Parker and Martin 2004; Baumann and Brändle 2012; Klyver, Nielsen and Evald 2013).
To understand the differences between women and men, a test was conducted for each variable of interest (Table 2, panel 4). Specifically, the marginal effect of being a woman was calculated at a representative value (e.g., mean age, married or common law, living in rural areas, or having income in the top quintile), keeping all other characteristics constant. The results showed a significant difference in favour of men for all variables.
Looking at income, the probability of entering business ownership for a woman whose family income was in the top quintile was 0.79 percentage points (pp) lower than that of a man with a similar income. Interestingly, the gender gap for entering business ownership increases with income (-0.41 pp for the bottom quintile to -0.79 pp for the top quintile). Women with experience in goods producing were 0.61 pp less likely than their male counterparts to enter business ownership. Looking at the margins (not shown), it was found that women with experience in goods producing were about two times less likely than their male counterparts to enter business ownership. Furthermore, although female entrants were proportionately more likely to have a spouse who was a business owner (Table 1, spouse’s primary occupation), the probability of entry for a woman whose spouse was a business owner was 2.34 pp lower than that of a man whose spouse was a business owner. Similarly, the probability of entry for a woman whose spouse was self-employed was 0.77 pp lower than that of a man whose spouse was self-employed.
To facilitate discussion, the other factors are organized by groups that would fit a resource-based theory (e.g., Davidsson and Honig 2003). These groups are socio-demographic factors, social (family) capital factors, financial capital factors and human capital factors.
Socio-demographic factors
Age had a positive effect on becoming a business owner, but at a diminishing rate. As Shinnar and Young (2008) explained, age can be linked to skill and capital acquisition over the years, and to the fact that younger individuals are less likely to have the necessary financial capacity.
Being a recent immigrant was positively associated with entry (0.44 pp), which means that recent immigrants were more likely to enter business ownership than Canadian-born individuals. This is in line with the literature, which shows that immigrants in Canada are keen on becoming business owners. For example, Green et al. (2016) show that all streams of selection class are involved in business ownership. In 2010, 12% of immigrant business owners entered Canada through the business class, compared with 43% for the economic class (skilled workers and provincial nominees) and 40% for the family and refugee classes. It would be interesting for future research to determine whether this is a result of personality traits (e.g., higher risk tolerance than Canadian-born individuals because of the selection process) or necessity (e.g., entry as a result of an inability to integrate into the labour market).
Individuals with disabilities (-0.36 pp) and individuals living in rural areas (-0.05 pp) were less likely to become business owners. However, it should be noted that forms of businesses other than incorporated businesses might be more suitable for individuals in these groups. For example, farms are likely to be unincorporated businesses or part of a cooperatives network rather than incorporated businesses. More analysis on these groups is therefore required.
| Panel 1: All | Panel 2: Only men | Panel 3: Only women | Panel 4: Testing women versus men | |||||
|---|---|---|---|---|---|---|---|---|
| marginal effect (pp) | p-value | marginal effect (pp) | p-value | marginal effect (pp) | p-value | marginal effect (pp) |
p-value | |
| Women | -0.542Note *** | 0.000 | Note ...: not applicable | Note ...: not applicable | Note ...: not applicable | Note ...: not applicable | Note ...: not applicable | Note ...: not applicable |
| Socio-demographic factors | ||||||||
| Age | 0.082Note *** | 0.000 | 0.105Note *** | 0.000 | 0.059Note *** | 0.000 | -1.200Note *** | 0.000 |
| Age squared | -0.001Note *** | 0.000 | -0.001Note *** | 0.000 | -0.001Note *** | 0.000 | -1.010Note *** | 0.000 |
| Immigrant | 0.252Note *** | 0.000 | 0.329Note *** | 0.000 | 0.140Note *** | 0.000 | -0.656Note *** | 0.000 |
| Recent immigrant | 0.443Note *** | 0.000 | 0.545Note *** | 0.000 | 0.201Note *** | 0.000 | -0.791Note *** | 0.000 |
| Rural | -0.050Note ** | 0.002 | -0.058Note * | 0.013 | -0.040Note ** | 0.001 | -0.517Note *** | 0.000 |
| Disability | -0.360Note *** | 0.000 | -0.666Note *** | 0.000 | -0.262Note *** | 0.000 | -0.325Note *** | 0.000 |
| Social capital factors | ||||||||
| Caregiver | 0.056Note ** | 0.007 | 0.070Table 2 Note † | 0.051 | 0.040Note * | 0.010 | -0.575Note *** | 0.000 |
| Marital status | ||||||||
| Married or common-law | 0.240Note *** | 0.000 | 0.330Note *** | 0.000 | 0.227Note *** | 0.000 | -0.567Note *** | 0.000 |
| Widowed, divorced or separated | 0.455Note *** | 0.000 | 0.588Note *** | 0.000 | 0.328Note *** | 0.000 | -0.696Note *** | 0.000 |
| Age group of children | ||||||||
| Had children younger than 7 years old only | 0.123Note *** | 0.000 | 0.179Note *** | 0.000 | 0.101Note *** | 0.000 | -0.614Note *** | 0.000 |
| Had children aged 7 to 16 only | -0.037Note * | 0.048 | -0.058Note * | 0.032 | 0.001 | 0.969 | -0.518Note *** | 0.000 |
| Had children younger than 7 years old and children aged 7 to 16 | 0.014 | 0.565 | 0.071Table 2 Note † | 0.065 | 0.021 | 0.271 | -0.549Note *** | 0.000 |
| Spouse's primary occupation in 2015 | ||||||||
| Business owner | 3.380Note *** | 0.000 | 2.210Note *** | 0.000 | 1.080Note *** | 0.000 | -2.340Note *** | 0.000 |
| Self-employed | 0.599Note *** | 0.000 | 0.580Note *** | 0.000 | 0.497Note *** | 0.000 | -0.769Note *** | 0.000 |
| Paid employee | 0.042 | 0.181 | 0.132Note ** | 0.003 | -0.053 | 0.324 | -0.429Note *** | 0.000 |
| Non-employed | 0.053 | 0.158 | 0.140Note * | 0.013 | -0.081 | 0.144 | -0.436Note *** | 0.000 |
| Financial capital factors | ||||||||
| Family income (2011 to 2015) | ||||||||
| 20th to 40th percentile | 0.009 | 0.310 | 0.029 | 0.141 | 0.008 | 0.354 | -0.406Note *** | 0.000 |
| 40th to 60th percentile | 0.116Note *** | 0.000 | 0.196Note *** | 0.000 | 0.123Note *** | 0.000 | -0.471Note *** | 0.000 |
| 60th to 80th percentile | 0.267Note *** | 0.000 | 0.372Note *** | 0.000 | 0.270Note *** | 0.000 | -0.563Note *** | 0.000 |
| Above 80th percentile | 0.653Note *** | 0.000 | 0.712Note *** | 0.000 | 0.544Note *** | 0.000 | -0.793Note *** | 0.000 |
| Experienced 10% negative income shock (2011 to 2015) | 0.178Note *** | 0.000 | 0.253Note *** | 0.000 | 0.112Note *** | 0.000 | -0.586Note *** | 0.000 |
| Human capital factors | ||||||||
| Attended eligible education programs | 0.135Note *** | 0.000 | 0.149Note *** | 0.000 | 0.115Note *** | 0.000 | -0.608Note *** | 0.000 |
| Primary occupation in 2015 | ||||||||
| Self-employed | 2.160Note *** | 0.000 | 1.940Note *** | 0.000 | 0.997Note *** | 0.000 | -1.620Note *** | 0.000 |
| Non-employed | 0.276Note *** | 0.000 | 0.402Note *** | 0.000 | 0.318Note *** | 0.000 | -0.489Note *** | 0.000 |
| Experience in goods-producing sector (2011 to 2015) | 0.095Note *** | 0.000 | 0.008 | 0.636 | 0.181Note *** | 0.000 | -0.611Note *** | 0.000 |
| Experience in at least two industries (2011 to 2015) | 0.647Note *** | 0.000 | 1.020Note *** | 0.000 | 0.502Note *** | 0.000 | -0.694Note *** | 0.000 |
Note: See Table A.1 in the Appendix for variables definitions. The p-values correct for heteroscedasticity and are clustered at the census subdivision level of the individuals' residence. All regressions include the province of residence. The number of observations for the regression All is 23,915,000 and the pseudo R-squared is 0.161. The number of observations for the regression Only men is 11,453,000 and the pseudo R-squared is 0.154. The number of observations for the regression Only women is 12,462,000 and the pseudo R-squared is 0.161. The results in panel 4 are obtained using regression All. The reference categories are respectively: for Woman, man; for Immigrant and Recent immigrant, Canadian-born; for Rural, not living in rural; for Disability, not having any disability; for Caregiver not being a caregiver; for Marital status, being single; Age group of children, not having children aged under 16 years old; Spouse primary occupation, no spouse; for Family income, the first quintile; for income shock, no income shock; for eligible education, not having attended any; for Primary occupation, paid employee; and Experience in goods-producing sector or in at least 2 industries, no such experience. pp: percentage points (marginal effects multiplied by 100). Source: Statistics Canada, authors’ calculations based on data from the Canadian Employer–Employee Dynamics Database, 2011 to 2016. |
||||||||
Social (family) capital factors
Being a caregiver (0.06 pp) increased the probability of entry, which shows that adversity can drive individuals into business ownership.
In line with Chlosta, Patzelt and Klein (2012), it was found that family and household characteristics also play a role in entry into business ownership. First, widowed, divorced or separated individuals were more likely to become business owners than single individuals (0.46 pp). This is consistent with a shock to an individual’s financial and mental wellbeing that leads to entry.Note It also aligns with Ozcan (2011), who found that this group differs from single individuals. Second, having young children aged 7 or younger rather than being single also pushed individuals into business ownership (0.12 pp). This is consistent with Jeon and Ostrovsky (2016), who found that new mothers were more likely to make the transition to autonomous work as they looked for a better work–life balance. The results here apply to both men and women. Interestingly, having children between the ages of 7 and 16 had an adverse effect on entry for men.
Having a spouse who was primarily a business owner or self-employed was associated with the highest effect in the propensity of entry overall (3.38 pp) and for both genders (2.21 pp for men and 1.08 pp for women). Hence, for both genders, an entrepreneurial spouse plays an important role in the likelihood of becoming business owner. This is consistent with a strategy under which the entrant joins opportunistically because it is worth doing so. Such a result can be linked to Lin, Picot and Compton (2000), who found a similar result for entry into self-employment. The authors explained their findings with a theory of family business under which an entrepreneurial activity led by a spouse would often attract the other spouse. Future research on understanding such mechanisms would be beneficial for policy design. For instance, if it is the exposure to entrepreneurial activities or lifestyle that increases entry, increasing exposure of non-entrepreneurs to entrepreneurial activities and promoting existing (female) entrepreneurs could foster entrepreneurship.
Financial capital factors
As discussed in Section 3, financial resources play an important role in an individual’s decision to engage in entrepreneurial activities. In particular, it was found that the positive association of income with respect to the lowest quintile increased with the level of income: the marginal effect was 0.01 pp and not significant at the second quintile, but was at 0.65 pp and highly significant at the top quintile. Hence, not only did the coefficients become significant with higher ranked quintiles, their magnitude also increased. This suggests that a positive effect of income on entry for opportunity-based projects generally requires income levels beyond certain thresholds. These thresholds must be enough to face initial investments and costs.
Having lost at least 10% income in any year between 2011 and 2015 (0.18 pp) increased the probability of entry, showing that adversity and income shocks can drive individuals into business ownership by necessity.
Human capital factors
These factors include attending education programs and labour market experience. Having attended eligible part-time or full-time educational programs between 2011 and 2015 had a positive effect on entry (0.14 pp). Although it was not possible to determine what program the individuals attended and whether it related to the activities of the business owned, it is consistent with preparation and human capital accumulation that would act as motivation to enter business ownership (Shinnar and Young 2008).
The individuals who were primarily self-employed in 2015 were more likely to become business owners than paid employees (2.16 pp). Van der Zwan, Verheul and Thurik (2012) and Figueiredo and Brochado (2015) also found that self-employed individuals were more likely to engage in entrepreneurial activities. Self-employment could indeed be a preparatory step toward incorporation for many individuals. Also, non-employed individuals were more likely to become business owners than those with paid employment (0.28 pp), which suggests that unemployment pushed people into business ownership.Note
Consistent with Lazear (2005), having experience in different industries had a positive effect on the likelihood to become a business owner (0.1 pp). Interestingly, having experience in the goods-producing sector was a significant factor for women but not for men. However, as discussed above, women with such experience were less likely than their male counterparts to enter business ownership.
4.2 Entry by type of enterprise
While the previous subsection analyzed entry into business ownership in general, this subsection investigates the entry by enterprise type. The results are presented by gender (Table 3 for men, Table 4 for women) and, therefore, cannot be compared directly.Note The results allow for an examination of factors that attract men and women to MOE, WOE or EOE.
In each table, marginal effects from multinomial logistic regressions show propensity to enter MOE (panel 1), WOE (panel 2) or EOE (panel 3) relative to non-entry. Because the marginal effects cannot be compared with one another directly, the significance of tests is also provided. To determine whether factors favour one type of enterprise or the other, the last three columns in Tables 3 and 4 show the significance levels of testing, and whether the difference between MOE and WOE, MOE and EOE, and WOE and EOE is significantly different from zero.
| Variables | Men-owned enterprises | Women-owned enterprises | Equally owned enterprises | Testing equality of coefficients | |||||
|---|---|---|---|---|---|---|---|---|---|
| MOE and WOE | MOE and EOE | WOE and EOE | |||||||
| marginal effect (pp) | p-value | marginal effect (pp) |
p-value | marginal effect (pp) |
p-value | significance | significance | significance | |
| Socio-demographic factors | |||||||||
| Age | 0.090Note *** | 0.000 | 0.001Note * | 0.042 | 0.013Note *** | 0.000 | p < 0.001 | p < 0.001 | p < 0.001 |
| Age squared | -0.001Note *** | 0.000 | 0.000Note *** | 0.000 | 0.000Note *** | 0.000 | p < 0.001 | p < 0.001 | p < 0.001 |
| Immigrant | 0.282Note *** | 0.000 | 0.008Note *** | 0.000 | 0.040Note *** | 0.000 | p < 0.001 | p < 0.001 | p < 0.001 |
| Recent immigrant | 0.440Note *** | 0.000 | 0.002 | 0.467 | 0.100Note *** | 0.000 | p < 0.001 | p < 0.001 | p < 0.001 |
| Rural | -0.082Note *** | 0.000 | -0.002 | 0.263 | 0.024Note *** | 0.000 | p < 0.001 | p < 0.001 | p < 0.001 |
| Disability | -0.578Note *** | 0.000 | -0.020Note ** | 0.003 | -0.071Note *** | 0.000 | p < 0.001 | p < 0.001 | p < 0.001 |
| Social capital factors | |||||||||
| Caregiver | 0.085Note ** | 0.008 | -0.006 | 0.239 | -0.006 | 0.489 | p < 0.01 | p < 0.01 | Note ...: not applicable |
| Marital status | |||||||||
| Married or common-law | 0.275Note *** | 0.000 | 0.000 | 0.968 | 0.036 | 0.313 | p < 0.001 | p < 0.001 | Note ...: not applicable |
| Widowed, divorced or separated | 0.442Note *** | 0.000 | 0.015Note *** | 0.000 | 0.190Note *** | 0.000 | p < 0.001 | p < 0.001 | p < 0.001 |
| Age group of children | |||||||||
| Had children younger than 7 years old only | 0.099Note *** | 0.001 | 0.021Note *** | 0.000 | 0.048Note *** | 0.000 | p < 0.05 | Note ...: not applicable | p < 0.10 |
| Had children aged 7 to 16 only | -0.051Table 3 Note † | 0.060 | 0.006 | 0.135 | -0.001 | 0.192 | p < 0.05 | Note ...: not applicable | p < 0.10 |
| Had children younger than 7 years old and children aged 7 to 16 | 0.028 | 0.428 | 0.024Note *** | 0.000 | 0.015 | 0.202 | Note ...: not applicable | Note ...: not applicable | Note ...: not applicable |
| Spouse's primary occupation in 2015 | |||||||||
| Business owner | 1.210Note *** | 0.000 | 0.148Note *** | 0.000 | 0.799Note *** | 0.000 | p < 0.001 | p < 0.05 | p < 0.001 |
| Self-employed | 0.070Table 3 Note † | 0.076 | 0.071Note *** | 0.000 | 0.518Note *** | 0.000 | Note ...: not applicable | p < 0.001 | p < 0.001 |
| Paid employee | -0.004 | 0.904 | 0.014 | 0.225 | 0.271Note *** | 0.000 | Note ...: not applicable | p < 0.01 | p < 0.001 |
| Non-employed | -0.018 | 0.689 | 0.009 | 0.458 | 0.297Note *** | 0.000 | Note ...: not applicable | p < 0.01 | p < 0.001 |
| Financial capital factors | |||||||||
| Family income (2011 to 2015) | |||||||||
| Percentile 20th to 40th | 0.035Note * | 0.048 | 0.005Table 3 Note † | 0.051 | -0.003 | 0.608 | p < 0.10 | p < 0.05 | Note ...: not applicable |
| Percentile 40th to 60th | 0.154Note *** | 0.000 | 0.013Note *** | 0.000 | 0.043Note *** | 0.000 | p < 0.001 | p < 0.001 | p < 0.001 |
| Percentile 60th to 80th | 0.282Note *** | 0.000 | 0.024Note *** | 0.000 | 0.080Note *** | 0.000 | p < 0.001 | p < 0.001 | p < 0.001 |
| Percentile above 80th | 0.556Note *** | 0.000 | 0.044Note *** | 0.000 | 0.126Note *** | 0.000 | p < 0.001 | p < 0.001 | p < 0.001 |
| Experienced 10% negative income shock (2011 to 2015) | 0.216Note *** | 0.000 | 0.006Note *** | 0.000 | 0.028Note *** | 0.000 | p < 0.001 | p < 0.001 | p < 0.001 |
| Human capital factors | |||||||||
| Attended eligible education programs | 0.105Note *** | 0.000 | 0.012Note *** | 0.000 | 0.033Note *** | 0.000 | p < 0.001 | p < 0.001 | p < 0.001 |
| Primary occupation in 2015 | |||||||||
| Self-employed | 1.660Note *** | 0.000 | 0.038Note *** | 0.000 | 0.240Note *** | 0.000 | p < 0.001 | p < 0.001 | p < 0.001 |
| Non-employed | 0.322Note *** | 0.000 | 0.021Note *** | 0.000 | 0.060Note *** | 0.000 | p < 0.001 | p < 0.001 | p < 0.001 |
| Experience in goods-producing sector (2011 to 2015) | 0.024 | 0.113 | -0.009Note *** | 0.000 | -0.009Note * | 0.022 | p < 0.05 | p < 0.05 | Note ...: not applicable |
| Experience in at least two industries (2011 to 2015) | 0.839Note *** | 0.000 | 0.027Note *** | 0.000 | 0.153Note *** | 0.000 | p < 0.001 | p < 0.001 | p < 0.001 |
Note: See Table A.1 in the Appendix for definitions of variables. The marginal effects are in comparison with non-entry. The p-values correct for heteroscedasticity and are clustered at the census subdivision level of the individuals' residence. All regressions include the province of residence. The number of observations is 11,453,000 and the pseudo R-squared is 0.151. EOE: equally owned enterprises; MOE: men-owned enterprises; WOE: women-owned enterprises; pp: percentage points (marginal effects multiplied by 100). Source: Statistics Canada, authors’ calculations based on data from the Canadian Employer–Employee Dynamics Database, 2011 to 2016. |
|||||||||
Socio-demographic factors tended to attract men to MOE and women to WOE. However, living in rural areas and having a disability (both genders) and being a recent immigrant (women) attracted individuals to EOE.
Age and immigrant status tended to attract male entrants to MOE and female entrants to WOE. However, being a recent immigrant seemed to attract women towards EOE and WOE (Table 4).
Living in rural areas tended to push male entrants relatively more toward EOE (and significantly not toward MOE, Table 3) and female entrants relatively more towards MOE or EOE (and significantly not toward WOE, Table 4), which suggests that rurality favours entry into EOE. This is consistent with the establishment of family-owned businesses in rural areas.
Although having a disability tended to dissuade individuals from entering business ownership (Table 2), it pushed male entrant relatively more toward WOE or EOE, and female entrants relatively more toward MOE. This result is consistent with persons with disabilities entering business ownership with their spouse. More analysis is required to disentangle these patterns.
Social capital factors tended to attract women and men to EOE and enterprises owned by one’s gender.
Being a caregiver was associated with entry into MOE for men and WOE for women. Similarly, men of all marital statuses were attracted to MOE. Although women who were married or in common-law relationships were attracted to WOE, women who were widowed, divorced or separated were attracted to EOE (Table 4).
Women entrants with young children tended to enter WOE or EOE, whereas their male counterparts tended to enter MOE or EOE. This underlines the specific dynamics of entrants with young children looking for a better work–life balance by setting up a business by themselves or with their spouse.Note Entrants with children of other ages did not have clear patterns (men, Table 3) or were not significantly different from non-entrants (women, Table 4). The results show that, regardless of the spouse’s primary occupation, having a spouse tended to pull entrants relatively more toward EOE—except when the spouse was a business owner, in which case the entrants were pulled toward MOE (men) or both EOE and MOE (women). These results add to the literature that highlights the importance of a spouse in an individual’s decision to enter business ownership (Ozcan 2011; Chlosta, Patzelt, and Klein 2012), and serve as a basis for more analysis. For example, it would be important to determine whether women are more likely listed as (minority) business owners for tax purposes than men, which could explain why men with spouses who are also a business owners were pulled toward MOE.
| Variables | Men-owned enterprises | Women-owned enterprises | Equally owned enterprises | Testing equality of coefficients | |||||
|---|---|---|---|---|---|---|---|---|---|
| MOE and WOE | MOE and EOE | WOE and EOE | |||||||
| marginal effect (pp) | p-value | marginal effect (pp) | p-value | marginal effect (pp) | p-value | significance | significance | significance | |
| Socio-demographic factors | |||||||||
| Age | 0.005Note *** | 0.000 | 0.036Note *** | 0.000 | 0.015Note *** | 0.000 | p < 0.001 | p < 0.001 | p < 0.001 |
| Age squared | 0.000Note *** | 0.000 | 0.000Note *** | 0.000 | 0.000Note *** | 0.000 | p < 0.001 | p < 0.001 | p < 0.001 |
| Immigrant | -0.004 | 0.405 | 0.100Note *** | 0.000 | 0.035Note *** | 0.000 | p < 0.001 | p < 0.001 | p < 0.001 |
| Recent immigrant | 0.049Note *** | 0.000 | 0.068Note *** | 0.000 | 0.075Note *** | 0.000 | p < 0.10 | p < 0.05 | Note ...: not applicable |
| Rural | 0.016Note *** | 0.000 | -0.081Note *** | 0.000 | 0.007 | 0.118 | p < 0.001 | Note ...: not applicable | p < 0.001 |
| Disability | -0.045Note *** | 0.001 | -0.129Note *** | 0.000 | -0.086Note *** | 0.000 | p < 0.001 | p < 0.05 | p < 0.05 |
| Social capital factors | |||||||||
| Caregiver | -0.022Note * | 0.048 | 0.061Note *** | 0.000 | -0.007 | 0.457 | p < 0.001 | Note ...: not applicable | p < 0.001 |
| Marital status | |||||||||
| Married or common-law | 0.091Note *** | 0.000 | 0.076Note ** | 0.002 | 0.013 | 0.721 | Note ...: not applicable | p < 0.10 | p < 0.10 |
| Widowed, divorced or separated | 0.097Note *** | 0.000 | 0.096Note *** | 0.000 | 0.152Note *** | 0.000 | Note ...: not applicable | p < 0.001 | p < 0.01 |
| Age group of children | |||||||||
| Had children younger than 7 years old only | 0.031Note *** | 0.000 | 0.042Note *** | 0.000 | 0.022Note *** | 0.000 | Note ...: not applicable | Note ...: not applicable | p < 0.10 |
| Had children aged 7 to 16 only | 0.004 | 0.536 | -0.004 | 0.734 | 0.003 | 0.594 | Note ...: not applicable | Note ...: not applicable | Note ...: not applicable |
| Had children younger than 7 years old and children aged 7 to 16 | 0.011 | 0.191 | -0.004 | 0.815 | 0.013 | 0.100 | Note ...: not applicable | Note ...: not applicable | Note ...: not applicable |
| Spouse's primary occupation in 2015 | |||||||||
| Business owner | 0.438Note *** | 0.000 | 0.123Note *** | 0.000 | 0.657Note *** | 0.000 | p < 0.001 | Note ...: not applicable | p < 0.001 |
| Self-employed | 0.221Note *** | 0.000 | -0.116Note *** | 0.000 | 0.542Note *** | 0.000 | p < 0.001 | p < 0.001 | p < 0.001 |
| Paid employee | -0.005 | 0.814 | -0.156Note *** | 0.000 | 0.298Note *** | 0.000 | p < 0.001 | p < 0.001 | p < 0.001 |
| Non-employed | -0.035 | 0.128 | -0.131Note *** | 0.000 | 0.271Note *** | 0.000 | p < 0.001 | p < 0.001 | p < 0.001 |
| Financial capital factors | |||||||||
| Family income (2011 to 2015) | |||||||||
| Percentile 20th to 40th | -0.003 | 0.568 | 0.024Note *** | 0.000 | -0.010Note * | 0.048 | p < 0.001 | Note ...: not applicable | p < 0.001 |
| Percentile 40th to 60th | 0.061Note *** | 0.000 | 0.051Note *** | 0.000 | 0.027Note *** | 0.000 | Note ...: not applicable | p < 0.001 | p < 0.01 |
| Percentile 60th to 80th | 0.121Note *** | 0.000 | 0.099Note *** | 0.000 | 0.067Note *** | 0.000 | Note ...: not applicable | p < 0.001 | p < 0.001 |
| Percentile above 80th | 0.217Note *** | 0.000 | 0.216Note *** | 0.000 | 0.130Note *** | 0.000 | p < 0.10 | p < 0.001 | p < 0.001 |
| Experienced 10% negative income shock (2011 to 2015) | 0.026Note *** | 0.000 | 0.056Note *** | 0.000 | 0.026Note *** | 0.000 | p < 0.001 | Note ...: not applicable | p < 0.001 |
| Human capital factors | |||||||||
| Attended eligible education programs | 0.024Note *** | 0.000 | 0.060Note *** | 0.000 | 0.028Note *** | 0.000 | p < 0.001 | Note ...: not applicable | p < 0.001 |
| Primary occupation in 2015 | |||||||||
| Self-employed | 0.216Note *** | 0.000 | 0.513Note *** | 0.000 | 0.262Note *** | 0.000 | p < 0.001 | p < 0.001 | p < 0.001 |
| Non-employed | 0.084Note *** | 0.000 | 0.120Note *** | 0.000 | 0.112Note *** | 0.000 | Note ...: not applicable | p < 0.05 | Note ...: not applicable |
| Experience in goods-producing sector (2011 to 2015) | 0.087Note *** | 0.000 | 0.029Note *** | 0.000 | 0.060Note *** | 0.000 | p < 0.001 | p < 0.001 | p < 0.001 |
| Experience in at least two industries (2011 to 2015) | 0.115Note *** | 0.000 | 0.236Note *** | 0.000 | 0.154Note *** | 0.000 | p < 0.001 | p < 0.001 | p < 0.001 |
† significantly different from reference category (p < 0.10) Note: See Table A.1 in the Appendix for definitions of variables. The marginal effects are in comparison with non-entry. The p-values correct for heteroscedasticity and are clustered at the census subdivision level of the indivudals' residence. All regressions include the province of residence. The number of observations is 12,462,000 and the pseudo R-squared is 0.154. EOE: equally owned enterprises; MOE: men-owned enterprises; WOE: women-owned enterprises; pp: percentage points (marginal effects multiplied by 100). Source: Statistics Canada, authors’ calculations based on data from the Canadian Employer–Employee Dynamics Database, 2011 to 2016. |
|||||||||
Financial capital factors attracted men into MOE (all factors). Women tended to enter WOE after an income shock or when at the bottom of the income distribution. At higher income levels, women tended to enter WOE and MOE.
Men tended to enter MOE relatively more than any other type of enterprise at any level of family cumulative income. Women tended to enter WOE significantly more if they were at the bottom quintile of the family income distribution, but tended to enter MOE and WOE relatively more at higher levels. In other words, WOE tended to attract women at the bottom of the income distribution, only a few women higher in the income distribution, and, relatively speaking, few men. This matching pattern might be important and should be taken into account when analyzing performance gaps across types of enterprises.
Overall, having incurred a 10% negative income shock was associated with entry into an enterprise whose gender ownership corresponded to the entrant’s own gender.
Human capital factors attracted entrants to enterprises whose gender ownership corresponded to the entrant’s own gender. However, experience in the goods-producing sector attracted women to MOE.
Attending eligible education programs, being self-employed in 2015 or having experience from multiple industries tended to pull male entrants toward MOE and female entrants toward WOE.
Having experience in the goods-producing sector tended to pull women toward MOE.Note Importantly, it was not a significant factor for their male counterparts to join MOE, but it was clearly a significant factor for them to not join WOE. These results were certainly driven by the relatively low numbers of WOE operating in the goods-producing sector, but they may nevertheless reveal difficulties for setting up WOE in this sector and may also contribute to an explanation of performance gaps.
5 Conclusion
This paper has discussed the determinants of entry into business ownership using a Canadian matched employer–employee database, the Canadian Employer–Employee Dynamics Database (CEEDD). Business owners were defined as private incorporated business owners with at least 10% share whose business ownership activity was their primary activity. Furthermore, the entrants into business ownership were the individuals who were business owners in 2016, but not in 2015.
In 2016, the entrants represented less than 1% of Canadian tax filers aged 18 to 80. There were 207,000 entrants compared with 1,413,000 individuals who were already business owners (incumbents), and 23,915,000 non-business owners. Men accounted for more than 60% of the entrants and incumbents, while women accounted for 53% of the non-business owners.
The descriptive statistics suggest that the labour market experience of entrants differed from that of non-business owners. Entrants were more likely than non-business owners to have experience in more than one industry over the 2011-to-2015 period (80% versus 50%), to be the owner of an unincorporated business in 2015, and to have a spouse who was the owner of a business (unincorporated or incorporated) in 2015. Also, entrants were more likely than non-business owners to be immigrants and to have children younger than 7 years old. They had accumulated more family income than non-business owners over the 2011-to-2015 period.
Female entrants were more likely than their male counterparts to have suffered from a major negative income shock (defined as a shock of at least 10%) during the 2011-to-2015 period, and to be non-employed in 2015. However, they were less likely to have experience in the goods-producing sector. They had a lower cumulative personal income over the 2011-to-2015 period, but a higher cumulative family income, which could be explained by the fact that women were relatively more likely to be married or in a common-law relationship than their male counterparts. Male entrants were concentrated in MOE, while women entrants’ distribution was more balanced.
The analysis of logit and multinomial models showed that women and men were influenced by almost the same factors. However, women were about two times less likely to enter business ownership than men. Despite similarities in the sign of the marginal effects, statistically significant gender differences were found for all factors and showed that men tended to enter business ownership proportionately more than women. For example, women with experience in goods producing were two times less likely than their male counterparts to enter business ownership. Furthermore, although female entrants were proportionately more likely to have a spouse who was a business owner, the probability of entry for a woman whose spouse was a business owner was 2.34 pp lower than that of a man whose spouse was a business owner.
The important role of spouses in an individual’s decision to enter business ownership was assessed. Having a spouse who was a business owner in 2015 had the highest marginal effect on the probability of entry (3.4 pp in comparison with not having a spouse).
The findings from the regression-based analysis are relevant in the context of the recovery from the COVID-19 pandemic. Indeed, the COVID-19 crisis has generated shocks that echo the factors analyzed in the paper. For example, individuals who were non-employed were more likely to enter business ownership than paid employees. Similarly, having suffered from a major negative income shock, being a caregiver, being a recent immigrant, and being widowed, divorced or separated tended to push individuals toward business ownership. Interestingly, these factors tended to attract men to men-owned enterprises (MOE) and women to women-owned enterprises (WOE) and equally owned enterprises (EOE). Having young children tended to attract men to MOE and EOE and women to WOE and EOE. However, having a disability or living in a rural area seemed to discourage individuals from entering business ownership. Family income and experience in the goods-producing sector pulled women toward MOE or EOE, while having a spouse tended to attract both genders to EOE, regardless of the spouse’s employment status (except for men, who tended to enter MOE when their spouse was a business owner).
These results form the basis for more research. For example, they can add to the debate of the causal role of push (i.e., necessity-based) and pull (i.e., opportunity-based) factors in explaining performance gaps observed between MOE, WOE and EOE. Specifically, the fact that factors like the income shock and being at the bottom of the income distribution push women toward WOE, while women with a higher family income and experience in the goods-producing sector are pulled toward MOE or EOE, could contribute to performance gaps. More analysis on the subject is therefore required and would add to evidence like Amit and Muller (1995), who found that Canadian firms motivated by push factors were less financially successful.
Finally, the analysis has also revealed important areas where knowledge gaps subsist. For instance, the dynamics in rural areas or the ones for persons with disabilities were not fully assessed. Also, the ethnocultural diversity of the Canadian population, which includes Indigenous people and visible minorities, could not be explored with the current data. Filling these gaps would certainly enhance the understanding of specificities for these groups and provide evidence to support policy making.
Appendix
| Variable/concept | Source | Description |
|---|---|---|
| Entrant | T2 Schedule 50 | Individual who is a business owner (i.e., present in T2 Schedule 50) whose business ownership activity is their primary activity. Was described as such in 2016, but not in 2015. |
| Gender | T1 | Gender of the individual. When missing, imputed using other years. |
| Age | T1 | Age of the individual, derived from the date of birth. When missing, imputed using other years. |
| Marital status | T1 | Marital status in the year preceding entry. |
| Immigrant | Immigrant landing file | Indicates whether the individual is not Canadian-born. |
| Recent immigrant | Immigrant landing file | Recent immigrants are individuals whose year of landing (i.e., year they entered Canada as a permanent resident) is within five years of the year of entry into business ownership. |
| Live in rural areas | T1 | • The second character of the postal code is indicative of the postal code's coverage. Canada Post classifies all postal codes with a "0" as the second character as "rural" and all other postal codes as urban. • A dummy indicator is created that flags whether the second digit of the individual's postal code is 0. |
| Disability | T1 | Dummy indicator that flags whether the disability deduction for self is positive. The disability deduction is a pre-set amount that can be claimed if the tax filer was physically or mentally impaired. |
| Caregiver | T1FF | Dummy indicator that flags whether the caregiver tax credit is positive. The caregiver tax credit is claimed by tax filers with a dependent adult family member. |
| Attended eligible education programs from 2011 to 2015 | T1 | Dummy indicator that flags whether the education deduction is positive. Education deductions are claimed by full-time and part-time students as defined by CRA. |
| Personal income from 2011 to 2015 | T1 | Total income before tax in the year preceding entry, calculated by the CRA (line 150) as the sum of many income components (employment income, pension, capital gains, dividends, self-employment, rent, alimony, social assistance, universal child care benefits since 2006) deflated using CPI (unit: constant 2006 dollars). The cumulative income is obtained by summing available information from 2011 to 2015. |
| Family income from 2011 to 2015 | T1FF | The family total income after tax, deflated using CPI (unit: constant 2006 dollars). The cumulative income is obtained by summing available information from 2011 to 2015. "Family" is the census family concept. |
| Suffered at least 10% negative income shock (2011 to 2015) | T1FF | Dummy variable that indicates whether an individual experienced a major negative income shock between 2011 and 2015. A shock is defined as a loss of at least 10% of family income from one year to the other at any time between 2011 and 2015. |
| Indicator of saving capacity | T1 | Dummy indicator that flags whether the tax filer contributed to an RPP or RRSP from 2011 to 2015. Other popular savings programs (e.g., TFSA) are not available in tax files. |
| Primary occupation in 2015 (self and spouse) | T1, T1 FD, T2 Schedule 50 and T4 | • Labour status in 2015: there are five possible mutually exclusive categories: employed (received a T4), incorporated business owner (T2 Schedule 50), self-employed (i.e., unincorporated business owner, was in the T1-FD file), non-employed (if not in the three other categories, but in T1), and missing (if not in T1). An additional category is added for the spouse (not applicable if the individual does not have a spouse). • By definition, an entrant in 2016 cannot be an incorporated business owner in 2015. • The spouse is identified using the T1. |
| Experience in at least two industries | T1 FD, T1 BD, T2 Schedule 50 and T4 and T2 (NALMF) | • The working path is established over the 2011-to-2015 period. The working path is the list of firms they owned or where they were an employee. The path is determined using the business number from the T4 (employees), T2 Schedule 50 (incorporated business owner), and T1 FD (unincorporated business owner). • For each year, the two-digit NAICS code is obtained from NALMF at the enterprise level (employees and incorporated business owners) or from the T1 BD (unincorporated business owners, variable BR_DERIVED_NAICS). • A dummy indicator is created that flags whether the individual has worked in at least two industries between 2011 and 2015. |
| Experience in goods-producing sector only Experience in services sector only Experience in goods-producing and services sectors |
T1 FD, T1 BD, T2 Schedule 50, T4 and T2 (NALMF) | Using the working path, an indicator is created that flags whether an individual has experience in 1. the goods-producing sector only 2. the services sector only 3. the goods-producing and services sectors. The goods-producing and services sectors are defined using two-digit NAICS codes: Goods-producing sectors: 11, 21, 22, 23, 31, 32, and 33 Services sectors: 41, 44, 45, 48, 49, 51, 52, 53, 56, 61, 62, 71, 72, 81, and 91. |
| Number of children younger than 7 years old | T1FF | Number of children younger than 7 years old for whom child care expenses were claimed in the year preceding entry. |
| Number of children from 7 to 16 years old | T1FF | Number of children from 7 to 16 years old for whom child care expenses were claimed in the year preceding entry. |
| Type of ownership | T2 Schedule 50 | Indicator that flags whether a corporation is a majority men-owned enterprise, a majority women-owned enterprise, an equally owned enterprise or has undefined type. See Grekou, Li and Liu (2018) for details. |
|
Note: CRA: Canada Revenue Agency; CPI: Consumer Price Index; NAICS: North American Industry Classification System; NALMF: National Accounts Longitudinal Microdata File; RPP: registered pension plan; RRSP: registered retirement savings plan; T1: Income Tax and Benefit Return; T1 BD: T1 Business Declaration; T1 FD: T1 Financial Declaration; T1FF: T1 Family File; T2: Corporation Income Tax Return T4: Statement of Remuneration Paid; TFSA: tax-free savings account. Source: Statistics Canada, authors’ documentation. |
||
| Themes, statistics or categories | Men | Women |
|---|---|---|
| number | ||
| Sample (number of individuals) | 12,477,000 | 13,058,000 |
| Age (mean) | 47 | 47 |
| percent | ||
| Immigration | ||
| Immigrants | 19.20 | 20.10 |
| Recent immigrants | 4.10 | 4.40 |
| Marital status | ||
| Married or common-law | 59.40 | 57.20 |
| Single | 32.20 | 28.00 |
| Widowed, divorced or separated | 8.30 | 14.70 |
| Unstated | 0.10 | 0.10 |
| Miscellaneous individual characteristics | ||
| Live in rural areas | 17.20 | 16.20 |
| Disability | 2.60 | 2.40 |
| Caregivers | 1.80 | 1.50 |
| Attended eligible education programs | 17.30 | 21.30 |
| 2006 constant dollars | ||
| Personal income, 2011 to 2015 | ||
| Mean of the sum | 264,000 | 172,000 |
| Median of the sum | 189,000 | 126,000 |
| Family income, 2011 to 2015 | ||
| Mean of the sum | 355,000 | 339,000 |
| Median of the sum | 292,000 | 273,000 |
| percent | ||
| Suffered from negative income shock (>=10%) | 0.40 | 5.50 |
| 2006 constant dollars | ||
| Indicator of saving capacity, 2011 to 2015, RPP or RRSP | ||
| Mean | 28,000 | 22,000 |
| Median | 17,000 | 13,000 |
| percent | ||
| Contributed to RPP or RRSP | 46.30 | 43.30 |
| Primary occupation in 2015 | ||
| Business owner | 7.90 | 4.30 |
| Self-employed | 8.70 | 7.50 |
| Employee | 58.90 | 57.40 |
| Non-employed | 18.70 | 26.30 |
| Missing | 5.80 | 4.60 |
| Industry experience over 2011 to 2015 | ||
| Experience in at least two industries (NAICS 2) | 58.80 | 51.90 |
| Experience in goods-producing sector only | 12.30 | 3.30 |
| Experience in services sector only | 50.00 | 66.00 |
| Experience in goods-producing and services sectors | 23.30 | 10.50 |
| Unknown | 14.40 | 20.20 |
| Spouse's primary occupation in 2015 | ||
| Business owner | 3.60 | 6.00 |
| Self-employed | 5.10 | 6.00 |
| Employee | 32.30 | 31.40 |
| Non-employed | 14.40 | 10.70 |
| Not applicable (no spouse) | 41.70 | 43.40 |
| Missing | 2.90 | 2.50 |
| Age group of children, as available in the data | ||
| No children younger than 16 years old | 98.50 | 95.80 |
| Had children younger than 7 years old only | 1.00 | 2.70 |
| Had children aged 7 to 16 only | 0.50 | 1.40 |
| Had children younger than 7 years old and children aged 7 to 16 | 0.10 | 0.20 |
| Gender ownership | ||
| Men-owned | 78.60 | 25.60 |
| Women-owned | 3.50 | 40.20 |
| Equally owned | 17.90 | 34.20 |
|
Note: For each variable, all the differences within and across panels are statistically different except those reported in Table A.3 in the Appendix. Percentages for themes may not add up to 100.0% because of rounding. RPP: Registered Pension Plan; RRSP: Registered Retirement Savings Plan; NAICS 2: two-digit industry level of the North American Industry Classification System; sectors are groupings of industries. Source: Statistics Canada, authors’ calculations based on data from the Canadian Employer–Employee Dynamics Database, 2011 to 2016. |
||
| Compare | Sample | Variable/category |
|---|---|---|
| Entrants and incumbents | Women | Caregiver Services sector only |
| Men | Men-owned enterprises | |
| Entrants and non-business owners | Women | Living in rural areas |
| Men and women | Entrants | Living in rural areas Unstated marital status |
| Incumbents | Marital status/married or common-law Unstated marital status |
|
| Source: Statistics Canada, authors’ calculations based on data from the Canadian Employer–Employee Dynamics Database, 2011 to 2016. | ||
References
Amit, R., and E. Muller. 1995. “‘Push’ and ‘Pull’ Entrepreneurship.” Journal of Small Business & Entrepreneurship 12 (4): 64–80.
Baldwin, J.R., and L. Rispoli 2010. Productivity Trends of Unincorporated Enterprises in the Canadian Economy, 1987 to 2005. The Canadian Productivity Review, no. 028. Statistics Canada Catalogue no. 15-206-X. Ottawa: Statistics Canada.
Baldwin, J.R., D. Leung, and L. Rispoli 2011. Labour Productivity of Unincorporated Sole Proprietorships and Partnerships: Impact on the Canada-United States Productivity Gap. Economic Analysis Research Paper Series, no. 071. Statistics Canada Catalogue no. 11F0027M. Ottawa: Statistics Canada.
Baumann, F., and T. Brändle. 2012. “Self-employment, Educational Attainment and Employment Protection Legislation.” Labour Economics 19 (6): 846–859.
Buera, F.J., J.P. Kaboski, and Y. Shin. 2015. “Entrepreneurship and Financial Frictions: A Macrodevelopment Perspective.” Annual Review of Economics, Annual Reviews 7 (1): 409–436.
Brush, C.G. 1992. “Research on Women Business Owners: Past Trends, a New Perspective and Future Directions.” Entrepreneurship Theory and Practice 16 (4): 5–30.
Chlosta, S., H. Patzelt, and S.B, Klein. 2012. “Parental role models and the decision to become self-employed: The moderating effect of personality.” Small Business Economics 38: 121–138.
Conway, P., V. Janod, and G. Nicoletti. 2005. Product Market Regulation in OECD Countries: 1998 to 2003. OECD Economics Department Working Papers, no. 419. Paris: OECD Publishing.
Davidsson, P., and B. Honig. 2003. “The role of social and human capital among nascent entrepreneurs.” Journal of Business Venturing 18 (3): 301–331.
De Groot, T. 2001. Challenges Faced by Women in Industrial Development Section. Women Entrepreneurs in Africa: Experience from Selected Countries, Section III. Geneva: United Nations Publications.
Evans, D., and B. Jovanovic. 1989. “An estimated model of entrepreneurial choice under liquidity constraints.” Journal of Political Economy 97 (4): 808–827.
Fairlie, R., and A. Robb. 2009. “Gender differences in business performance: evidence from the Characteristics of Business Owners Survey.” Small Business Economics 33 (4): 375–395.
Figueiredo, V., and A. Brochado. 2015. “Assessing the main determinants of entrepreneurship in Portugal.” Tourism & Management Studies. 11: 182–190.
Frenette, M., and K. Frank. 2016. Earnings of Postsecondary Graduates by Detailed Field of Study.Economic Insights, no. 056. Statistics Canada Catalogue no. 11-626-X. Ottawa: Statistics Canada.
Goyal, P., and V. Yadav. 2014. “To be or not to be a woman entrepreneur in a developing country?” Psychosociological Issues in Human Resource Management 2 (2): 68–78.
Green, D., H. Liu, Y. Ostrovsky, and G. Picot. 2016. Immigration, Business Ownership and Employment in Canada. Analytical Studies Branch Research Paper Series, no. 375. Statistics Canada Catalogue no. 11F0019M. Ottawa: Statistics Canada.
Grekou, D., J. Li, and H. Liu. 2018. Women-owned Enterprises in Canada, 2005 to 2013. Economic Insights Series, no. 083. Statistics Canada Catalogue no. 11-626-X. Ottawa: Statistics Canada.
Grekou, D., and H. Liu. 2018. The Entry into and Exit out of Self-employment and Business Ownership in Canada. Analytical Studies Branch Research Paper Series, no. 407. Statistics Canada Catalogue no. 11F0019M. Ottawa: Statistics Canada.
Grekou, D. 2020. Labour market experience, gender diversity and the success of women-owned enterprises. Analytical Studies Branch Research Paper Series, no. 447. Statistics Canada Catalogue no. 11F0019M. Ottawa: Statistics Canada.
Hakim, C. 1989. “New recruits to self-employment in the 1980’s.” Employment Gazette 97: 286–297.
Hebert, C. Forthcoming. Gender Stereotypes and Entrepreneur Financing. Working paper. Available at: https://ssrn.com/abstract=3318245.
Industry Canada. 2015. Majority Female-owned Small and Medium-sized Enterprises. Special Edition: Key Small Business Statistics, May 2015. Ottawa: Industry Canada.
Jeon, S. H. and Y. Ostrovsky. 2016. Balancing family and fork: transition to self-employment among new mothers. Analytical Studies Branch Research Paper Series, no. 385. Statistics Canada Catalogue no. 11F0019M. Ottawa: Statistics Canada.
Kim, P., H. Aldrich, and L. Keister. 2006. “Access (Not) Denied: The Impact of Financial, Human, and Cultural Capital on Entrepreneurial Entry in the United States.” Small Business Economics 27: 5–22.
Kirkwood, J. 2009. “Motivational factors in a push‐pull theory of entrepreneurship.” Gender in Management 24 (5): 346-364.
Klyver, K., S. Nielsen, and M. Evald. 2013. “Women’s self-employment: an act of institutional (dis) integration? A multilevel, cross-country study.” Journal of Business Venturing 28 (4): 474–488.
Lazear, E.P. 2005. “Entrepreneurship.” Journal of Labor Economics 23: 649–680.
Levine, R., and Y. Rubinstein. 2017. “Smart and illicit: Who becomes an entrepreneur and do they earn more?” Quarterly Journal of Economics 132 (2): 963–1018.
Leung, D., Y. Ostrovsky, and G., Picot. 2018. The Financing of Immigrant-owned Firms in Canada. Analytical Studies Branch Research Paper Series, no. 404. Statistics Canada Catalogue no. 11F0019M. Ottawa: Statistics Canada.
Lin, Z., G. Picot, and J. Compton. 2000. The Entry and Exit Dynamics of Self-Employment in Canada. Analytical Studies Branch Research Paper Series, no. 134. Statistics Canada Catalogue no. 11F0019M. Ottawa: Statistics Canada.
Myers, S., and N. Majluf. 1984. “Corporate Financing and Investment Decisions When Firms Have Information That Investors Do Not Have.” Journal of Financial Economics 13: 187–221.
Ozcan, B. 2011. “Only the lonely? The influence of spouse on the transition to self-employment.” Small Business Economics 37 (4): 465–492.
Parker, S., and R. Martin. 2004. “Explaining International Variations in Self-Employment: Evidence from a Panel of OECD Countries.” Southern Economic Journal 71: 287–301.
Paulson, A.L., and R.M. Townsend. 2004. “Entrepreneurship and financial constraints in Thailand.” Journal of Corporate Finance 10 (2): 229–262.
Rosa, J., and D. Sylla. 2016. A Comparison of the Performance of Majority Female-owned and Majority Male-owned Small and Medium-sized Enterprises. Centre for Special Business Projects. Ottawa: Industry Canada.
Shinnar, S.R., and C.A. Young. 2008. “Hispanic Immigrant Entrepreneurs in Las Vegas Metropolitan Area: Motivations for Entry into and Outcomes of Self Employment.” Journal of Small Business Management 46 (2): 242–262.
Van Der Zwan, P., I. Verheul, and A. Thurik. 2012. “The entrepreneurial ladder, gender, and regional development.” Small Business Economics, Springer 39 (3): 627–643.
Wennekers, A., L. Uhlaner, and R. Thurik. 2002. “Entrepreneurship and its Conditions: A Macro Perspective.” International Journal of Entrepreneurship Education 1 (1).
- Date modified: