
Analytical Studies Branch Research Paper Series
The Long-term Labour Market Integration of Refugee Claimants Who Became Permanent Residents in Canada
Skip to text
Text begins
Abstract
Canada offers refugee protection to individuals who have a well-founded fear of persecution or face other personal dangers in their home country. Although refugee claimants seek asylum in Canada for humanitarian reasons, their labour market outcomes play a crucial role in their successful integration. Using landing and tax data, this study compares the long-term labour market outcomes of refugee claimants who eventually became permanent residents in Canada (RC-PRs) with those of government-assisted refugees (GARs) and privately sponsored refugees (PSRs), as well as with refugee claimants who did not become permanent residents in Canada (RC-NPRs). The findings indicate that although RC-PRs were considerably more likely to collect social assistance and less likely to report employment income than PSRs one year after making a refugee claim, their outcomes improved at a significantly faster rate. In fact, four years after making their claim, RC-PRs were about as likely to collect social assistance or report employment income as PSRs who landed four years earlier—a finding that more or less remained even after 13 years. Successive cohorts of RC-PRs and PSRs have fared equally well in the Canadian labour market. In general, GARs were significantly more likely to collect social assistance and considerably less likely to report employment income than RC-PRs and PSRs. Although RC-NPRs were generally as likely to collect social assistance as RC-PRs, they were the least likely of all four groups to report employment income. Moreover, when they did report employment income, their employment income levels were the lowest of all four groups.
Executive summary
Although refugee claimants seek asylum in Canada for humanitarian reasons, their labour market outcomes play a crucial role in their successful integration, which is why it is important to monitor the degree of labour market success achieved by refugee claimants.
This study compares the long-term labour market outcomes of refugee claimants who eventually became permanent residents in Canada (RC-PRs) with those of government-assisted refugees (GARs) and privately sponsored refugees (PSRs), as well as with refugee claimants who did not become permanent residents in Canada (RC-NPRs). To do so, the study uses data on landings from the Longitudinal Immigration Database (IMDB) and income tax from the T1 Family File (T1FF). The study builds on Lu, Frenette and Schellenberg (2015) in three important ways. First, it focuses not only on receipt of social assistance, but also on two key labour market outcomes available in the tax data: receipt of employment income and average employment income. Second, the study adopts a long-term perspective in tracking labour market outcomes, highlighting outcomes up to 13 years after the initial claim. Third, the study constructs three relevant comparison groups for refugee claimants: GARs, PSRs and RC-NPRs.
The findings of this study indicate that, although RC-PRs were considerably more likely to collect social assistance and less likely to report employment income than PSRs one year after making a refugee claim, their outcomes improved at a significantly faster rate. In fact, four years after making their claim, RC-PRs were about as likely to collect social assistance or report employment income as PSRs who landed four years earlier—a finding that more or less remained even after 13 years. Successive cohorts of RC-PRs and PSRs have fared equally well in the Canadian labour market. In general, GARs were significantly more likely to collect social assistance and considerably less likely to report employment income than RC-PRs and PSRs. Although RC-NPRs were generally as likely to collect social assistance as RC-PRs, they were the least likely of all four groups to report employment income. Moreover, when they did report employment income, their employment income levels were the lowest of all four groups.
Future research could try to uncover why the labour market outcomes of RC-PRs converged with those of PSRs over time. One possibility is that RC-PRs may actively invest in their human capital by pursuing a postsecondary education, which could benefit them in the long run. To investigate this possibility, the linked IMDB–T1FF would need to be linked to the Postsecondary Student Information System (PSIS), which includes virtually all postsecondary enrolments and graduations in the public postsecondary system. The PSIS also identifies individuals who attended a postsecondary institution to upgrade their basic skills, which may include language training and is another way to improve one’s labour market position.
As the Government of Canada contends with the implications of the unprecedented global COVID-19 pandemic, the findings from this research highlight the potential labour market challenges vulnerable groups such as resettled refugees and refugee claimants may face. The lockdown measures enacted by governments to contain the spread of the virus have resulted in a major economic recession that has left many Canadians unemployed. Immigrants who land at the beginning of a recession are at a disadvantage compared with immigrants who land amid stronger macroeconomic conditions (Aydemir 2003). While this poses an issue across immigrant categories, it is particularly concerning for resettled refugees and refugee claimants, who are admitted on a humanitarian basis rather than on their ability to integrate into the Canadian labour market. Therefore, the economic downturn resulting from the COVID-19 pandemic may ultimately lead to an even larger gap between refugees and the Canadian-born population.
1 Introduction
Refugees may be admitted to Canada through the Refugee and Humanitarian Resettlement Program (RHRP), which is intended for individuals from outside of Canada who need protection, or the In-Canada Asylum Program (ICAP), which is for individuals making refugee protection claims from within Canada. These programs reflect Canada’s international and domestic obligations concerning individuals in need of protection, which include the 1951 Convention Relating to the Status of Refugees; the United Nations Convention against Torture and Other Cruel, Inhuman or Degrading Treatment or Punishment; and the Canadian Charter of Rights and Freedoms.
Through the RHRP, refugees are selected overseas either as government-assisted refugees (GARs), who are referred by the office of the United Nations High Commissioner for Refugees and supported through the federally funded Resettlement Assistance Program (RAP), or as privately sponsored refugees (PSRs), who are sponsored and supported by voluntary groups.Note Alternatively, the ICAP provides refugee protection for individuals in Canada who have a well-founded fear of persecution for reasons of race, religion, nationality, membership in a particular social group or political opinion, or who are at risk of torture or cruel or unusual punishment in their home countries. Adjudication of their claim is made by the Immigration and Refugee Board of Canada (IRB) and based on whether they meet the United Nations convention definition of a refugee or are a person in need of protection based on the Immigration and Refugee Protection Act (IRPA).
Although refugee claimants seek asylum in Canada for humanitarian reasons, their labour market outcomes play a crucial role in their successful integration. Immigration, Refugees and Citizenship Canada provides open work permits to refugee claimants so that they can support themselves as they await a decision on their claim, which may reduce their dependence on social assistance programs administered by the provinces and territories. To apply for a work permit, a refugee claimant must have first completed their initial eligibility interview and had their claim referred to the IRB. In addition to providing refugee claimants with the means to work legally in Canada, work permits also allow refugee claimants to receive a temporary social insurance number, which is valid for five years. They may also receive certain tax benefits related to residency and employment, such as the Goods and Services Tax/Harmonized Sales Tax (GST/HST) credit, the Canada Workers Benefit and employment insurance.
Refugees admitted through the RHRP have access to federally funded settlement services both prior to arrival and immediately upon landing. Comparatively, refugee claimants do not have access to settlement services, with the exception of refugee claimants who live in Quebec, where claimants are eligible to receive settlement support from the province. These services are available only to refugee claimants after their claim has been accepted by the IRB. In the interim, provinces and territories are responsible primarily for providing support to refugee claimants who are awaiting a decision on their claim. This support includes social assistance, emergency housing, education and temporary health services.
Previous research (Lu, Frenette and Schellenberg 2015) examined social assistance receipt among refugee claimants who eventually became permanent residents (RC-PRs) over a period of four years. They found that, in the year after they made their initial refugee claim, 65% to 85% of claimants lived in a family that collected social assistance depending on the estimation approach. Among those whose claim was still active after four years, the share of claimants who received social assistance declined by just over half, to 25% to 40%. In comparison, an estimated 8% of the Canadian population received social assistance income over the period of study.
While this approach is highly informative, it is focused only on government assistance rather than on labour market success more specifically. Moreover, refugee claimants are often starting their lives over as they escape harmful conditions in their home country and, as a result, adjusting to the host country’s labour market may require far more than four years.
Using data on landings from the Longitudinal Immigration Database (IMDB) and income tax from the T1 Family File (T1FF), the current study investigates the long-term labour market success of RC-PRs in Canada. The study builds on Lu, Frenette and Schellenberg (2015) in three important ways. First, it focuses not only on social assistance receipt, but also on two key labour market outcomes available in the tax data: receipt of employment income and average employment income. Second, the study adopts a long-term perspective in tracking labour market outcomes, highlighting outcomes up to 13 years after the initial claim. Third, the study constructs three relevant comparison groups for refugee claimants who eventually became permanent residents: GARs, PSRs and RC-NPRs.Note
The next sections describes the data and methodology used in the study, followed by a presentation of the main results. The study concludes by summarizing the results and discussing potential avenues for future research.
2 Methods
This study focuses primarily on the labour market integration of RC-PRs in Canada. A refugee claimant is a person who has submitted a refugee claim but has not yet received legal status from the government. These individuals will be compared with three other types of refugees admitted to Canada primarily for non-economic reasons: GARs, PSRs and refugee claimants who did not eventually become permanent residents over the period of study (RC-NPRs). A GAR is a refugee whose initial resettlement in Canada is entirely supported by the Government of Canada or the Quebec government through the RAP. A PSR is a refugee whose initial resettlement in Canada is supported and funded by Canadian citizens and permanent residents who may sponsor a refugee as members of organizations, associations and groups.
The data come from two sources: landing records and taxation data, both of which are included in the IMDB.
The IMDB contains immigrant landing records from 1980 onward, as well as personal and family-level T1 tax data (T1FF) from 1982 onward. From the landing records, the following characteristics observed at landing were used in this study: immigrant admission category, sex, age, educational attainment and country of birth. All of this information—except educational attainment—is also available for individuals who did not become permanent residents. As a result, RC-NPRs were not included in the multivariate analyses.
This study uses information from the T1FF on social assistance receipt and employment income. Social assistance income consists of monthly payments to families from the provinces and territories based on a means-tested approach to meet basic economic needs. Although only one member of a family can receive payment per month (i.e., the principal claimant), only the spouse with the higher net income can claim the amount on the T1 personal income tax return. Because social assistance is designed to meet family needs, all family members can benefit from the payments. As a result, social assistance is measured at the family level in this study, i.e., all family members are considered to have collected social assistance in a given tax year if any member reports a positive amount of social assistance income. Similarly, the dollar amount of social assistance is expressed as a per capita (family member) measure.
Total employment income is the sum of income from three sources: T4 wages and salaries (from paid jobs), net self-employment income (self-employment income or loss from a business, profession, commission, farming or fishing) and other employment income (e.g., research grants, royalties, employee profit-sharing plans) Any individual reporting a positive amount of T4 wages and salaries or other employment income, or a non-zero amount of gross self-employment income from any of the five possible self-employment activities is coded as receiving employment income.
The analysis was divided into two parts. The first part followed one cohort over a long period of time. Specifically, the refugee claimant sample was limited to those who made their claim in 2003, were between 25 and 44 years old in 2004, appeared in the T1FF in all years from 2004 to 2016, and landed (or not) by 2016. The parameters for GARs and PSRs were modified slightly, as there is no claim period for these categories. In particular, GARs and PSRs include all those who landed in 2003, were between 25 and 44 years old in 2004, and appeared in T1FF in all years from 2004 to 2016.Note
For the second part of the analysis, multiple cohorts were examined over a shorter period of time. The 1999 to 2010 cohorts are defined as above, except that they were followed for six years only.
3 Results
3.1 The 2003 cohort with 13-year follow-up
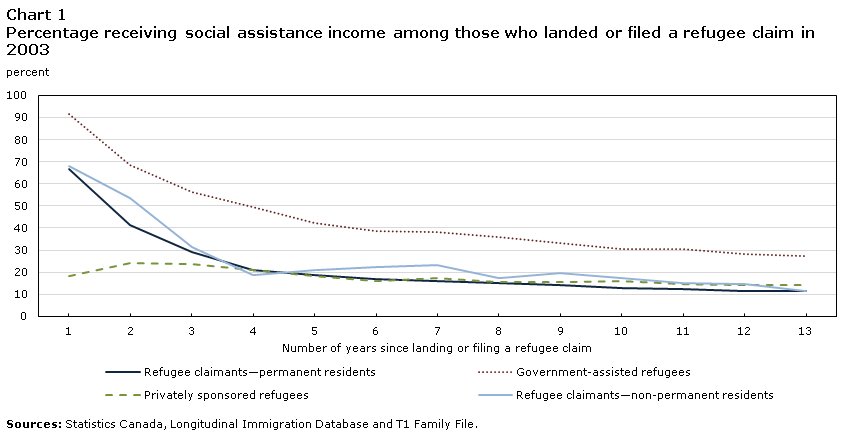
Chart 1 shows the proportion of RC-PRs and RC-NPRs who reported receiving social assistance by the number of years since initiating their claim, compared with the share of GARs and PSRs who received social assistance since landing. For all groups, 2003 was used as the reference year (either when they made their claim or landed).
Data table for Chart 1
| Number of years since landing or filing a refugee claim | Refugee claimants—permanent residents | Government-assisted refugees | Privately sponsored refugees | Refugee claimants—non-permanent residents |
|---|---|---|---|---|
| percent | ||||
| 1 | 66.5 | 91.6 | 18.4 | 68.1 |
| 2 | 41.4 | 68.5 | 24.1 | 53.6 |
| 3 | 29.1 | 56.4 | 23.7 | 31.2 |
| 4 | 21.1 | 49.5 | 21.0 | 18.8 |
| 5 | 18.9 | 42.4 | 18.2 | 21.0 |
| 6 | 16.8 | 38.7 | 16.2 | 22.5 |
| 7 | 16.1 | 38.4 | 17.4 | 23.2 |
| 8 | 15.2 | 35.9 | 15.7 | 17.4 |
| 9 | 14.3 | 33.4 | 15.6 | 19.6 |
| 10 | 12.7 | 30.4 | 15.9 | 17.4 |
| 11 | 12.6 | 30.3 | 14.7 | 15.2 |
| 12 | 11.6 | 28.3 | 14.4 | 14.5 |
| 13 | 11.4 | 27.2 | 14.3 | 11.6 |
| Sources: Statistics Canada, Longitudinal Immigration Database and T1 Family File. | ||||
One year after making their initial claim, about two-thirds (66.5%) of RC-PRs collected social assistance—almost the same as RC-NPRs (68.1%). Although these rates were well below the rate for GARs (91.6%), they were considerably higher than that reported for PSRs (18.4%). The high rate of social assistance receipt among GARs may be attributable to the RAP, which provides income support to GARs to cover basic needs for their first year in Canada. This is captured in the IMDB as a social assistance payment for GARs during the initial year after landing. Comparatively, the lower rate of social assistance among PSRs may be attributable in part to conditions of the private sponsorship agreement, which stipulate that sponsors must agree to provide the refugees with care, lodging, settlement assistance and support for the duration of the sponsorship period—typically one year. These comparisons changed considerably with more time spent in the country. Among PSRs, the share who collected social assistance income remained relatively stable over time, dropping moderately from 18.4% one year after landing to 14.3% after 13 years. This is not surprising, as the share of individuals collecting social assistance was relatively low to begin with.
In contrast, GARs, RC-PRs and RC-NPRs became much less likely to receive social assistance as they settled into their new country. For GARs, the rate of social assistance receipt declined from 91.6% one year after landing to 27.2% after 13 years. Similarly, the share of RC-PRs who collected social assistance declined from 66.5% one year after their initial claim to 11.4% after 13 years. A similar decline was registered among RC-NPRs over the same period (from 68.1% to 11.6%). For all three groups, the decline in social assistance receipt was primarily the result of changes in the first three or four years after making their initial claim. The proportion of RC-PRs, RC-NPRs and PSRs who collected social assistance was about the same from four years after making their claim and beyond.
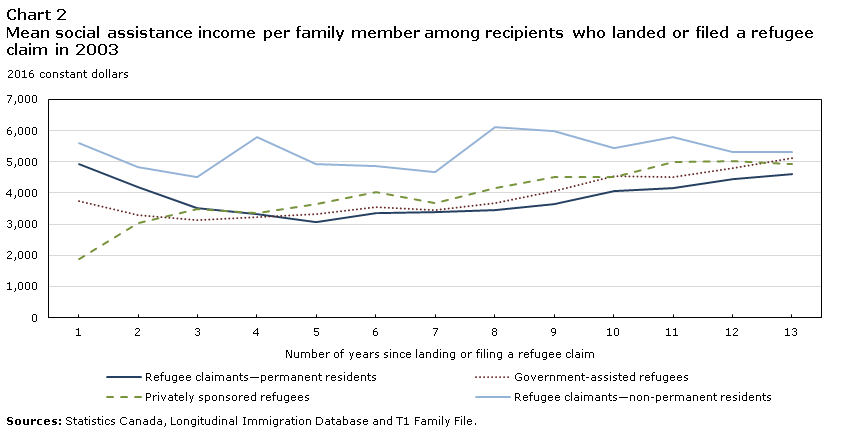
Average social assistance per family member among recipients rose steadily—more or less—for both types of resettled refugees (Chart 2). Among those who collected social assistance, the average amount received by GARs rose from $3,754 one year after landing to $5,130 after 13 years. For PSRs, the average amount rose from $1,866 to $4,923 over the same period. Although it is not possible to discern from the tax data how many months of the year someone collects social assistance, it is possible that increasing dollar amounts of assistance are the result of selection effects: individuals who collect social assistance many years after landing may be longer-term beneficiaries who have had less success in the labour market. However, this is not the case for both types of refugee claimants. In the case of RC-PRs, the average amount of social assistance received was $4,920 one year after making their claim. This was well above the rates reported by both resettled refugee groups. Although the average social assistance collected by refugee claimants declined moderately for several years, it rose again to $4,611 after 13 years. In the case of RC-NPRs, average social assistance did not vary much over the period, generally remaining between $5,000 and $6,000. By the end of the period, average assistance collected was more or less the same for all four groups.
Data table for Chart 2
| Number of years since landing or filing a refugee claim | Refugee claimants—permanent residents | Government-assisted refugees | Privately sponsored refugees | Refugee claimants—non-permanent residents |
|---|---|---|---|---|
| 2016 constant dollars | ||||
| 1 | 4,920 | 3,754 | 1,866 | 5,594 |
| 2 | 4,204 | 3,288 | 3,048 | 4,824 |
| 3 | 3,519 | 3,139 | 3,490 | 4,499 |
| 4 | 3,338 | 3,228 | 3,366 | 5,801 |
| 5 | 3,081 | 3,322 | 3,656 | 4,920 |
| 6 | 3,354 | 3,561 | 4,041 | 4,874 |
| 7 | 3,388 | 3,439 | 3,665 | 4,671 |
| 8 | 3,456 | 3,683 | 4,156 | 6,123 |
| 9 | 3,652 | 4,065 | 4,527 | 5,990 |
| 10 | 4,067 | 4,529 | 4,516 | 5,452 |
| 11 | 4,152 | 4,528 | 4,994 | 5,789 |
| 12 | 4,462 | 4,816 | 5,016 | 5,330 |
| 13 | 4,611 | 5,130 | 4,923 | 5,317 |
| Sources: Statistics Canada, Longitudinal Immigration Database and T1 Family File. | ||||
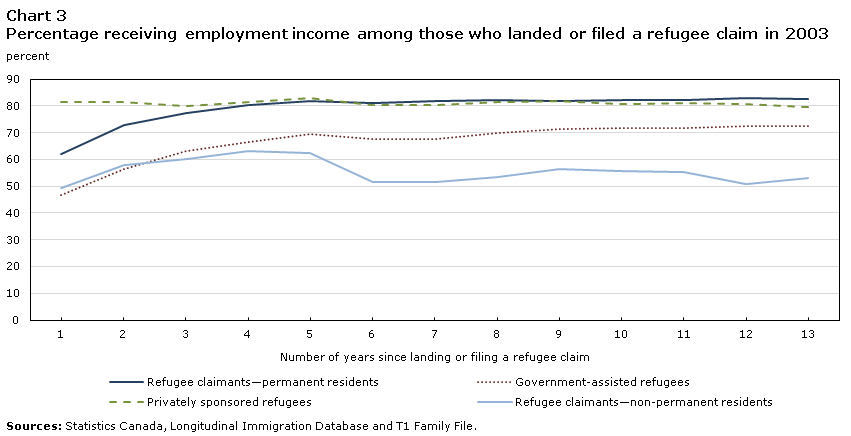
Chart 3 shows the percentage of individuals who reported employment income by years since landing or filing a refugee claim in 2003. PSRs were the most likely to report employment income one year after landing (81.6%). In contrast, 62.0% of RC-PRs, 49.3% of RC-NPRS and 46.7% of GARs reported employment income after one year. Among resettled refugees, PSRs may have been more likely to report employment income one year after landing in part because of their sponsorship network and because they are more likely than GARs to speak an official language at landing.
While the share of PSRs with employment income remained fairly stable over the 13-year period, the share of GARs and RC-PRs who reported employment income increased steadily in the first four or five years, eventually settling at 72.4% and 82.6%—respectively—13 years after the reference year. As was the case with the percentage receiving social assistance income, RC-PRs reached virtual parity with PSRs after four years. In contrast, the share of RC-NPRs who reported employment income remained close to 50% throughout the period.
Data table for Chart 3
| Number of years since landing or filing a refugee claim | Refugee claimants—permanent residents | Government-assisted refugees | Privately sponsored refugees | Refugee claimants—non-permanent residents |
|---|---|---|---|---|
| percent | ||||
| 1 | 62.0 | 46.7 | 81.6 | 49.3 |
| 2 | 72.7 | 56.6 | 81.4 | 58.0 |
| 3 | 77.1 | 63.1 | 80.0 | 60.1 |
| 4 | 80.4 | 66.6 | 81.4 | 63.0 |
| 5 | 81.7 | 69.3 | 83.1 | 62.3 |
| 6 | 80.9 | 67.8 | 80.3 | 51.4 |
| 7 | 81.7 | 67.6 | 80.2 | 51.4 |
| 8 | 82.1 | 69.7 | 81.5 | 53.6 |
| 9 | 82.0 | 71.5 | 81.7 | 56.5 |
| 10 | 82.3 | 71.6 | 80.5 | 55.8 |
| 11 | 82.3 | 71.8 | 80.9 | 55.1 |
| 12 | 82.8 | 72.5 | 80.5 | 50.7 |
| 13 | 82.6 | 72.4 | 79.5 | 52.9 |
| Sources: Statistics Canada, Longitudinal Immigration Database and T1 Family File. | ||||
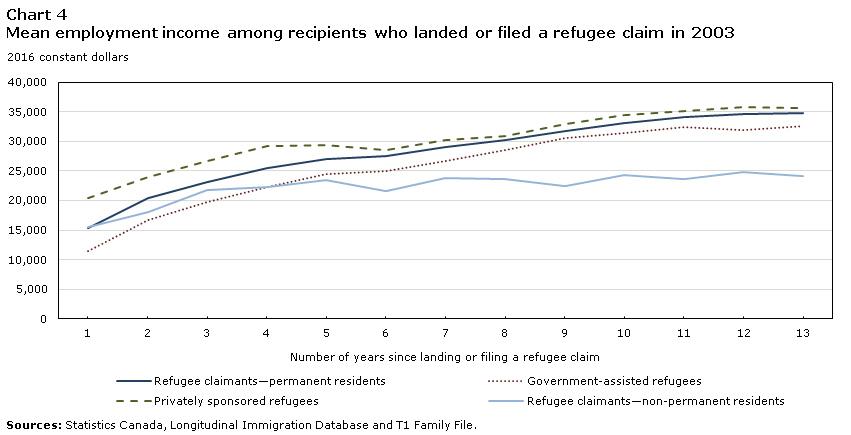
Among those who were employed, employment income rose considerably for RC-PRs, GARs and PSRs, and rose moderately for RC-NPRs over the study period (Chart 4). For example, the average employment income of employed RC-PRs increased from $15,413 one year after making their claim in 2003 to $34,825 after 13 years. Similar improvements were recorded by both resettled refugee groups, resulting in all three refugee groups reporting similar employment income by the end of the period. Average employment income rose at the same rate among RC-NPRs for about four years after their claim, then remained steady afterwards. By the end of the study period, average employment income among recipients was about $10,000 lower for RC-NPRs than for other groups.
Data table for Chart 4
| Number of years since landing or filing a refugee claim | Refugee claimants—permanent residents | Government-assisted refugees | Privately sponsored refugees | Refugee claimants—non-permanent residents |
|---|---|---|---|---|
| 2016 constant dollars | ||||
| 1 | 15,413 | 11,485 | 20,495 | 15,603 |
| 2 | 20,487 | 16,745 | 23,996 | 18,063 |
| 3 | 23,160 | 19,797 | 26,657 | 21,833 |
| 4 | 25,454 | 22,258 | 29,200 | 22,307 |
| 5 | 27,086 | 24,526 | 29,395 | 23,516 |
| 6 | 27,593 | 24,971 | 28,576 | 21,683 |
| 7 | 29,047 | 26,640 | 30,279 | 23,858 |
| 8 | 30,278 | 28,529 | 30,858 | 23,624 |
| 9 | 31,746 | 30,526 | 32,850 | 22,406 |
| 10 | 33,158 | 31,387 | 34,492 | 24,345 |
| 11 | 34,151 | 32,340 | 35,179 | 23,663 |
| 12 | 34,553 | 31,967 | 35,731 | 24,825 |
| 13 | 34,825 | 32,533 | 35,567 | 24,051 |
| Sources: Statistics Canada, Longitudinal Immigration Database and T1 Family File. | ||||
Refugees and refugee claimants in Canada may have very different socioeconomic characteristics, which could explain the results presented so far. To address this issue, Table 1 displays the socioeconomic characteristics of each group. While RC-PRS and RC-NPRs shared many characteristics, there were clear differences between both refugee claimant groups and refugees.
Indeed, a higher share of RC-PRs were men (51.9%), than PSRs (49.9%) and GARs (46.0%).Note RC-PRs were also generally more educated at landing than resettled refugees—49.1% held a postsecondary qualification, compared with 24.2% of GARs and 21.5% of PSRs. Moreover, RC-PRs were also more likely to hold a degree than resettled refugees—one-quarter (25.0%) of RC-PRs held a bachelor’s degree or higher, compared with 14.4% of GARs and 8.0% of PSRs. Place of birth also varied by group. Compared with refugees, RC-PRs were more likely to have been born in Southern Asia, Eastern Asia, Europe, or South and Central America, but less likely to have been born in Africa, the Middle East, Oceania or other parts of Asia. In general, age (at landing for resettled refugees or upon making a refugee claim for RC-PRs) did not vary significantly by group, with PSRs being moderately younger (31.8 years) than GARs and RC-PRs (32.5 for both groups).
| Refugee claimants—permanent residents | Government-assisted refugees | Privately sponsored refugees | Refugee claimants—non-permanent residents | |
|---|---|---|---|---|
| Male (percent) | 51.9 | 46.0 | 49.9 | 50.7 |
| Age in 2003 (mean years) | 32.5 | 32.5 | 31.8 | 32.7 |
| percent | ||||
| Level of education at landing | ||||
| No postsecondary—0 to 9 years of schooling | 14.1 | 39.8 | 25.5 | Note ...: not applicable |
| No postsecondary—10 to 12 years of schooling | 25.5 | 27.7 | 43.4 | Note ...: not applicable |
| No postsecondary—13 or more years of schooling | 11.3 | 8.3 | 9.6 | Note ...: not applicable |
| Trade certificate | 7.3 | 3.3 | 4.9 | Note ...: not applicable |
| College certificate or diploma | 16.9 | 6.5 | 8.5 | Note ...: not applicable |
| Bachelor's degree | 20.9 | 13.1 | 6.5 | Note ...: not applicable |
| Master's degree | 3.4 | 0.9 | 1.2 | Note ...: not applicable |
| Doctorate | 0.7 | 0.3 | 0.3 | Note ...: not applicable |
| Not stated | 0.0 | 0.0 | 0.0 | Note ...: not applicable |
| World area of birth | ||||
| Europe | 7.8 | 1.7 | 1.1 | 5.2 |
| Africa and the Middle East | 24.4 | 47.8 | 62.3 | 22.4 |
| Southern Asia | 24.8 | 1.2 | 2.1 | 26.1 |
| Eastern Asia | 6.6 | 0.5 | 0.0 | 14.2 |
| Oceania and other Asia | 5.7 | 24.0 | 28.7 | 4.5 |
| South and Central America | 30.9 | 24.8 | 5.7 | 27.6 |
| United States or other | 0.0 | 0.0 | 0.1 | 0.0 |
| number | ||||
| Number of observations | 6,407 | 2,011 | 1,057 | 138 |
|
... not applicable Sources: Statistics Canada, Longitudinal Immigration Database and T1 Family File. |
||||
To the extent that sex, age, educational attainment and world area of birth influence labour market performance, it is important to take these factors into consideration when comparing such outcomes across groups.Note Therefore, the following analysis examined how differences in individual characteristics can account for the variation in outcomes among RC-PRs, GARs and PSRs.Note To this end, results from ordinary least squares (OLS) regressions are shown in Table 2. Four models were estimated—one for each of the outcomes examined so far. The key coefficients were those associated with the refugee and immigration category variables.Note Note
| Received social assistance income | Mean social assistance income per family member among recipients | Received employment income | Mean employment income among recipients | |||||
|---|---|---|---|---|---|---|---|---|
| Coefficient | Standard error | Coefficient | Standard error | Coefficient | Standard error | Coefficient | Standard error | |
| Refugee or immigration status | ||||||||
| Refugee claimants—permanent residents (reference) | Note ...: not applicable | Note ...: not applicable | Note ...: not applicable | Note ...: not applicable | Note ...: not applicable | Note ...: not applicable | Note ...: not applicable | Note ...: not applicable |
| Government-assisted refugees | 0.087 | 0.010 | -147 | 274 | -0.051 | 0.011 | -2,136 | 855 |
| Privately sponsored refugees | -0.050 | 0.013 | -527 | 404 | 0.024 | 0.014 | 1,394 | 1,066 |
| Male | -0.101 | 0.007 | -645 | 229 | 0.162 | 0.008 | 10,198 | 601 |
| Age in 2003 | -0.016 | 0.008 | 110 | 249 | 0.043 | 0.010 | -324 | 722 |
| Age squared in 2003 | 0.000 | 0.000 | 1 | 4 | -0.001 | 0.000 | 1 | 11 |
| Level of education at landing | ||||||||
| No postsecondary—0 to 9 years of schooling (reference) | Note ...: not applicable | Note ...: not applicable | Note ...: not applicable | Note ...: not applicable | Note ...: not applicable | Note ...: not applicable | Note ...: not applicable | Note ...: not applicable |
| No postsecondary—10 to 12 years of schooling | -0.060 | 0.010 | -514 | 278 | 0.047 | 0.012 | 817 | 894 |
| No postsecondary—13 or more years of schooling | -0.065 | 0.014 | -109 | 396 | 0.048 | 0.015 | 3,867 | 1,154 |
| Trade certificate | -0.075 | 0.016 | 16 | 517 | 0.074 | 0.019 | 2,537 | 1,370 |
| College certificate or diploma | -0.092 | 0.013 | -852 | 397 | 0.084 | 0.014 | 4,671 | 1,068 |
| Bachelor's degree | -0.101 | 0.012 | -409 | 362 | 0.073 | 0.013 | 10,107 | 1,006 |
| Master's degree | -0.117 | 0.023 | -2,690 | 881 | 0.070 | 0.026 | 15,930 | 1,938 |
| Doctorate | -0.127 | 0.048 | 3,668 | 1,794 | 0.106 | 0.054 | 30,063 | 3,897 |
| Not stated | -0.080 | 0.342 | N/A | N/A | 0.136 | 0.385 | -15,143 | 25,666 |
| World area of birth | ||||||||
| Europe | -0.074 | 0.016 | 206 | 587 | 0.029 | 0.018 | -88 | 1,352 |
| Africa and the Middle East (reference) | Note ...: not applicable | Note ...: not applicable | Note ...: not applicable | Note ...: not applicable | Note ...: not applicable | Note ...: not applicable | Note ...: not applicable | Note ...: not applicable |
| Southern Asia | -0.031 | 0.011 | -766 | 361 | -0.026 | 0.013 | -8,429 | 954 |
| Eastern Asia | -0.154 | 0.018 | 245 | 1,016 | 0.075 | 0.021 | -10,281 | 1,496 |
| Oceania and other Asia | 0.073 | 0.012 | 284 | 293 | -0.092 | 0.013 | -3,722 | 1,060 |
| South and Central America | -0.097 | 0.010 | -754 | 319 | 0.074 | 0.011 | 1,832 | 798 |
| United States or other | -0.085 | 0.242 | N/A | N/A | 0.093 | 0.272 | 34,419 | 18,159 |
| Intercept | 0.450 | 0.142 | 552 | 4,235 | 0.011 | 0.160 | 36,080 | 12,120 |
|
... not applicable N/A = not applicable due to lack of observations in category. Notes: Adjusted R2 for each category are: Category 1: "Received social assistance income" is 0.087. Category 2: "Mean social assistance income per family member among recipients" is 0.079. Category 3: "Received emploment income" is 0.074. Category 4: "Mean employment income among recipients" is 0.083. The number of observations for each category are: Category 1: "Received social assistance income" is 9,475. Category 2: "Mean social assistance income per family member among recipients" is 1,426. Category 3: "Received emploment income" is 9,475. Category 4: "Mean employment income among recipients" is 7,587. Sources: Statistics Canada, Longitudinal Immigration Database and T1 Family File. |
||||||||
After accounting for differences in sex, age, level of education at landing and world area of birth, the gap between GARs and RC-PRs in the probability of receiving social assistance income 13 years after landing or making a refugee claim was smaller. The difference in the unadjusted probability between GARs and RC-PRs 13 years after landing or making their claim was 15.8 percentage points (Chart 1), but fell to 8.7 percentage points after adjusting for the covariates shown in Table 2. Chart 1 also indicated that the gap between PSRs and RC-PRs in the probability of receiving social assistance income after 13 years was 2.9 percentage points. After accounting for the differences in key determinants of social assistance receipt, PSRs were less likely to receive social assistance income than RC-PRs (a difference of 5.0 percentage points).
According to the results in Chart 2, there were only slight differences in social assistance income across refugee and immigration groups who were recipients 13 years after landing or making their claim. Table 2 suggests that there was not much of a change once differences in sex, age, education level and world area of birth were taken into account.
GARs and PSRs were less likely than RC-PRs to receive employment income 13 years after landing or making their claim—differences of 10.2 and 3.1 percentage points, respectively (Chart 3). Once differences in sex, age, education and world area of birth were taken into account, the gap between GARS and RC-PRs was reduced substantially (to 5.1 percentage points), while the gap between PSRs and RC-PRs was reversed (to a 2.4 percentage-point difference).
Among employment income recipients, there were only small relative differences in the amount received 13 years after landing or making a claim between the three groups (Chart 4). Much like in the case of social assistance income, adjusting for sex, age, education and world area of birth did not change this result.
Collectively, the results in Table 2 suggest that PSRs and—especially—GARs possess certain characteristics associated with a higher probability of receiving social assistance income and a lower probability of receiving employment income. Once differences in these factors were taken into account, the gaps in social assistance and employment income receipt rates declined (or reversed, in the case of PSRs and RC-PRs).
3.2 The 1999 to 2010 cohorts with six-year follow-up
It is also of interest to analyze how the labour market outcomes of refugee claimants and refugees vary across landing cohorts. Table 3 indicates that the decline in social assistance rates among RC-PRs and RC-NPRs in the first six years following their initial claim was remarkably similar for all cohorts between 1999 and 2010. For example, almost three-quarters (73.8%) of RC-PRs from the 1999 cohort collected social assistance one year after initiating their claim. After six years, 20.5% reported receiving social assistance. Similarly, the 2010 cohort registered social assistance rates of 71.1% and 19.8% one and six years after their initial claim, respectively. Similar declines in social assistance rates were observed among every cohort in the analysis period.
| Group and cohort | Number of years since landing or filing a refugee claim | |||||
|---|---|---|---|---|---|---|
| 1 | 2 | 3 | 4 | 5 | 6 | |
| percent | ||||||
| Refugee claimants—permanent residents | ||||||
| 1999 | 73.8 | 47.3 | 36.4 | 28.0 | 23.9 | 20.5 |
| 2000 | 73.8 | 50.6 | 35.6 | 28.6 | 23.8 | 20.8 |
| 2001 | 77.3 | 47.9 | 33.3 | 26.0 | 22.0 | 18.6 |
| 2002 | 73.2 | 46.5 | 32.5 | 24.1 | 19.4 | 17.6 |
| 2003 | 67.0 | 42.1 | 29.8 | 22.1 | 19.9 | 18.1 |
| 2004 | 73.3 | 47.6 | 32.7 | 24.8 | 21.9 | 20.2 |
| 2005 | 71.5 | 45.0 | 31.0 | 25.3 | 22.3 | 19.3 |
| 2006 | 73.3 | 47.3 | 34.7 | 28.5 | 24.4 | 21.3 |
| 2007 | 77.4 | 47.9 | 37.8 | 29.8 | 24.1 | 19.9 |
| 2008 | 77.0 | 52.7 | 37.8 | 29.6 | 23.7 | 20.1 |
| 2009 | 74.0 | 49.8 | 35.2 | 26.9 | 22.2 | 19.8 |
| 2010 | 71.1 | 46.4 | 33.7 | 27.1 | 22.4 | 19.8 |
| Government-assisted refugees | ||||||
| 1999 | 90.8 | 60.0 | 42.7 | 31.3 | 25.2 | 22.2 |
| 2000 | 90.3 | 68.9 | 52.9 | 43.0 | 34.5 | 30.7 |
| 2001 | 89.4 | 68.4 | 57.1 | 46.7 | 39.9 | 35.8 |
| 2002 | 91.1 | 69.8 | 57.4 | 46.0 | 39.4 | 36.9 |
| 2003 | 91.4 | 68.1 | 56.3 | 49.4 | 42.0 | 38.3 |
| 2004 | 92.7 | 70.5 | 55.0 | 47.7 | 40.8 | 39.6 |
| 2005 | 92.7 | 69.7 | 59.4 | 51.8 | 47.3 | 43.9 |
| 2006 | 90.5 | 66.6 | 58.5 | 52.7 | 47.3 | 41.6 |
| 2007 | 95.0 | 71.3 | 63.5 | 55.3 | 46.9 | 40.8 |
| 2008 | 93.6 | 72.7 | 62.1 | 52.8 | 45.3 | 40.4 |
| 2009 | 96.9 | 75.1 | 65.1 | 57.8 | 49.4 | 43.9 |
| 2010 | 96.7 | 77.4 | 67.0 | 57.2 | 52.1 | 48.4 |
| Privately sponsored refugees | ||||||
| 1999 | 24.5 | 31.9 | 28.1 | 23.2 | 19.9 | 19.0 |
| 2000 | 21.8 | 27.2 | 27.6 | 26.6 | 23.1 | 19.8 |
| 2001 | 20.8 | 27.2 | 28.3 | 26.1 | 22.9 | 19.2 |
| 2002 | 22.3 | 29.0 | 27.9 | 25.7 | 22.2 | 22.7 |
| 2003 | 18.4 | 23.6 | 23.2 | 20.7 | 18.4 | 16.3 |
| 2004 | 18.1 | 22.5 | 22.0 | 21.3 | 20.8 | 20.6 |
| 2005 | 19.0 | 22.5 | 23.2 | 22.5 | 24.0 | 22.1 |
| 2006 | 14.6 | 21.2 | 22.1 | 22.1 | 21.2 | 20.1 |
| 2007 | 15.9 | 21.4 | 23.0 | 22.6 | 20.4 | 18.9 |
| 2008 | 17.9 | 22.9 | 23.2 | 20.3 | 17.4 | 16.3 |
| 2009 | 21.7 | 26.9 | 26.0 | 23.7 | 22.1 | 20.9 |
| 2010 | 20.4 | 25.8 | 24.2 | 22.8 | 22.8 | 21.2 |
| Refugee claimants—non-permanent residents | ||||||
| 1999 | 74.0 | 46.9 | 31.4 | 25.3 | 23.1 | 18.2 |
| 2000 | 72.4 | 50.3 | 32.6 | 23.0 | 18.9 | 15.6 |
| 2001 | 72.5 | 44.2 | 29.0 | 19.9 | 16.3 | 12.5 |
| 2002 | 60.6 | 36.4 | 21.8 | 14.9 | 11.3 | 10.3 |
| 2003 | 62.0 | 36.0 | 23.3 | 14.6 | 13.6 | 11.2 |
| 2004 | 68.5 | 38.3 | 20.7 | 14.2 | 13.0 | 11.9 |
| 2005 | 72.1 | 37.0 | 25.1 | 19.4 | 20.7 | 16.1 |
| 2006 | 73.1 | 44.1 | 29.3 | 24.0 | 20.2 | 13.2 |
| 2007 | 77.7 | 46.0 | 37.2 | 26.8 | 18.2 | 15.0 |
| 2008 | 78.7 | 50.8 | 36.9 | 27.0 | 20.9 | 17.0 |
| 2009 | 77.2 | 54.4 | 38.8 | 29.0 | 25.6 | 21.8 |
| 2010 | 80.0 | 51.6 | 35.2 | 27.5 | 22.6 | 21.0 |
| Sources: Statistics Canada, Longitudinal Immigration Database and T1 Family File. | ||||||
Table 3 also shows how the outcomes of resettled refugees have evolved over time. Among PSRs from all landing cohorts, social assistance rates were comparatively low in the initial year since landing, and generally declined moderately or remained stable over the first six years in Canada. In contrast, social assistance rates were highest among GARs. Although the share receiving social assistance income declined substantially over the first six years in Canada for all landing cohorts, the decrease was most notable among earlier cohorts. For example, 90.8% of GARs who landed in 1999 reported social assistance income one year later. Six years after landing, this figure had dropped to 22.2%. Comparatively, 96.7% of GARs who landed in 2010 reported receiving social assistance income one year later, with this share dropping to 48.4% six years after landing. The smaller declines in the share receiving social assistance among later cohorts may be attributable in part to the introduction of the IRPA in 2002. Under the IRPA, the Government of Canada placed a greater emphasis on the need for protection and less of an emphasis on a refugee’s ability to become established in Canada. Resettled refugees are also exempt from inadmissibility to Canada for financial reasons or for excessive demand on health or social services.
For all cohorts, RC-PRs and RC-NPRs also reported improvements in employment income with more time spent in Canada (Table 4). For example, 59.7% of RC-PRs who made their claim in 2010 reported employment income in the following tax year, and this figure increased to 80.9% six years after their claim. This was virtually unchanged from previous cohorts dating back to 1999.
| Group and cohort | Number of years since landing or filing a refugee claim | |||||
|---|---|---|---|---|---|---|
| 1 | 2 | 3 | 4 | 5 | 6 | |
| percent | ||||||
| Refugee claimants—permanent residents | ||||||
| 1999 | 58.1 | 68.9 | 73.7 | 76.0 | 78.3 | 79.6 |
| 2000 | 55.6 | 67.2 | 72.9 | 76.5 | 78.1 | 79.2 |
| 2001 | 56.2 | 69.8 | 76.1 | 78.1 | 79.8 | 81.0 |
| 2002 | 57.2 | 70.5 | 75.8 | 79.3 | 80.9 | 81.3 |
| 2003 | 61.9 | 72.5 | 77.2 | 80.0 | 81.3 | 80.3 |
| 2004 | 56.4 | 69.3 | 75.3 | 79.2 | 79.2 | 79.4 |
| 2005 | 57.1 | 70.4 | 76.9 | 78.3 | 79.6 | 80.8 |
| 2006 | 57.8 | 70.5 | 72.7 | 76.3 | 79.6 | 81.2 |
| 2007 | 61.0 | 68.7 | 73.2 | 77.1 | 80.0 | 81.7 |
| 2008 | 56.9 | 68.4 | 73.1 | 77.3 | 79.3 | 81.8 |
| 2009 | 58.8 | 67.8 | 74.4 | 76.9 | 80.1 | 81.3 |
| 2010 | 59.7 | 69.6 | 73.7 | 77.1 | 79.0 | 80.9 |
| Government-assisted refugees | ||||||
| 1999 | 53.1 | 66.5 | 71.9 | 76.2 | 77.3 | 78.9 |
| 2000 | 47.2 | 57.6 | 64.5 | 69.1 | 70.5 | 72.2 |
| 2001 | 48.0 | 56.5 | 62.4 | 66.3 | 68.2 | 69.8 |
| 2002 | 46.3 | 58.9 | 64.8 | 69.3 | 71.2 | 71.0 |
| 2003 | 48.0 | 57.7 | 64.0 | 67.5 | 69.8 | 67.9 |
| 2004 | 49.1 | 59.3 | 64.4 | 68.6 | 66.8 | 66.6 |
| 2005 | 43.4 | 53.9 | 60.6 | 59.9 | 60.7 | 63.6 |
| 2006 | 49.3 | 56.5 | 58.2 | 61.0 | 64.2 | 66.7 |
| 2007 | 44.0 | 48.8 | 54.6 | 59.3 | 62.7 | 65.4 |
| 2008 | 42.1 | 49.7 | 54.8 | 59.4 | 62.8 | 65.4 |
| 2009 | 35.3 | 43.9 | 51.2 | 55.9 | 60.1 | 62.3 |
| 2010 | 32.9 | 41.6 | 48.2 | 54.0 | 57.1 | 59.0 |
| Privately sponsored refugees | ||||||
| 1999 | 76.4 | 73.9 | 75.7 | 77.9 | 77.5 | 78.7 |
| 2000 | 78.0 | 77.2 | 76.6 | 77.0 | 78.4 | 80.4 |
| 2001 | 77.6 | 74.3 | 75.5 | 77.4 | 77.4 | 78.8 |
| 2002 | 77.5 | 77.7 | 77.9 | 78.6 | 77.4 | 77.4 |
| 2003 | 82.3 | 82.6 | 81.3 | 82.2 | 83.1 | 80.4 |
| 2004 | 81.1 | 79.5 | 81.2 | 81.7 | 78.5 | 78.3 |
| 2005 | 81.5 | 81.1 | 82.1 | 79.1 | 78.3 | 80.9 |
| 2006 | 83.8 | 83.1 | 79.1 | 79.3 | 80.6 | 80.9 |
| 2007 | 81.4 | 77.1 | 75.6 | 77.7 | 77.9 | 77.5 |
| 2008 | 79.5 | 77.7 | 77.9 | 78.8 | 79.3 | 80.0 |
| 2009 | 71.6 | 72.3 | 74.4 | 74.9 | 76.0 | 76.2 |
| 2010 | 69.9 | 70.2 | 71.4 | 72.1 | 73.8 | 73.5 |
| Refugee claimants—non-permanent residents | ||||||
| 1999 | 59.7 | 71.7 | 72.9 | 74.1 | 75.0 | 75.2 |
| 2000 | 54.9 | 69.9 | 75.7 | 77.1 | 77.3 | 78.5 |
| 2001 | 59.6 | 76.0 | 80.7 | 81.8 | 81.3 | 81.3 |
| 2002 | 67.2 | 79.9 | 82.0 | 80.9 | 81.6 | 80.4 |
| 2003 | 66.3 | 77.3 | 79.5 | 81.4 | 80.8 | 77.6 |
| 2004 | 62.4 | 78.3 | 81.3 | 83.1 | 78.9 | 79.2 |
| 2005 | 65.8 | 77.8 | 79.7 | 79.7 | 77.1 | 75.0 |
| 2006 | 63.4 | 73.8 | 75.8 | 77.5 | 77.7 | 78.7 |
| 2007 | 66.1 | 73.1 | 77.8 | 80.4 | 80.7 | 80.7 |
| 2008 | 61.4 | 72.2 | 75.8 | 78.1 | 79.2 | 78.8 |
| 2009 | 56.0 | 64.4 | 70.4 | 71.6 | 70.7 | 70.3 |
| 2010 | 54.9 | 68.8 | 71.3 | 73.5 | 74.0 | 72.8 |
| Sources: Statistics Canada, Longitudinal Immigration Database and T1 Family File. | ||||||
In comparison, PSRs from all landing cohorts registered a relatively higher incidence of earnings in the initial years since landing. On average, between 70% and 80% of PSRs who landed between 1999 and 2010 reported employment income one year after landing. However, unlike refugee claimants, the incidence of earnings among PSRs from all landing cohorts remained relatively stable with more time spent in the country.
GARs registered the lowest incidence of earnings one year after landing, particularly among more recent cohorts. Slightly more than half (53.1%) of GARs who landed in 1999 reported employment income in the first year after landing, compared with about one-third (32.9%) of GARs who landed in 2010. However, for all landing cohorts, the share with earnings consistently increased with time in Canada, although generally did not reach parity with the share of PSRs and refugee claimants with earnings. The lower incidence of earnings among GARs who landed in more recent years is consistent with changes in the refugee selection policy through the enactment of IRPA, which prioritize refugee selection based on humanitarian need, rather than on their ability to integrate into the labour market.
Once again, these findings may also result from differences in socioeconomic characteristics and how they have changed over time.Note Among earlier cohorts, RC-PRs and RC-NPRS were considerably more likely than resettled refugees to be men. Of those who landed in 1999, 59.7% of RC-PRs and 61.1% of RC-NPRS were men, compared with 48.1% of GARs and 48.6% of PSRs. In the 2010 cohort, there was a slightly higher share of men among PSRs (54.0%) than among RC-PRs (52.8%), while 45.4% of GARs in this cohort were men. The proportion of RC-NPRs who were men remained relatively high among the 2010 cohort (62.6%).
Refugee claimants and resettled refugees were roughly the same age when they made their claim or landed, and this was the case independent of landing cohort.
While RC-PRs generally held higher educational credentials than GARs and PSRs throughout the period of study, the magnitude of the difference varied considerably across cohorts. For example, 15.2% of RC-PRs from the 1999 cohort held a bachelor’s degree, compared with 10.8% of GARs and 12.6% of PSRs. The gaps were wider among the 2010 cohort, as 19.4% of RC-PRs held a bachelor’s degree, compared with 10.7% of GARs and 10.0% of PSRs.
The distribution of world area of birth among refugees varied considerably over time, which may not be surprising, as claims and resettlement initiatives may depend in large part on the timing of events in other countries. For example, almost one-third (31.7%) of RC-PRs and one-quarter (25.0%) of RC-NPRs from the 1999 cohort were born in Southern Asia, compared with 0.1% of GARs and 1.4% of PSRs. Among the 2010 cohort, 14.3% of RC-PRs, 29.3% of RC-NPRs, 24.0% of GARs and 2.2% of PSRs came from this region.
To account for these differences, OLS models were estimated separately for RC-PRs, GARs and PSRs for both outcomes—social assistance receipt and employment income receipt—six years after landing or making the initial claim.Note The key coefficients were those associated with the cohort indicator variables (Table 5).
| Refugee claimants—permanent residents | Government—assisted refugees | Privately sponsored refugees | ||||||||||
|---|---|---|---|---|---|---|---|---|---|---|---|---|
| Received social assistance income | Received employment income | Received social assistance income | Received employment income | Received social assistance income | Received employment income | |||||||
| Coefficient | Standard error | Coefficient | Standard error | Coefficient | Standard error | Coefficient | Standard error | Coefficient | Standard error | Coefficient | Standard error | |
| Cohort | ||||||||||||
| 1999 (reference) | Note ...: not applicable | Note ...: not applicable | Note ...: not applicable | Note ...: not applicable | Note ...: not applicable | Note ...: not applicable | Note ...: not applicable | Note ...: not applicable | Note ...: not applicable | Note ...: not applicable | Note ...: not applicable | Note ...: not applicable |
| 2000 | 0.000 | 0.006 | -0.003 | 0.006 | 0.067 | 0.012 | -0.063 | 0.011 | -0.004 | 0.018 | 0.018 | 0.018 |
| 2001 | -0.027 | 0.006 | 0.021 | 0.006 | 0.092 | 0.013 | -0.079 | 0.012 | -0.023 | 0.018 | 0.019 | 0.018 |
| 2002 | -0.023 | 0.007 | 0.013 | 0.007 | 0.071 | 0.014 | -0.056 | 0.013 | 0.021 | 0.019 | -0.005 | 0.019 |
| 2003 | -0.021 | 0.007 | 0.004 | 0.007 | 0.094 | 0.014 | -0.097 | 0.014 | -0.042 | 0.018 | 0.018 | 0.018 |
| 2004 | -0.001 | 0.007 | -0.005 | 0.007 | 0.102 | 0.014 | -0.105 | 0.014 | 0.003 | 0.018 | -0.004 | 0.019 |
| 2005 | -0.014 | 0.007 | 0.014 | 0.007 | 0.139 | 0.015 | -0.121 | 0.014 | 0.024 | 0.018 | 0.016 | 0.019 |
| 2006 | 0.002 | 0.007 | 0.018 | 0.007 | 0.117 | 0.014 | -0.096 | 0.014 | -0.004 | 0.018 | 0.021 | 0.018 |
| 2007 | -0.003 | 0.007 | 0.016 | 0.007 | 0.097 | 0.015 | -0.094 | 0.014 | -0.017 | 0.018 | -0.010 | 0.018 |
| 2008 | -0.002 | 0.007 | 0.017 | 0.007 | 0.092 | 0.015 | -0.101 | 0.014 | -0.038 | 0.018 | 0.008 | 0.018 |
| 2009 | -0.007 | 0.007 | 0.015 | 0.007 | 0.116 | 0.015 | -0.129 | 0.014 | 0.008 | 0.017 | -0.025 | 0.017 |
| 2010 | -0.013 | 0.008 | 0.017 | 0.007 | 0.153 | 0.015 | -0.162 | 0.014 | 0.010 | 0.017 | -0.055 | 0.017 |
| Female | -0.116 | 0.003 | 0.193 | 0.003 | -0.125 | 0.006 | 0.230 | 0.005 | -0.101 | 0.006 | 0.219 | 0.006 |
| Age in year of cohort | 0.015 | 0.003 | -0.013 | 0.003 | 0.025 | 0.007 | -0.001 | 0.006 | -0.001 | 0.008 | 0.000 | 0.008 |
| Age in year of cohort squared | 0.000 | 0.000 | 0.000 | 0.000 | 0.000 | 0.000 | 0.000 | 0.000 | 0.000 | 0.000 | 0.000 | 0.000 |
| Level of education at landing | ||||||||||||
| No postsecondary—0 to 9 years of schooling (reference) | Note ...: not applicable | Note ...: not applicable | Note ...: not applicable | Note ...: not applicable | Note ...: not applicable | Note ...: not applicable | Note ...: not applicable | Note ...: not applicable | Note ...: not applicable | Note ...: not applicable | Note ...: not applicable | Note ...: not applicable |
| No postsecondary—10 to 12 years of schooling | -0.054 | 0.005 | 0.055 | 0.004 | -0.094 | 0.007 | 0.085 | 0.007 | -0.084 | 0.008 | 0.100 | 0.008 |
| No postsecondary—13 or more years of schooling | -0.091 | 0.005 | 0.083 | 0.005 | -0.133 | 0.011 | 0.098 | 0.010 | -0.100 | 0.013 | 0.099 | 0.013 |
| Trade certificate | -0.120 | 0.006 | 0.101 | 0.006 | -0.150 | 0.012 | 0.113 | 0.011 | -0.092 | 0.014 | 0.106 | 0.014 |
| College certificate or diploma | -0.109 | 0.005 | 0.108 | 0.005 | -0.136 | 0.011 | 0.112 | 0.011 | -0.087 | 0.012 | 0.078 | 0.012 |
| Bachelor's degree | -0.114 | 0.005 | 0.097 | 0.005 | -0.138 | 0.010 | 0.105 | 0.009 | -0.110 | 0.012 | 0.095 | 0.012 |
| Master's degree | -0.130 | 0.009 | 0.091 | 0.009 | -0.131 | 0.026 | 0.088 | 0.025 | -0.159 | 0.032 | 0.129 | 0.032 |
| Doctorate | -0.112 | 0.018 | 0.058 | 0.017 | -0.216 | 0.064 | 0.123 | 0.061 | -0.006 | 0.102 | 0.025 | 0.103 |
| Not stated | -0.121 | 0.069 | 0.029 | 0.068 | N/A | N/A | N/A | N/A | N/A | N/A | N/A | N/A |
| World area of birth | ||||||||||||
| Europe | -0.098 | 0.006 | 0.030 | 0.006 | -0.122 | 0.010 | 0.018 | 0.009 | -0.096 | 0.018 | 0.058 | 0.019 |
| Africa and the Middle East (reference) | Note ...: not applicable | Note ...: not applicable | Note ...: not applicable | Note ...: not applicable | Note ...: not applicable | Note ...: not applicable | Note ...: not applicable | Note ...: not applicable | Note ...: not applicable | Note ...: not applicable | Note ...: not applicable | Note ...: not applicable |
| Southern Asia | -0.077 | 0.004 | 0.013 | 0.004 | -0.037 | 0.016 | 0.060 | 0.016 | -0.049 | 0.027 | 0.010 | 0.027 |
| Eastern Asia | -0.189 | 0.006 | 0.078 | 0.006 | -0.015 | 0.058 | -0.033 | 0.055 | -0.165 | 0.115 | -0.012 | 0.116 |
| Oceania and other Asia | -0.032 | 0.007 | -0.002 | 0.007 | 0.039 | 0.007 | -0.083 | 0.007 | 0.164 | 0.008 | -0.158 | 0.008 |
| South and Central America | -0.103 | 0.004 | 0.065 | 0.004 | -0.145 | 0.008 | 0.114 | 0.008 | -0.025 | 0.019 | 0.038 | 0.019 |
| United States or other | -0.022 | 0.084 | -0.045 | 0.083 | 0.135 | 0.232 | 0.357 | 0.220 | -0.085 | 0.219 | 0.034 | 0.222 |
| Intercept | 0.073 | 0.057 | 0.831 | 0.056 | -0.145 | 0.111 | 0.734 | 0.105 | 0.131 | 0.128 | 0.759 | 0.129 |
|
... not applicable N/A = not applicable due to lack of observations in category. Notes: Adjusted R2 for each category are: Category 1: "Refugee claimants-permanent residents -Received social assistance income" is 0.051 and "Refugee claimants-permanent residents -Received employment income" is 00.70. Category 2: "Government-assisted refugees - Received social assistance income" is 0.086 and "Government-assisted refugees - Received employment income" is 0.109. Category 3: "Privately sponsored refugees - Received social assistance income" is 0.092 and "Privately sponsored refugees - Received employment income" is 0.135. Number of observations for each category are: Category 1: "Refugee claimants-permanent residents -Received social assistance income" is 76,332 and "Refugee claimants-permanent residents -Received employment income" is 76,332. Category 2: "Government-assisted refugees - Received social assistance income" is 28,623 and "Government-assisted refugees - Received employment income" is 28,623. Category 3: "Privately sponsored refugees - Received social assistance income" is 14,517 and "Privately sponsored refugees - Received employment income" is14,517. Sources: Statistics Canada, Longitudinal Immigration Database and T1 Family File. |
||||||||||||
After accounting for differences in sex, age, education level at landing and world area of birth, the results for RC-PRs and PSRs from tables 3 and 4 were more or less the same as those in Table 5. For example, the percentage of RC-PRs who received social assistance income six years after making their initial claim declined by 0.8 percentage points from the 1999 cohort to the 2010 cohort (Table 3). The adjusted decline in Table 5 was just slightly larger (1.3 percentage points). Similarly, the percentage of PSRs who received employment income six years after landing declined by 5.3 percentage points from the 1999 cohort to the 2010 cohort (Table 4). The adjusted decline reported in Table 5 is virtually the same (5.5 percentage points).
The percentage of GARs who received social assistance income six years after landing increased by 26.2 percentage points between the 1999 and 2010 cohorts (Table 3), but dropped to 15.3 percentage points after accounting for differences in sex, age, education and world area of birth.
Results from Table 4 show that the incidence of earnings declined by 19.9 percentage points from the 1999 cohort to the 2010 cohort. This decline was slightly smaller in the multivariate framework (16.2 percentage points) (Table 5).
4 Conclusion
Refugee claimants come to Canada primarily to avoid persecution or other personal dangers in their home country. Although refugee claimants seek asylum in Canada for humanitarian reasons, their labour market outcomes play a crucial role in their successful integration. This study examined the long-term labour market success of refugee claimants by using government-assisted and privately sponsored refugees as benchmarks.
The findings indicate that, although RC-PRs were considerably more likely to collect social assistance and less likely to report employment income than PSRs one year after making a refugee claim, their outcomes improved at a significantly faster rate. In fact, four years after making their claim, RC-PRs were about as likely to collect social assistance or report employment income as PSRs who landed four years earlier—a finding that more or less remained even after 13 years. Successive cohorts of RC-PRs and PSRs have fared equally well in the Canadian labour market. In general, GARs were significantly more likely to collect social assistance and considerably less likely to report employment income than RC-PRs and PSRs. Although RC-NPRs were generally as likely to collect social assistance as RC-PRs, they were the least likely of all four groups to report employment income. Moreover, when they did report employment income, their employment income levels were the lowest of all four groups.
Future research could try to uncover why the labour market outcomes of RC-PRs converged with those of PSRs over time. One possibility is that RC-PRs may actively invest in their human capital by pursuing a postsecondary education, which could benefit them in the long run. To investigate this possibility, the IMDB-T1FF would need to be linked to the PSIS, which includes virtually all postsecondary enrolments and graduations in the public postsecondary system. The PSIS also identifies individuals who attended a postsecondary institution to upgrade their basic skills, which may include language training, and is another way to improve one’s labour market position.
As the Government of Canada contends with the implications of the unprecedented global COVID-19 pandemic, the findings from this research highlight the potential labour market challenges that vulnerable groups such as resettled refugees and claimants may face. The lockdown measures to contain the spread of the virus made it difficult or impossible for many Canadiansto work.Note Immigrants who land at the beginning of a recession are at a disadvantage compared with immigrants who land amid stronger macroeconomic conditions (Aydemir 2003). While this poses an issue across immigrant categories, it is particularly concerning for resettled refugees and claimants, who are admitted on a humanitarian basis rather than on their ability to integrate into the Canadian labour market. Therefore, the economic downturn resulting from the COVID-19 pandemic may ultimately lead to an even larger gap between refugees and the Canadian-born population.
References
Aydemir. 2003. Effects of Business Cycles on the Labour Market Assimilation of Immigrants. Analytical Studies Branch Research Paper Series, no. 203. Statistics Canada Catalogue no. 11F0019MIE. Ottawa: Statistics Canada.
Government of Canada. 2020. “Labour Force Survey, April 2020.” Statistics Canada. The Daily, May 8, 2020. Available at https://www150.statcan.gc.ca/n1/daily-quotidien/200508/dq200508a-eng.htm.
Lu, Y., M. Frenette, and G. Schellenberg. 2015. Social Assistance Receipt Among Refugee Claimants in Canada: Evidence from Linked Administrative Data Files. Economic Insights, no. 051. Statistics Canada Catalogue no. 11-626-X. Ottawa: Statistics Canada.
- Date modified: